A Simple Method to Measure Pretilt Angles of
Inverse Twisted Nematic Liquid Crystal Cells
Sheng-Ya Wang, Chia-Yi Lin, and Kei-Hsiung Yang
Abstract—We have developed a simple optical method based on measurements of phase retardation[1] versus out-of-plane cell ro-tation angle and data analyzed by extended Jones matrix method to obtain pretilt angles of inverse twisted nematic (ITN) and tilted homeotropic liquid crystal (LC) cells. In our Jones-matrix calcula-tions, we have assumed a constant pretilt angle as the LC-director tilt angles throughout the ITN cell as well as the tilted homeotropic cell. We have compared the measured pretilt angles of the ITN cell with those of an accompanying tilted homeotropic (ATH) cell. The results showed increasing discrepancies between them with increasing rubbing depth for LC alignments. However, these dis-crepancies could be explained by assuming that the surface-LC tilt angle of the ITN cell was equal to the measured pretilt angle of the ATH cell to generate a convex-type LC-director-deformation pro-file within the ITN cell based on Oseen-Frank elastic continuum theory with infinite anchoring energies. The average of the LC-di-rector tilt angles over this profile was equivalent to the measured pretilt angle of the ITN cell.
Index Terms—Inverse twisted nematic (ITN), liquid crystals (LCs), measurement, phase measurement, pretilt angle.
I. INTRODUCTION
C
ONVENTIONAL multi-domain vertically-aligned (VA) liquid crystal (LC) modes, MVA [2] and PVA [3], have been widely used in large televisions due to extremely high intrinsic contrast ratio with comparable wide viewing angles as multi-domain in-plane-switching (IPS) mode. However, both MVA and PVA had slow response times switching between the darkest to nearby dark levels. Recently, multi-domain inverse twisted nematic (ITN) [4] was introduced to overcome the above shortcoming. ITN cell is an abbreviation of 90 -twist VA cell with pretilt angles that offers excellent dark state, high transmission, faster response times, and a better achro-matic voltage-transmittance curve than conventional MVA and PVA. The pretilt angle of the ITN LC mode is an important parameter which affects its contrast ratio, response time and electric-field-induced optical rotatory power [5], [6]. Jo et al. [7] have reported that, when applied voltages were substantially larger than the threshold voltage of an ITN cell with a weak azimuthally-anchoring energy, its electro-optical effects be-haved as an ECB (Electrically Controlled Birefringence) mode Manuscript received May 19, 2014; revised June 20, 2014; accepted June 30, 2014. Date of publication July 11, 2014; date of current version November 10, 2014.S.-Y. Wang and C.-Y. Lin are with the Photonic Systems, National Chiao Tung University, Tainan City 711, Taiwan (e-mail: [email protected]; [email protected]).
K.-H. Yang is with the Imaging and Biomedical Photonics, National Chiao Tung University, Tainan City 711, Taiwan (e-mail: [email protected]).
Color versions of one or more of the figures are available online at http:// ieeexplore.ieee.org.
Digital Object Identifier 10.1109/JDT.2014.2334897
instead of an ITN mode. Mada and Saito [8] have reported that azimuthally anchoring energy of an ITN cell was increased by decreasing its pretilt angle further away from cell normal. Therefore, accurate methods to determine pretilt angles of ITN cells are important to correlate their electro-optical behaviors with measured pretilt angles. As a common practice, the pretilt angles of an ITN cell were determined by an accompanying tilted homeotropic (ATH) cell made of same alignment material and LC mixture with same fabrication process. Although the pretilt angles of ATH cells could be determined by measuring the changes in cell capacitance or optical transmission by rotating the ATH cell within a sufficiently large and uniform magnitude field, such method was not only complicated and expensive but also not extendable to the ITN cell. Therefore, we used simple optical method by Scheffer and Nehring [9] to determine the pretilt angle of the ATH cell from measurements of phase retardation [1] versus out-of-plane cell rotation angle. However, the pretilt angles of aged ITN cells in different fields of applications could not be inferred from the pretilt angles of aged ATH cells due to different aging environments and processes. Consequently, direct measurements of the pretilt angles in ITN cells become very important. Recently, Lo et
al.[10] have used a transmitted-ellipsometry and
Mueller-ma-trix methods with Genetic Algorithm curve-fitting approach to obtain the parameters of cell gap, twist angle, rubbing directions and pretilt angle in a TN cell (but not ITN cell due to lack of experimental sample). However, we believe that it is difficult to obtain accurate ITN-cell parameters by using the published method of Lo et al. due to the existences of multi-pa-rameter-coupled ambiguous solutions in their approach.
In this paper, we extended the crystal-rotation methods [1], [9], [11], [12] with a new configuration of LC cell orientation for the measurements of phase retardation versus light incidence angle (Ph-I.A.) curve of an ITN cell and determined the posi-tion of extremum angle on that curve to deduce its pretilt angle. The method of deduction was based on extended Jones matrix method to calculate the Ph-I.A. curve of an ITN cell for the de-termination of angular position of extremum on that curve and compared it to the experimental result. We have found that the angular position of extremum was only sensitive to changes in pretilt angle but insensitive to variations in cell gap. We mea-sured the Ph-I.A. curve by a Zeeman-laser system and obtained the angular position of the extremum leading to the determina-tion of the pretilt angle of the ITN cell. We also used a simuladetermina-tion program based on Oseen-Frank elastic continuum theory with infinite polar and azimuthally anchoring energies to calculate the LC-director-deformation (LCDD) profile within the ITN LC cell by assuming a same surface-LC pretilt angle adjacent both cell substrates. We have found that, with the surface-LC pretilt 1551-319X © 2014 IEEE. Personal use is permitted, but republication/redistribution requires IEEE permission.
angle of the ITN cell equal to the measured pretilt angle of the accompanying ATH cell, the average of bulk-LC tilt angles across the profile within the ITN cell was equal to the measured pretilt angle of the ITN cell. Our results showed discrepancies between measured pretilt angles of the ITN cell and the ATH cell under a same rubbing-cloth depth (define as the decreased distance between center of rubbing roller to the surface of poly-imide (PI) film after touching by the rubbing cloth on the roller) for LC alignments. In this paper, we have explained the reasons to cause these discrepancies, and also show that the measured pretilt angles are insensitive to variations of the measured cell gap. We believe that the measured results provide a framework for investigating the relationship between the pretilt angles and electro-optical effects of ITN LC cells.
II. THEORY
In our previous publication [11], we have used extended Jones matrix method to calculate the transmissions of a TN cell at oblique incidences to determine its pretilt angle. How-ever, it is very complicated to calculate the reflections and transmissions at oblique incidences between two optical media using extended Jones matrix. Therefore, in this paper, we use extended Jones matrix [11], [13]–[15] to calculate the Ph-I.A. curves of any ITN cell at oblique incidences. We assume that the tilt angle is the angle between the LC director and the – plane and the LC tilt angles within an ITN cell are set as constant when the pretilt angles are between 82 and 90 , and the twist angles twist linearly from bottom to top substrates based on the assumption of infinite anchoring energies of the ITN cell. Therefore, an ITN cell is divided into layers and each layer can be approximated as an uniaxial anisotropic media shown in Fig. 1. The thickness of each layer equals to and the difference in ITN-LC director twist
orientations between two adjacent layers is . The
dielectric tensor for LC medium in each layer is shown in (1). (1)
Fig. 1. Coordinate scheme of the ITN cell and incident light.
(2) where and are the ordinary and extraordinary indices of refraction of the LC medium, is the pretilt angle of the ITN cell, and is the twist angle between the projection of the LC director on the – plane and the -axis. For the ITN cell, is set at 45 to 45 adjacent to bottom and top substrates, re-spectively. If the incident light lies in – plane, we assume that incident angle is the angle between and , and can be expressed as (3)
(3) (4) where is the wavelength of incident light. The transmitted wave after ITN cell at oblique incidence is related to the incident wave, as shown in (5)
(5) where the values are shown in (6)–(11) at the bottom of the page.
(6) (7) (8) (9) (10) (11)
TABLE I
LC PARAMETERSUSED INCALCULATION
Fig. 2. Extreme angle(angular position of extremum)-versus-pretilt angle when the cell gap is set at 5.5 m, and extreme angle-versus-cell gap when the pretilt angle is set at 88.5 .
Equation (5) is an extended-Jones-matrix representation for the ITN LCD. We, then, develop computer programs using mathematical software MATLAB according to (5) to calculate the phase retardations of the ITN cell at oblique incidences to obtain the Ph-I.A. curves.
LC cell parameters used in the calculation and experiment are shown in Table I. The ITN cell is divided into 180 layers so that the thickness of each layer is (5.5/180) m and the twist angle of LC director between two adjacent layers is . Then we set the incident angle to vary from 30 to 30 and use (5) to calculate the Ph-I.A. curve of the ITN cell using dif-ferent LC pretilt angles as a parameter. We, then, plot pretilt angle versus extremum angle obtained from Ph-I.A. curve of each cell shown as black line in Fig. 2. This curve shows the re-lationship between the angular positions of extrema on Ph-I.A. curves and pretilt angles that leads us to determine the pretilt angle for each ITN cell easily. This figure also implies that the extremum angle is sensitive to the change in pretilt angle with a
sensitivity of . In our
exper-iment, the angular precision is 0.1 equivalent to the minimum step of the motor-driven rotational stage. Therefore, the preci-sion of the measured pretilt angle is about 0.07 . Furthermore, we also calculated the angular position of extremum versus the ITN cell gap that varied 1 m from 5.5 m (the average di-ameter of ball spacers used to assemble the cell). The results were shown in the blue line ofFig. 2 indicating that the devi-ations in angular positions of extrema were negligibly small. This phenomenon occurred because the variations in cell gaps only changed the magnitudes of phase retardations of an ITN cell but had a negligible influence on the angular location of the extremum. On the other hand, pretilt angle was the angle be-tween – plane and -axis. Therefore, the angular position of
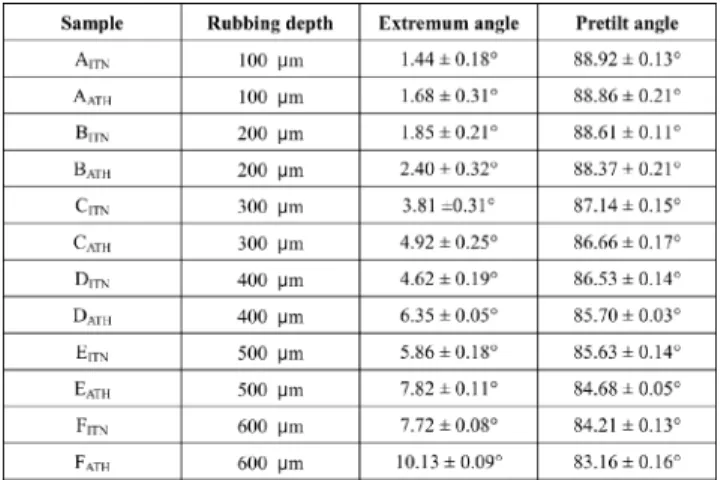
TABLE II
MEASUREDANGULARPOSITIONS OFEXTREMA ANDPRETILTANGLES FOR
ITNANDATH SAMPLES
extremum was sensitive to the pretilt angle when crystal rotation method was used. As a result, the angular position of extremum on the Ph-I.A. curve is only sensitive to change in pretilt angle but insensitive to a substantial change in the cell gap of ITN cell. The pretilt angles of ITN cells could be obtained by comparing the angular positions of extrema between calculated and exper-iment results.
III. EXPERIMENTS
ITN and ATH LC cells in a same batch were prepared by using same materials and by a standard cell fabrication process. Indium–tin–oxide (ITO)-coated glasses were cleaned by using detergent and de-ionized water. Then, a vertical-alignment PI provided by Innolux Corporation, Taiwan, was coated on the substrates by spin coating followed by baking at 215 C for imidization. By changing the rubbing depth between the rubbing cloth and baked PI films during rubbing process (The thickness of knitting textile fibers on the rubbing cloth is approximately 1000 m. Therefore, we could adjust rubbing depth from 100 to 600 m to control the rubbing strength [16]) for LC alignments, the pretilt angles of ITN and ATH cells could be controlled from 83 90 . ITN cells were assembled into left-hand-twisted cells composed of a nematic LC mixture with negative dielec-tric anisotropy (LC parameters shown in Table I) sandwiched between two vertically-tilted aligning PI films with rubbing di-rections perpendicular to each other. On the other hand, the ATH cells had anti-parallel rubbings on opposite PI-film-coated sub-strates. Both ITN and ATH cells were assembled with same
type of ball spacers (average m ). Samples
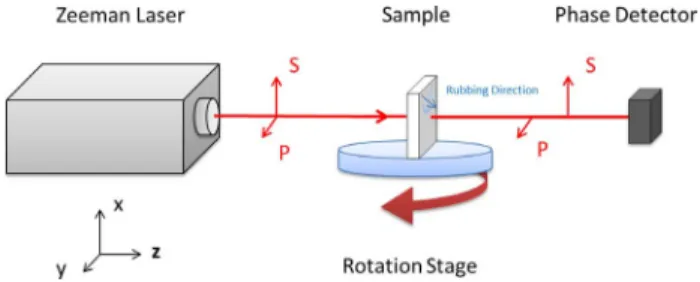
A, B, C, D, E and F shown in Table II were prepared with different rubbing depths in rubbing process where and represented the samples assembled into ITN and ATH cells, respectively. For the measurement of pretilt angles, a het-erodyne interference method [1] using a Zeeman-laser system was used to measure the Ph-I.A. curve for each sample. The experimental scheme was shown in Fig. 3 where, at normal in-cidence, the rubbing directions of rear and front substrates of the left-hand-twisted ITN cell were set at 135 and 225 from -axis, respectively, and bisected by the S-polarization of the incident laser beam. We, then, measured the Ph-I.A. curves of the filled and empty cells when the cells were rotated along an
Fig. 3. Crystal rotation method and LC cell orientation for the measurements of ITN pretilt angles by a Zeeman laser system.
Fig. 4. Measured and simulated phase retardation-versus-incident angle of and samples, respectively.
axis passing through the middle of the cell and parallel to the S-polarization of the incident laser beam, Our measured max-imum retardation on the Ph-I.A. curves of all empty cells was negligible because it was below the error of about 2 nm for any measurement points on the Ph-I.A. curves of filled LC cells. We conclude that the empty cells consisting of ITO-coated glass and rubbed PI films had negligible influence on the measured angular positions of extrema of filled-LC (ATH and ITN) cells.
IV. RESULTS ANDDISCUSSION
The measured Ph-I.A. curves of the and
sam-ples were shown in Fig. 4 in circles and squares, respectively, to indicate that increasing rubbing depth caused a shift in an-gular position of the extremum toward a larger value. There-fore, by comparing the measured angular positions of extrema on the Ph-I.A. curves in Fig. 4 with simulated results shown in Fig. 2, we have determined the pretilt angles of ITN cells. In addition, we plotted the fitting curves shown as solid curves in Fig. 4 by using extended Jones matrix to calculate the Ph-I.A. curves with input pretilt angles equal to the pretilt angles de-termined from Fig. 2 using the experimental data of Fig. 4. It shows that the calculated and measured Ph-I.A. curves agreed quite well with each other. It implies that our method is a simple and reliable way to measure the pretilt angles of ITN cells. The measured pretilt angles of the ITN cells and ATH cells were listed in Table II.
From Table II, the comparison between the measured pretilt angles of ITN and ATH cells could be analyzed by plotting the measured pretilt angle versus rubbing depth as shown in Fig. 5, implying that the pretilt angles of ITN cells deviated only
Fig. 5. Pretilt angle versus rubbing depth: red and black lines are for ATH and ITN cells, respectively.
Fig. 6. Simulated bulk-LC director deformation profiles within the ATH and ITN cells with surface-LC tilt angle as a parameter, respectively. Dash lines indicated the average LC-tilt angles over LC-director deformation profiles of ITN cells.
slightly from the pretilt angles of ATH cells when rubbing depth was smaller than 300 m. However, an increasing deviation ex-isted between the pretilt angles of ITN and ATH cells when rub-bing depth was larger than 300 m, with measured pretilt an-gles of an ITN cell always larger than those of the ATH cell. To explain the deviations, we utilized the LC simulation pro-gram (LCDST 6.0 provided by Dr. Jianmin Chen) based on the minimization of Oseen-Frank free energy and infinite anchoring energies to calculate the bulk-LCDD profile in tilt and twist an-gles within the ITN cell using different surface-LC tilt anan-gles as a parameter. By assuming that surface-LC tilt angles of both ITN and ATH cells varied from 83 89 , we obtained a zero twist within all ATH cells as expected but the twist angles in-creased linearly from bottom to top substrates within the ITN cells. However, the simulated LC-director tilt angles within the LCDD profile were not the same between ITN and ATH cell shown as triangle- and circle-dotted curves in Fig. 6, respec-tively. The curves in circles showed that the bulk-LC tilt angles were the same as the measured pretilt angles for the ATH cells. When the surface-LC tilt angle of an ITN cell was the same as that of the corresponding ATH cell, the ITN cell showed a
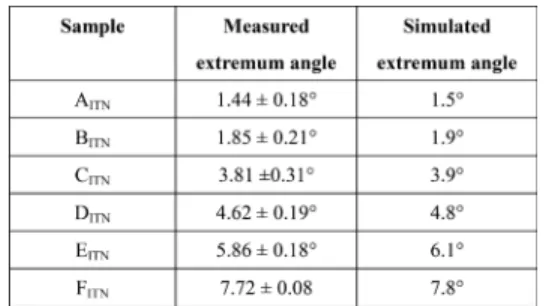
TABLE III
MEASURED ANDSIMULATEDEXTREMUMANGLES FORITN SAMPLES
convex-type LCDD profile due to the minimization of the free energy based on Oseen-Frank elastic continuum theory. Dash lines in Fig. 6 showed the calculated averages of the LC tilt an-gles over the LCDD profiles of ITN cells. The results in Fig. 6 showed that measured pretilt angle of an ITN cell, equal to the average of LC-director tilt angles over the LCDD profiles within the ITN cell, was always larger than the corresponding ATH cell. In order to estimate errors between measured and simulated angular positions of extrema of ITN cells, we assumed that the surface-LC tilt angle of the ITN cell was the same as the mea-sured pretilt angles of the ATH cell for the calculation of LCDD profile within the ITN cell. Using this profile and Jones matrix, we calculated the Ph-I.A. curve of the ITN cell to obtain simu-lated angular position of the extremum. The measured and sim-ulated angular positions of the extrema are listed in Table III. It indicated that the surface-LC tilt angle of each ITN cell had a negligible difference from the measured pretilt angle of the ATH cell. In other words, the average of the LC-direct tilt an-gles across this profile was equivalent to the measured pretilt angle of the ITN cell. The physical interpretation of above phe-nomenon is rather simple. By holding the top substrate of an ATH cell and twist the bottom substrate by 90 to form an ITN cell, the surface-LC tilt angles remain the same due to infinite anchoring energies but the bulk-LC tilt angles relax from a con-stant value to a convex-profile as shown in the triangle-dotted curves of Fig. 6.
V. CONCLUSION ANDDISCUSSION
For the first time, we have developed a simple and accurate method for determining pretilt angles of ITN cells. In our sim-ulations of Ph-I.A. curves, we have first assumed that the sur-face- and bulk-LC tilt angles within an ITN or ATH LC cell were a constant due to infinite anchoring energies and equal to the pretilt angle as it changed from 90 to 83 . For a given rubbing depth for LC alignments, using the above simulated Ph-I.A. curves to fit the experimental ones, the derived pretilt angle of the ITN cell was consistently larger that of the ATH cell. We have also observed that there existed an increasing dis-crepancy between the measured pretilt angles of the ITN and the ATH cells with increasing rubbing depth. The following in-tuitive physical model can be used to explain observed discrep-ancies. By holding the top substrate of an ATH cell and twist the bottom substrate by 90 to form a left-hand-twisted ITN cell consistent with the rubbing directions on the opposite PI films for LC alignment, the surface-LC tilt angles remain the same but the bulk-LC tilt angles relax from a constant value to a
convex-profile within the ITN cell based on Oseen-Frank elastic continuum theory with infinite anchoring energies. Using this profile, we re-calculated the Ph-I.A. curve to find out the cor-responding angular position of the extremum that agreed with experimental one for any rubbing depth from 100 to 600 m. We also calculated the average of the LC-direct tilt angles over this profile and verified that the average was equivalent to the measured pretilt angle of the ITN cell.
Our method was not only simple but also insensitive to the cell-gap variations away from the average-spacer-ball-diam-eter-equivalent cell gap of the ITN cell. Our approach may offer a significant help in studying the twisted effect of the ITN cell with different pretilt angles when voltages are applied to operate the ITN cell. It can be inferred that our method provides a simple way for the determination of pretilt angles of fresh and aged ITN cells used in different application fields. The results of this paper may serve as beginning for future studies to understand the relationship between the pretilt angles and electro-optical effects of ITN LC cells. Further studies are in progress.
ACKNOWLEDGMENT
The authors acknowledge Dr. S.-C. Jeng for providing LC material and Zeeman laser system for the measurements, and Dr. J. Chen ([email protected]) for providing the up-dated version of simulation software Liquid Crystal Display Simulation Tool 6.0 (LCDST 6.0).
REFERENCES
[1] S.-J. Huang and M.-H. Hsu, “Heterodyne method for determining the surface tilt angle of nematic liquid-crystal displays,” J. Soc. Inf.
Dis-play, vol. 14, no. 11, pp. 1039–1039, 2006.
[2] K. Omura, S. Kataoka, T. Sasaki, and Y. Koike, “Development of super-high-quality vertical alignment-mode LCD,” SID Dig., vol. 28, pp. 845–845, 1997.
[3] J.-O. Kwag, K.-C. Shin, J.-S. Kim, S.-G. Kim, and S.-S. Kim, “Imple-mentation of new wide viewing angle mode for TFT-LCDs,” SID Dig., vol. 31, pp. 256–256, 2000.
[4] K. Miyachi, K. Kobayashi, Y. Yamada, and S. Mizushima, “The world’s first photo-aligned LCD technology applied to G10 factory,”
SID Dig., vol. 40, pp. 579–579, 2010.
[5] J.-S. Patel and G.-B. Cohen, “Inverse twisted nematic liquid-crystal device,” J. Appl. Phys. Lett., vol. 68, pp. 3564–3564, 1996.
[6] T. Takahashi, S. Saito, and T. Akahane, “Electrooptical properties of vertically aligned twisted nematic cells with negative dielectric anisotropy,” Jpn. J. Appl. Phys., vol. 36, pp. 3531–3531, 1997. [7] S.-I. Jo, S.-W. Choi, Y.-J. Lee, Y.-K. Moon, Y.-C. Yang, C.-J. Yu, and
J.-H. Kim, “Inverse four-domain twisted nematic liquid crystal display fabricated by the enhancement of azimuthal anchoring energy,” J. Appl.
Phys., vol. 109, 2011, Art. No. 084501.
[8] H. Mada and S. Saito, “Pretilt angle dependence of azimuthal an-choring energy in nematic liquid crystals,” Jpn. J. Appl. Phys., vol. 38, pp. 1118–1118, 1999.
[9] T. J. Scheffer and J. Nehring, “Accurate determination of liquid crystal tilt bias angles,” J. Appl. Phys., vol. 48, pp. 1783–1783, 1977. [10] Y.-L. Lo, Y.-F. Chung, C.-C. Liao, and W.-H. Hsieh, “Transmitted
el-lipsometry method for extracting fphysical parameters of TN/VA/In-verse-TN liquid crystal cells,” IEEE J. Quantum Electron., vol. 49, no. 3, pp. 259–259, Mar. 2013.
[11] S.-Y. Wang and K.-H. Yang, “Simple method to obtain accurate pretilt angles for thin twisted nematic liquid-crystal cells,” Appl. Opt., vol. 52, no. 2, pp. 219–219, 2013.
[12] S.-Y. Wang and K.-H. Yang, “Direct measurements of asymmetric pretilt angles of optically compensated bend (OCB) nematic liquid crystal cells,” SID Dig., vol. 44, no. (1), pp. 1325–1325, 2013. [13] A. Lien, “A detailed derivation of extended Jones matrix representation
for twisted nematic liquid crystal displays,” Liq. Cryst., vol. 22, no. 2, pp. 171–171, 1997.
[14] A. Lien, “Extended Jones matrix representation for the twisted nematic liquid-crystal display at oblique incidence,” Appl. Phys. Lett., vol. 57, pp. 2767–2767, 1990.
[15] P. Yeh, “Extended Jones matrix method,” J. Opt. Soc. Amer., vol. 72, pp. 507–507, 1982.
[16] Y. Sato, K. Sato, and T. Uchida, “Relationship between rubbing strength and surface anchoring of nematic liquid crystal,” Jpn. J. Appl.
Phys., vol. 31, pp. L579–L579, 1992.
Sheng-Ya Wang received the B. S. degree from the Department of Physics, National Sun Yat-Sen University, Kaohsiung, Taiwan, in 2010, and is currently working toward the Ph.D. degree from the Institute of Photonic Systems, Na-tional Chiao Tung University, Tainan, Taiwan.
His research interests are in liquid crystal displays, liquid crystal devices, and liquid crystal simulation.
Chia-Yi Lin received the B. S. degree from the Department of Electrical Engi-neering, National University of Kaohsiung , Kaohsiung, Taiwan, in 2012, and is currently working toward the M. S. degree from the Institute of Photonic Sys-tems, National Chiao Tung University, Tainan, Taiwan.
His research interests are in optical simulation of liquid crystal displays.
Kei-Hsiung Yang received the Ph.D. degree in physics from the University of California, Berkeley, CA, USA.
He has worked at GE R&D Center and at IBM T. J. Watson Research Center, Yorktown heights, NY, USA. He currently serves as a Chair Professor at Na-tional Chiao Tung University, Tainan, Taiwan. His research fields include non-linear optics, low-temperature far-infrared detection, medical x-ray imaging, VUV-emitting phosphors, electrophoretic displays, liquid crystal displays, sil-icon-wafer-based liquid crystal light valves, and in-cell touch-input technolo-gies. He has published 55 journal and 51 conference papers, and obtained 71 U.S. patents. He published the first paper in the world (Proceedings of IDRC, San Diego, CA, USA (Oct. 1991) to suggest multi-domain LC modes for im-proving viewing angles of TFT-LCDs.