Subscriber access provided by NATIONAL TAIWAN UNIV
Langmuir is published by the American Chemical Society. 1155 Sixteenth Street N.W., Washington, DC 20036
Research Article
Investigation of the Mechanism of #-Amyloid Fibril
Formation by Kinetic and Thermodynamic Analyses
Ming-Shen Lin, Liang-Yu Chen, Hui-Ting Tsai, Steven S.-S.
Wang, Yung Chang, Akon Higuchi, and Wen-Yih Chen
Langmuir, 2008, 24 (11), 5802-5808 • DOI: 10.1021/la703369b • Publication Date (Web): 02 May 2008 Downloaded from http://pubs.acs.org on November 26, 2008
More About This Article
Additional resources and features associated with this article are available within the HTML version: • Supporting Information
• Access to high resolution figures
• Links to articles and content related to this article
Investigation of the Mechanism of
β-Amyloid Fibril Formation by
Kinetic and Thermodynamic Analyses
Ming-Shen Lin,
†Liang-Yu Chen,
‡Hui-Ting Tsai,
†Steven S.-S. Wang,
§Yung Chang,
|Akon Higuchi,
†and Wen-Yih Chen*
,†Department of Chemical and Materials Engineering, National Central UniVersity, Jhong-Li, Taiwan 320, Biotechnology Department, Ming-Chuan UniVersity, Gui-Shan, Taiwan 333, Department of Chemical
Engineering, National Taiwan UniVersity, Taipei, Taiwan 10617, and R&D Center for Membrane Technology and Department of Chemical Engineering, Chung Yuan Christian UniVersity,
Jhong-Li, Taiwan 320
ReceiVed October 30, 2007. ReVised Manuscript ReceiVed February 19, 2008
Extracellularβ-amyloid (Aβ) deposit is considered as one of the primary factors that induce Alzheimer’s disease
(AD). The effects of various environmental factors, including temperature, ionic strength, and pH, on Aβ (1–40)
aggregation mechanisms were investigated in this study by spectrometry, isothermal titration calorimetry (ITC), and hydrophobic fluorescence assay. In the aggregation process, the secondary structure of Aβ (1–40) transforms to the β-sheet conformation, which could be described as a two-state model. As the temperature and ionic strength increase,
the conformation of Aβ converts to the β-sheet structure with an increased rate. Results of circular dichroism monitoring
demonstrate that the rate constant of nucleation is smaller than that of elongation, and the nucleation is the rate-determining step during the overall Aβ aggregation. The β-sheet structure was stabilized by hydrophobic forces, as
revealed by the ITC measurements. The different structural aggregates and forming pathways could be identified and discriminated at high and low ionic strengths, resulting in distinctive fibril conformations. Furthermore, the thermodynamic analysis shows that hydrophobic interaction is the major driving force in the nucleation step. Our study provides an insight into the discriminative mechanisms ofβ-amyloid aggregation via kinetics and thermodynamics, especially the
first reported thermodynamics information obtained by ITC.
Introduction
Alzheimer’s disease (AD) is a common dementia affecting elderly people. It is marked by loss of memory, disorientation, behavior instability, and difficulty in thinking reasonably. The pathology of AD is characterized by extracellular senile plaques (SP) and intracellular neurofibrillary tangles (NFT) accompanied by synapse loss and neuron cell death.1–4The major constituent
of SP has been identified as a 39–43 amino acid polypeptide, Aβ,
which is derived from proteolytic processing of amyloid precursor protein (APP).5A growing body of evidence suggests that the onset of AD is caused by the deposition of Aβ and its
transformation to SP in a localized region of the brain.6–9 The Aβ molecule is an amphiphilic peptide that possesses a
hydrophilic region (N-terminal) and a hydrophobic region (C-terminal), and it can self-assemble to form aggregates with various morphologies, such as dimers, oligomers, filaments, protofibrils, and fibrils.10–19It was reported that Aβ monomer has no toxic
effect on neuron cells, while the process of fibril formation may cause cytotoxicity.13–21Recently, a number of studies also report
that the morphology of toxic Aβ species included protofibrils
and oligomers.2,9,11The transformation of theβ-sheet secondary
structure during Aβ aggregation was observed from the circular
dichroism (CD) measurements.21–23 Generally, there are two stages in the Aβ aggregation process: the lag phase for nucleation
and the growth phase for elongation or bundling. Aggregate was entirely absent during the lag phase of the Aβ fibril formation
process.24,25When a small quantity of aggregate was present as
seeds in the Aβ formation, the attachment of Aβs on the seeds
* Corresponding author. Tel: (886) 3-4227151, ext 34222. Fax: (886) 3-422-5258. E-mail: wychen@cc.ncu.edu.tw.
†National Central University. ‡Ming-Chuan University. §National Taiwan University. |
Chung Yuan Christian University.
(1) Xing, Y.; Higuchi, K. Mech. Ageing DeV. 2002, 123, 1625–1636.
(2) Sommer, B. Neurosciences 2002, 1, 87–92.
(3) Lee, V. M.; Balin, B. J.; Otvos, L. J.; Trojanowski, J. Q. Science 1991, 251, 675–678.
(4) Selkoe, D. J. Neuron 1991, 6, 487–498.
(5) Kitaguchi, N.; Takahashi, Y.; Tokushima, Y.; Shiojiri, S.; Ito, H. Nature 1988, 331, 530–532.
(6) Green, J. D.; Kreplak, L.; Goldsbury, C.; Blatter, X. L.; Stolz, M.; Cooper, G. S.; Seelig, A.; Kistler, J.; Aebi, U. J. Mol. Biol. 2004, 342, 877–887.
(7) Selkoe, D. J. J. Neuropathol. Exp. Neurol. 1994, 53, 438–447.
(8) Hardy, J. A.; Higgins, G. A. Science 1992, 256, 184–185.
(9) Hardy, J.; Selkoe, D. J. Science 2002, 297, 353–356.
(10) Watanabe, K.; Segawa, T.; Nakamura, K.; Kodaka, M.; Konakahara, T.; Okuno, H. J. Pept. Res. 2001, 58, 342–346.
(11) Serpell, L. C. Biochim. Biophys. Acta 2000, 1502, 16–30.
(12) Lambert, M. P.; Barlow, A. K.; Chromy, B. A.; Edwards, C.; Freed, R.; Liosatos, M.; Morgan, T. E.; Rozovsky, I.; Trommer, B.; Viola, K. L.; Wals, P.; Zhang, C.; Finch, C. E.; Krafft, G. A.; Klein, W. L. Proc. Natl. Acad. Sci. U.S.A. 1998, 95, 6448–6453.
(13) Koh, J. Y.; Yang, L. L.; Cotman, C. W. Brain Res. 1990, 553, 315–320. (14) Pike, C. J.; Walencewicz, A. J.; Glabe, C. G.; Cotman, C. W. Eur. J. Pharmacol. 1991, 207, 367–368.
(15) Pike, C. J.; Burdick, D.; Walencewicz, A. J.; Glabe, C. G.; Cotman, C. W. J. Neurosci. 1993, 13, 1676–1687.
(16) Busciglio, J.; Yeh, J.; Yankner, B. A. J. Neurochem. 1993, 61, 1565– 1568.
(17) Howlett, D. R.; Jennings, K. H.; Lee, D. C.; Clark, M. S.; Brown, F.; Wetzel, R.; Wood, S. J.; Camilleri, P.; Robert, G. W. Neurodegeneration 1995, 4, 23–32.
(18) Seilheimer, B.; Bohrmann, B.; Bondolfi, L.; Muller, F.; Stuber, D.; Dobeli, H. J. Struct. Biol. 1997, 119, 59–71.
(19) Hartley, D. M.; Walsh, D. M.; Ye, C. P.; Diehl, T.; Vasquez, S.; Vassilev, P. M.; Teplow, D. B.; Selkoe, D. J. J. Neuroscience 1999, 19, 8876–8884.
(20) Steven, S. S.; Wang; Theresa, A. G. J. Chin. Inst. Chem. Eng. 2005, 36, 533–559.
(21) Terzi, E.; Holzemann, G.; Seelig, J. Biochemistry 1994, 33, 1345–1350.
(22) Terzi, E.; Holzemann, G.; Seelig, J. J. Mol. Biol. 1995, 252, 633–642.
(23) Gursky, O.; Aleshkov, S. Biochim. Biophys. Acta 2000, 1476, 93–102.
(24) Nilsson, M. R. Methods 2004, 34, 151–160.
(25) Lin, M.-S.; Chiu, H.-M.; Fan, F.-J.; Tsai, H.-T.; Wang, S. S. S.; Chan, Y.; Chen, W. Y. Colloids Surf. B 2007, 58, 231–236.
10.1021/la703369b CCC: $40.75 2008 American Chemical Society Published on Web 05/02/2008
and the fibril formation occurred rapidly.26,27 However, the
conformation of Aβ may be affected by environmental factors,
such as temperature, pH, ionic strength, and so on. The CD observation by Gursky et al. demonstrated that moreβ-sheet
structures formed readily at a higher incubation temperature.23
Wood et al. studied the effect of pH on the conformations of Aβ
fibrils by examination with an electron microscope.28Stine et al.
also found compact and coaggregated fibrils with 150 mM NaCl but elongated fibrils without NaCl by the AFM images.29Two
different conformations of Aβ fibrils at low and high salt
concentrations were also observed and identified by Nichols et al.30
So far, the formation mechanism of Aβ fibrils is still not fully
understood. Therefore, the goal of our study was to characterize the behavior of Aβ aggregation with kinetics and thermodynamics
analyses. The physiochemical properties and morphologies of Aβ aggregation were validated by hydrophobic fluorescence assay
and AFM observation, and they were used to elucidate the mechanism of Aβ fibril formation. The interaction enthalpy
between monomeric Aβs and between the monomeric Aβ and
the nuclei of Aβ aggregates has never been reported. In this
study, the heat of dilution at fresh and aggregated stages of Aβ
was measured by ITC, and it was used to evaluate the energetics of intermolecular.
Materials and Methods
Materials. Aβ (1–40) with an amino acid sequence of
DAE-FRHDSGYEVHHQKLVFFAEDVGSNKGAIIGLMVGGVV was purchased from Biosource International (Camarillo, CA). The purity of the peptide is 95%, as validated by HPLC analysis. thioflavin T (ThT), hexafluoro-2-propanol (HFIP), NaF, and all other chemicals were purchased from Aldrich or Sigma.
Peptide Preparation. Aβ peptides were prepared as described
previously.25They were denatured and dissolved in HFIP solution
to avoid a different degree of aggregation among batches.31The Aβ
solution was freeze-dried using a vacuum oven, and then the lyophilized powder was dissolved in phosphate buffer solution as a fresh Aβ for the following experiments. The fresh Aβ was tested
by electrophoresis before each experiment, while the aggregated Aβ
was incubated with stirring in 50 rpm for 24 h.
Circular Dichroism Spectroscopy. CD spectroscopic
measure-ment was carried out in a JASCO model J-810 spectrometer with a temperature control unit. A quartz cell with a path length of 1 mm was used for far-UV (190–250 nm) measurements. Four scans each of duplicate samples were measured and averaged.
ThT Fluorescence Assay. The assay was performed according
to the method described by LeVine.32The fluorescence of ThT was
measured using a JASCO FP-6500 spectrometer. ThT was dissolved in phosphate buffer to form the 10µM ThT solution. The ThT and
the Aβ solutions were well-mixed at the ratio of 24:1 (v/v).
Fluorescence changes of Aβ fibrils were measured at the excitation
and emission wavelength of 440 and 485 nm, respectively. Each ThT fluorescence study was repeated two times.
Atomic Force Microscopy. The surface of the mica was cleaned
by sequential washing with acetone, isopropanol, and deionized water, respectively, each for 30 min in the ultrasonic device, followed
by drying using nitrogen. The fresh mica was soaked in 35µM Aβ
solution for 30 min. Aβ-coated surfaces were dried at room
temperature before the images were taken. AFM images were obtained using a Seiko Instruments Inc. SPA 400 in tapping mode. Measurements were performed at a resonance frequency of 70–150 kHz.
Isothermal Titration Microcalorimetry. The reaction enthalpy
measurements were performed using an isothermal titration mi-crocalorimeter (VP-ITC, MicroCal Inc.). The samples were degassed thoroughly before the experiments that were performed with the buffer in the sample cell and 35µM Aβ solution in the titration
syringe at various conditions. The sample in the cell was stirred at 300 rpm by the syringe, and 10µL of the buffer was delivered over
20 s with 600 s intervals between injections to allow complete equilibrium. The data were recorded automatically and subsequently analyzed by Origin software from MicroCal. In the control experiments, the buffer in the injector was titrated into the buffer in the sample cell to obtain the heat of dilution. The value of the heat of dilution was obtained and subtracted from the experimental curve in the final analysis.
Results and Discussion
Temperature Effects. The conformational change and fibril
formation of fresh Aβ with 10 mM phosphate buffer (PB)
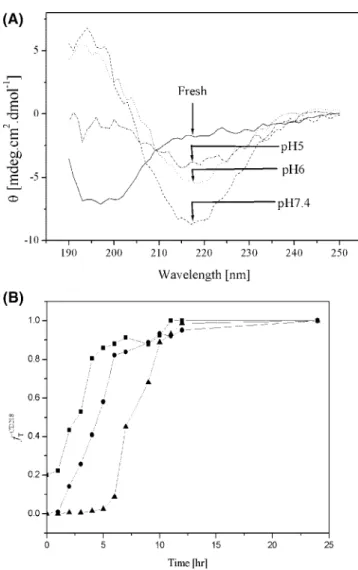
including 100 mM NaF at a pH of 7.4 were observed at various temperatures, viz., 30, 37, and 45°C. CD minimum measurement at 197 nm as shown in Figure 1 is a characteristic signature of random coils. It indicates that the fresh Aβ structure is primarily
a random coil at 45°C. Following an increase in incubation time, the minimum peak was changed from 197 to 218 nm. This change in the CD spectra was observed as a gradual structural transformation of Aβ into β-sheet. The isosbestic point22as
observed in Figure 1A shows that all CD spectra measured at different time intersects at 210 nm. The same trend is also observed at 30 and 37°C. For the kinetic calculation, the signal of the characteristic wavelength of theβ-sheet at 218 nm is converted
to the fraction of transition (fT) and is defined as follows:
fT
CD218) θobs- θfresh θaggr- θfresh
(1)
whereθobsis the ellipticity of CD measurement at 218 nm at
different times, and the suffixes of obs, fresh, and aggr were observed, unincubated, and aggregated Aβ, respectively. The
boundary conditions are the following: fT) 0 as 0 e t < ti,T(the
time before the conformational change of Aβ) and fT) 1 as tf,T
< t f∞(the thermodynamic equilibrium state). In Figure 1C, it is clearly evident that the S-shaped curve is observed at different temperatures, and the lag time of transition of random coil of Aβ
toβ-sheet is reduced as the incubation temperature was increased.
The change in the secondary structure from random coil toβ-sheet
can be explained by the two-step model
Aβfreshf· · · f Aβaggr (2)
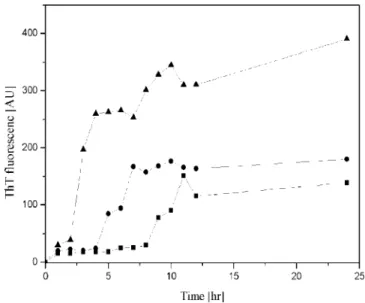
The time-course curves of ThT fluorescence at different incubation temperatures are also shown in Figure 2. The fluorescence signals gradually increased with incubation time, indicating the onset of fibril formation in the Aβ solution. After
incubation at 45°C for 2 h, the intensity of ThT increased rapidly; ThT signals were also observed to intensify after 4 and 8 h of incubation at 37 and 30°C, respectively. The ThT fluorescence intensity observed was overshot with the increasing incubated time until the equilibrium was reached. The above results indicated that the rate and amount of fibril formation are proportional to the incubation temperature and that they were also involved during the fibril formation process; that is, a higher incubation temperature may have facilitated fibril formation, which is
(26) Jarrett, J. T.; Berger, E. P.; Lansbury, P. T. Biochemistry 1993, 32, 4693– 4697.
(27) Walsh, D. M.; Lomakin, A.; Benedek, G. B.; Condron, M. M.; Teplow, D. B. J. Biol. Chem. 1997, 272, 22364–22372.
(28) Wood, S. J.; Maleeff, B.; Hart, T.; Wetzel, R. J. Mol. Biol. 1996, 256, 870–877.
(29) Stine, W.; B., Jr.; Dahlgren, K. N.; Krafft, G. A.; LaDu, M. J. J. Biol. Chem. 2003, 278, 11612–11622.
(30) Nichols, M. R.; Moss, M. A.; Reed, D. K.; Lin, W. L.; Mukhopadhyay, R.; Hoh, J. H.; Rosenberry, T. L. Biochemistry 2002, 41, 6115–6127.
(31) Kamihira, M.; Natio, A.; Tuzi, S.; Nosaka, A. Y.; Saito, H. Protein Sci. 2000, 9, 867–877.
(32) LeVine, H. Protein Sci. 1993, 2, 404–410.
(33) Wu, C.; Lei, H.; Yong, D. J. Am. Chem. Soc. 2005, 127, 13530–13537.
consistent with other studies.33–36Surface morphology obtained by AFM indicated that Aβ aggregates were observed when the
fresh 35µM Aβ (1–40) was incubated at 30°C for 24 h, as given in Figure 3A. Upon incubating at 37°C for 24 h, thin fibrils were observed (Figure 3B). Incubating at 45°C for 2 h also resulted in visible fibrils (data not shown).
Moreover, the effect of temperature on the aggregation mechanism of Aβ (1–40) could be analyzed using the multistep
reaction model nM T Mnf kn Pn (3) Pn+ M 98 ke Pn+1 (4)
where M and Pnare the monomeric Aβ molecule and the seed of aggregates, respectively, and knand keare the reaction rate
constants for nucleation and elongation, respectively. The reaction constant obtained by differential equation was calculated using the integrated equation31
fT(t) )
D(exp((1 + D)kt) - 1)
1 + D exp((1 + D)kt) (5)
where fT(t) is the conversion fraction ofβ-sheet at t (time), D
) kn/k, k ) ke[M], and [M] is the initial concentration of Aβ
(1–40). The results of the rate constants using CD data were obtained from the formula in eq 5 by fitting the model in eqs 3 and 4, which are shown in Table 1. The rate constant of nucleation,
kn, is proportional to the incubation temperature, which would
mean that raising the incubation temperature would result in both shortening the lag phase and accelerating the nucleation step. Interestingly, the kevalue is on the same order obtained at
various incubation temperatures. As compared to ke, knis much
smaller at all incubation temperatures. Therefore, nucleation is a rate-determining step and is affected by temperature greatly during the process of Aβ (1-40) fibril formation.
The results from CD imply that fibril formation is dramatically accelerated by elevating the temperature, indicating that the hydrophobic interactions are strongly involved in stabilizing the formation of Aβ fibrils. Given the results of fluorescence
measurements with respect to the temperature and the structural information from AFM, we could conclude that hydrophobic interaction between monomeric Aβs is the main driving force
in the nucleation step. This is the rate determination step, and
(34) Petkova, A. T.; Ishii, Y.; Balbach, J. J.; Antzutkin, O. N.; Leapman, R. D.; Delaglio, F.; Tycko, R. Proc. Natl. Acad. Sci. U.S.A. 2002, 99, 16742–16747.
(35) Luhrs, T.; Ritter, C.; Adrian, M.; Riek-Loher, D.; Bohrmann, B.; Dobeli, H.; Schubert, D.; Riek, R. Proc. Natl. Acad. Sci. U.S.A. 2005, 102, 17342–17347.
(36) Choo-Smith, L. P.; Surewicz, W. K. FEBS Lett. 1997, 402, 95–98.
Figure 1.(A) Time course of CD spectra of 35µM Aβ (1–40) incubated
in phosphate buffer with 100 mM NaF, pH 7.4 at 45°C. (B) CD spectra of the Aβ (1–40) aggregates in phosphate buffer with 100 mM NaF, pH
7.4 for 24 h at the incubation temperature of 30, 37, and 45 °C, respectively. (C) Time-courses of the aggregation transition fraction for CD 218 nm at the incubation temperature of 30°C (9), 37°C ((), and 45°C (2), respectively.
Figure 2. Time course of fibril formation monitored by the ThT fluorescence, from 35µM of Aβ (1–40) solution incubated at 30°C (9), 37°C ((), and 45°C (2), respectively. The 35µM fresh Aβ (1–40)
the structure of the nucleus may induce different aggregation developments such as aggregate or fibril.
pH Effects. The time course of the CD spectrum at different
pH values is shown in Figure 4. Aβ (1–40) was dissolved in 10
mM phosphate buffer at pH 5.0. Theβ-sheet was initially observed
until it reached equilibrium after 4 h of incubation, as shown in Figure 4B. Secondary structural changes at the pH value of 6.0 and 10 mM PB are presented in Figure 4B. Theβ-sheet structures
with a negative CD peak at 218 nm were observed in the beginning, and the intensity increased dramatically until it reached equilibrium after 4 h. In comparison, Aβ (1–40) in 10 mM PB
at pH 7.4 initially existed as a random coil and developed into aβ-sheet as a function of time (Figure 4B). A similar trend of
conformational change was also observed at pH 5.0 and 6.0. The results of CD were transformed into the fractional variation of ellipticity at 218 nm. Besides, the value ofθ at pH 7.4 was
substituted intoθfreshin eq 1 of our calculation (Figure 4B). The
lag phase was shortened at pH 5.0 and 6.0 in both experiments. In addition, the signals at pH 5.0 increased at a faster rate than that at pH 6.0. Since the isoelectric point of Aβ (1–40) is between
pH 5.0 and 5.5, the net charge of Aβ (1–40) is close to zero at
pH 5.0; the observation of Aβ (1–40) aggregates at a faster rate
without electrostatic repulsive interaction is consistent with the results obtained from the CD kinetic analysis. As the pH was adjusted to 6.0, and similarly, to 7.4, the net charge of Aβ (1–40)
became negative; the rate at which the structural change occurred
in the transformation of random coil to aβ-sheet is decreased.
Thus, the transition of the secondary structure may be retarded by the presence of electrostatic repulsive force. These results are consistent with ThT fluorescence, as shown in Figure 5. The rate of Aβ (1–40) nuclei formation in the beginning was slow at pH
7.4, but as it progressed, the intensity of ThT fluorescence increased and reached a maximum, which is higher than that at pH 5 and 6. This demonstrates that at pH 7 the fibrils were formed at the end of the experiments. Conversely, higher initial intensities of ThT signals at pH 5.0 and 6.0 were observed, these signals quickly reached equilibrium, and these signal intensities were lower than that at pH 7.4. These results suggest the formation of aggregates as a bundling aggregate under acidic conditions.28
The combined results from CD and ThT analysis showed that most Aβs could form β-sheet at various pH conditions. However,
significant fibril formation was observed only at pH 7.0. The net charge of Aβ (1–40) at pH 7.4 is negative. Therefore, the
electrostatic force and hydrophobic force are important in the formation of nuclei and the subsequent aggregation process of forming fibrils.
Ionic Strength Effects. We further elucidate the effects of
salt on the secondary structure of Aβ and the interaction forces
between monomeric Aβ and fibril and also between fibrils,
particularly, the hydrophobic interactions from the results of
Figure 3.The morphology of 35µM Aβ (1–40) with 10 mM phosphate
buffer, pH 7.4, and 100 mM NaF as analyzed by AFM. (A) Incubated at 30°C for 24 h. (B) Incubated at 37°C for 24 h. Images size 1× 1
µm2.
Table 1.Kinetics for Parameters Aβ (1–40) Aggregation at Different Incubation Temperaturesa
temp (°C) kn× 10-6(h-1) ke× 104(M-1h-1) 30 4.59 ( 0.399 4.11 ( 0.119
37 1560 ( 102 3.57 ( 0.123
45 24800 ( 810 3.2 ( 0.102
aThe R2fitting curves are >0.99.
Figure 4.The effect of pH value on the kinetics of 35µM Aβ (1–40)
amyloid fibril formation at 37°C. (A) CD spectra of the aggregation of 35µM Aβ (1–40) in phosphate buffer at pH 5.0, 6.0, and 7.4 for 24 h,
respectively. (B) Time courses of the aggregation transition fraction for CD 218 nm at pH values of 5.0 (9), 6.0 (b), and 7.4 (2), respectively. InVestigation ofβ-Amyloid Fibril Formation Langmuir, Vol. 24, No. 11, 2008 5805
CD, fluorescence, and AFM analyses. In this study, various concentrations of sodium fluoride (NaF) were added to the Aβ
solution to study the effect of ionic strength on the change of secondary structure of Aβ by CD analyses. The choice of NaF
instead of NaCl was based on the CD interference at 190–220 nm with the presence of chloride ion.37
Charge shielding by the addition of salt accelerated and promoted the transformation of Aβ to β-sheet as electrostatic
force was weakened and as hydrophobic interaction became the dominant driving force. At a higher salt concentration, the time at which the fraction increases for the CD peak at 218 nm starts earlier, as observed in Figure 6. These findings demonstrate that the high ionic strength may promote the transformation of Aβ
toβ-sheet.
In more detail, Aβ is water-soluble, as water molecules
clustered around the hydrophobic region form a clathrate-like structure. When salt was added, it was expected that the charge shielding would surround the Aβ molecule. The salt acquired
the clustered water molecule, so the surface tension between the peptide and the surrounding water molecules increased and this resulted in increased hydrophobic segments being exposed on the surface, which in turn facilitated the hydrophobic interaction. The secondary structure of Aβ (1–40), β-sheet, is stabilized
by hydrophobic interaction, and this finding is consistent with the results obtained from the observations on the effect of temperature.
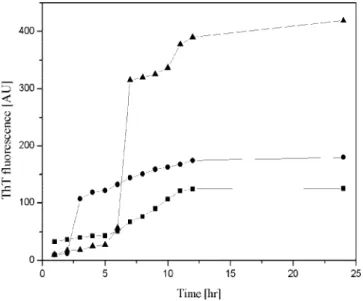
The fluorescence signals (Figure 7) gradually increased with the increase in incubation time, showing the onset of nuclei formation in the Aβ solution. The time required to detect the
increased ThT signal intensity was shorter for a higher ionic strength. However, fluorescence intensity after reaching the maximum was higher for the solution without NaF addition. It is noteworthy to mention that without NaF addition, the intensity of ThT increased rapidly at 7 h. The shorter incubation time to form nuclei between monomeric Aβs at a higher salt concentration
solution may be caused by the simultaneous shielding of electrostatic force and the enhancement of hydrophobic effect. Furthermore, the binding behavior between monomeric Aβ and
fibril was examined at different NaF concentrations by ThT signals. The ThT intensity at equilibrium is in the following order: 0 mM > 100 mM > 200 mM.
Previous studies have demonstrated that salt concentration has a great impact on the mechanisms of Aβ aggregation.29,38
For instance, Nichols et al. revealed that monomer Aβ binds to
the two extremities of protofibrils at a low ionic strength condition; meanwhile, the binding at a high salt concentration took place not only between Aβs with both ends of fibril but also between
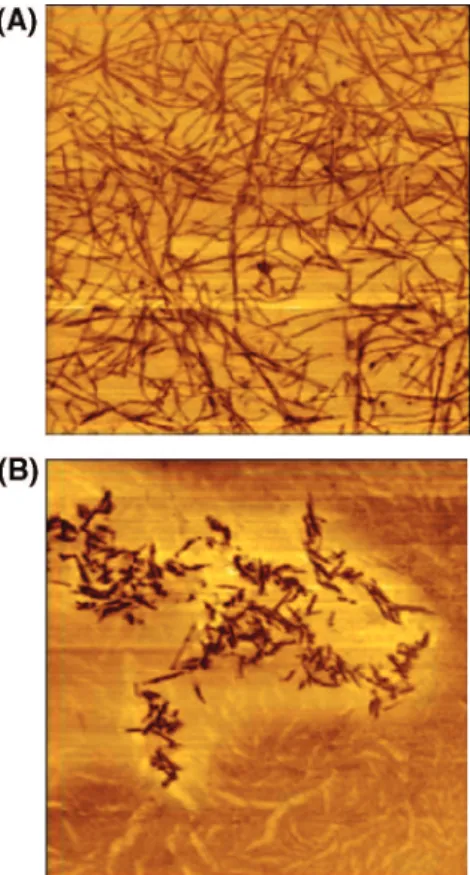
two axial sides of fibrils.30The results were supported by AFM images, as the long (in excess of 1µm) and thin fibrils were
observed after 24 h of incubation without adding any NaF (Figure 8A). The morphology of short and thick fibrils was observed after the addition of 200 mM NaF over a time period of 24 h
(37) Burdick, D.; Soreghan, B.; Kwon, M.; Kosmoski, J.; Knauer, M.; Henschen,
A.; Yates, J.; Cotman, C.; Glabe, C. J. Biol. Chem. 1992, 267, 546–554. 3883(38) Lin, F.-Y.; Chen, W.-Y.; Hearn, M. T. W. Anal. Chem. 2001, 73, 3875–.
Figure 5.Time course of fibril formation monitored by ThT fluorescence from 35µM Aβ (1–40) solution incubated at pH 5.0 (9), pH 6.0 (b),
and pH 7.4 (2), respectively. The 35µM fresh Aβ (1–40) solution was
incubated at 37°C.
Figure 6.Fraction of ellipticity change at 218 nm in the presence of salt concentration at 0 mM (9), 100 mM (b), and 200 mM (2), respectively. The solution contained 35µM of fresh Aβ (1–40) in pH
7.4, 10 mM phosphate buffer and salt with various concentrations.
Figure 7.Time course of the ThT fluorescence during fibril formation in the presence of salt concentration at 0 mM (9), 100 mM (b), and 200 mM (2). The solution contained 35µM fresh Aβ (1–40) at pH 7.4,
by AFM (Figure 8B). These results indicate the other pathway of fibril formation to form a bundle aggregation, as represented by the following equation:
Pn+ Pmf(P
nPm) f Pnm (6)
where Pnand Pmare the seed of aggregates and PnPmand Pnm are bundle aggregation and fibril, respectively. The subscripts
n and m are arbitrary numbers and are >2 integrated. Thus, we
propose that, at a low ionic strength, the electrostatic repulsion between Aβ monomers and between the axial sides of fibrils
characterizes the polymerization at both ends of a fibril, leading to long and thin fibrils. As a result, the ThT signals increase accordingly. Meanwhile, at a high ionic strength, the hydrophobic interaction behavior between fibrils may cover the binding site of ThT so that this did not bring about intensified ThT signals.
Energetics on the Intermolecule Interaction of Aβ (1-40).
Heats of dilution of fresh Aβ (1–40) at 30, 37, and 45°C were determined by the integration of the observed ITC peaks. These are shown in Figure 9. The CD and ThT fluorescence measure-ments for the fresh Aβ (1–40) as monomer are shown in Figures
1 and 2. Overall, the heats of dilution of monomeric Aβ (1–40)
in Figure 9 were endothermic at all temperatures, and these indicate that attraction forces exist between monomers at each condition from the energetic perspective.
The heat of dilution of fresh Aβ (1–40) increased with
increasing temperature due to the structure of clathrate becoming more unstable as thetemperature increased.38As monomeric Aβ
was diluted by a buffer, the intermolecule interaction is disrupted and energy is gained from the system, indicating that the dissociation of monomers is an enthalpy unfavorable process. For nucleation, the monomer-rich system needs more energy to separate the Aβ monomers. Surprisingly, the heats of dilution
of aggregated Aβ (1–40) at 30, 37, and 45°C were found to be near zero.
The heats of dilution of fresh Aβ (1–40) at different salt
concentrations are shown in Figure 10. In the case of phosphate buffer without adding salt, the heat of dilution between monomeric Aβ molecules is exothermic. For the case of 100 mM NaF, the Figure 8.The morphology of 35µM Aβ (1–40) with 10 mM phosphate
buffer incubated at pH 7.4 and 37°C for 24 h as analyzed by AFM: (A) without NaF and (B) with 200 mM NaF. Image size 5× 5 µm2.
Figure 9.The effect of the incubation temperature on the heat of dilution of fresh and aggregated Aβ (1–40) solution containing 10 mM phosphate
buffer with 100 mM NaF at pH 7.4. Fresh Aβ incubated at 30°C (9), 37°C (b), and 45°C (2) and aggregated Aβ incubated at 30°C (0), 37°C (O), and 45°C (∆) are all shown in the figure.
Figure 10.The effect of salt concentration on the heat of dilution of 35µM fresh Aβ (1–40) at 37°C and pH 7.4. (A) The ITC sensorgram for fresh Aβ solution contained 10 mM PB with 200 mM NaF. (B) The
heat of dilution of fresh Aβ solution containing 10 mM PB with various
NaF concentrations, 0 mM (9), 100 mM (b), and 200 mM (2), obtained from integrated ITC sensorgram.
heat of dilution is endothermic. The ionic repulsive force is reduced and this enhances the aqueous surface tension, which promotes the exposure of hydrophobic segments of Aβ nucleus.
Nevertheless, as the salt concentration increased to 200 mM NaF, the Aβs were aggregated to form fibrils before the ITC
measurements could be performed, so the obtained binding enthalpies are the heat of dilution of fibrils and the value is closed to zero. Regardless of salt concentration, all the measured heats of dilution of aggregated Aβ (1–40) are zero or only slightly
exothermic, with small heat variation.
Mechanism Analysis with Molecular Interaction Forces.
The results from CD illustrated that Aβ (1–40) makes the transition
to the β-sheet structure rapidly at a higher temperature. ITC
measurements also revealed that the heat of dilution of fresh Aβ
is endothermic, and the heat required increased with increasing temperature. Combining the results of CD and ITC, the hydrophobic interaction is shown to stabilize theβ-sheet structure
and to facilitate nuclear formation. Furthermore, the effect of incubation temperatures on the ThT fluorescence also showed that the intensity increased with increasing temperature during the formation of Aβ (1–40) fibrils. Gursky et al. showed that
moreβ-sheet structures formed readily, and the fibrils were formed
at a faster rate at a higher incubation temperature.23Therefore,
the hydrophobic effect is considered to be the main driving force during fibril formation. After forming, Aβ fibrils may expose
their hydrophilic surface with a net negative charge at pH 7.4, resulting in electrostatic repulsion between individual Aβ fibrils.
Wood et al. revealed that short and thick fibrils were characteristic at pH 5.8 and long and thick fibrils at pH 7.4, as established by electron microscopy.28Therefore, two different
conformations of aggregation or fibril existed at pH 5.8 and 7.4. High ThT fluorescence signals were obtained at the very beginning for both observations at the pH values of 5.0 and 6.0, and these became less prominent with the increase in time. Though hydrophobic interaction plays a critical role in Aβ aggregation,
a random structure is critical in the overall reaction mechanism, as confirmed by the small value of kefrom the kinetics analysis.
At pH 7.4, both hydrophobic and electrostatic interactions are necessary to stabilize the particular fibril structure during aggregation of Aβ (1–40).28If a hydrophobic effect is the only
force present, Aβ can develop into a β-sheet quickly, but with
possible formations of fibrils and random structure. Moreover, the rate ofβ-sheet formation accelerates as there is continued
deviation of pH values from the pI value of Aβ (1–40). The
delayed development of a β-sheet can be attributed to the
electrostatic repulsion.
Distinct mechanisms were observed at different salt concen-trations, which cause the formation of fibrils or bundling. At higher salt concentration, theβ-sheet was formed at an earlier
stage, as shown by the results of CD analysis. This result further establishes the fact that the mere presence of hydrophobic force is capable of stabilizing the structure of theβ-sheet. Nichols et
al. have pointed out that a slight change in the ThT signal at a high salt concentration and the particle size of Aβ became large
as the detection time was increased.30However, exactly opposite
results were obtained at a low salt concentration. In the present study, by the addition of a small amount of salt (100 mM NaF), long and thin fibrils are formed, as evidenced from CD, ThT, and AFM analyses. The ITC analysis exhibits endothermic peaks, indicating that the charged hydrophilic region is exposed by the addition of a small amount of salt. From these results the
mechanism involved during the formation of long and thin fibrils has been explained as, at low salt concentration, the electrostatic repulsion between Aβ monomers as the result of the charged
hydrophilic region, as evidence by ITC analysis. Each fibril allows possible polymerization only at both ends of the fibrils and not side-to-side polymerization, due to the repulsive force between the two axial sides of Aβs. This leads to the formation of long
and thin fibrils. This caused the constant vertical ascent of the ThT signal. In this way the addition of salt accelerated the fibril formation.
At high salt concentration, short and thick fibrils were observed, which is called bundling. In this case, the repulsion force between the Aβs is reduced and no more repulsive force could be expected.
Moreover, the environment became more hydrophobic, and this induces side-to-side adsorption between the Aβs and also between
the fibrils. This resulted in short and thick fibrils, which are characterized by low-intensity ThT signals and approximately zero heat of dilution observed by ITC analysis.
In this study, the possible mechanisms for the formation of fibril and bundling were elucidated by kinetics and thermody-namics aspects, as described by eqs 3, 4, and 6. In the interaction mechanisms, charged side chain residues of Aβ, for example,
three His residues (His 6, 13, 14), may be involved in the deprotonation at different pH and salt conditions, which also influence the interaction mechanisms and induce the fibril elongation (thin and long fibril) or fibril assembly (bundling).
Conclusions
CD, ThT fluorescence, AFM, and ITC measurement techniques were used to investigate the mechanism of Aβ (1–40) aggregation
in an aqueous solution, which provide important information for interpreting the effect of various environmental factors on Aβ
aggregation. During aggregation, the secondary structure of Aβ
(1–40) changed from random coil toβ-sheet, as described by the
two-state model. The β-sheet structure was stabilized by an
intramolecular hydrophobic interaction. The results from kinetics analysis showed that the nucleation was the rate-determining step during Aβ aggregation. Meanwhile, thermodynamic analysis
demonstrated that a hydrophobic effect is the driving force in the nucleation process. Furthermore, different aggregation mechanisms were observed at high or low ionic strengths, resulting in distinctive fibril morphology. At a low ionic strength, the electrostatic repulsion between Aβ monomer allows possible
polymerization only at both ends of the fibrils, leading to the formation of long and thin fibrils. On the other hand, at a high ionic strength, bonding between fibrils could take place not only at both ends but also between two axial sides. This is due to the sheltering of electrostatic repulsion by ionic interactions, leading to short and thick fibrils. These phenomena were demonstrated by fluorescence measurements and AFM observations. In view of the whole study, an integrated mechanism for β-amyloid
aggregation is analyzed via kinetics and thermodynamics. The present study proves that the ITC data provide direct evidence for the thermodynamic driving force of the formation of Aβ
fibrils.
Acknowledgment. This work was supported by the National
Science Council of the Republic of China via a grant (for W.Y.C.) under contract no. NSC-95-2221-E-008-086.