College of Management
I-Shou University
Master Thesis
The Relationships of Brands on Animal Feed in
Vietnam – Among case study of DABACO Company
Advisor: Dr.
Chiao-Ping Bao
Co-Advisor: Dr.
Nguyen Quang Vinh
Graduate Student:
Nguyen Ha Chi
ABSTRACT
Along with customers, brand has been proved as one of the two most important intangible assets of the organization in the marketplace. It is generally agreed that the more customers are loyal to a certain brand, the more opportunity the organization could be successful. Thus, this paper aims at identifying the influential determinants that might affect the brand equity of DABACO Company in Vietnam.
From the findings, some recommendations for further improvements of DABACO‟s brand in this difficult time in the competitive Vietnam market are expected to be proposed. In order to do so, a survey questionnaire has been conducted among 100 customers of DABACO in order to collect their assessment toward DABACO‟s brand currently. Then, SPSS software will be utilized in order to analyze the collected data and come up with some findings. Among the three determinants of DABACO‟s brand, the brand loyalty and brand equity are proved to have significant impacts while the influence of brand awareness is proved to be insignificant.
Finding the two independent variables as Brand Loyalty and Brand Equity are highly relationship to customer intention.
TABLE OF CONTENTS
ABSTRACT ... ii
TABLE OF CONTENTS ... iv
LIST OF TABLES ... vi
LIST OF FIGURES ... vii
CHAPTER I – INTRODUCTION ... 1
1.1. Research Background ... 1
1.2. Research Objectives ... 1
1.3. Research Questions ... 2
1.4. Tentative Structure of the Research ... 2
CHAPTER II – REVIEW OF THE LITERATURE ... 4
2.1. Brand concept ... 4
2.2. Factor affecting brand development ... 5
2.2.1. Brand equity ... 5
2.2.2. Brand loyalty ... 7
2.2.3. Brand awareness ... 8
2.3. How to measure brand equity ... 9
2.4. Associations among different factors of brand developments ... 10
CHAPTER III – RESEARCH METHODOLOGY ... 14
3.1. Chapter introduction ... 14
3.2. Research model and hypotheses ... 14
3.3. Research design ... 15
3.3.1. Research philosophy ... 15
3.3.2. Research approach ... 16
3.3.3. Research method ... 16
3.4. Data collection method ... 17
3.4.1. Types of data ... 17
3.4.2. Sampling Technology ... 19
3.4.3. Questionnaire design ... 20
3.5. Data analysis method ... 20
CHAPTER IV – DATA ANALYSIS, DISCUSSIONS AND FINDINGS ... 21
4.1. Background information of respondents ... 21
4.1.1. Gender breakdown of the respondents ... 21
4.1.2. Age breakdown of the respondents ... 22
4.1.3. Distribution of respondents based on average monthly income (by million Vietnam dongs) ... 22
4.2. Reliability Test ... 23
4.2.1. Reliability Test of Brand Awareness (H1) ... 23
4.2.2. Reliability Test of Brand Loyalty (H2) ... 25
4.2.3. Reliability Test of Brand Equity (H3) ... 26
4.3. Factor Analysis ... 27
4.3.1. Factor Analysis Test of Brand Awareness (H1) ... 27
4.3.2. Factor Analysis Test of Brand Loyalty (H2) ... 29
4.3.3. Factor Analysis Test of Brand Equity (H3) ... 30
4.4. Descriptive Statistics of Brand Related Determinants ... 31
4.4.1. Descriptive Statistics of Brand Awareness (H1) ... 32
4.4.2. Descriptive Analysis of Brand Loyalty (H2) ... 35
4.4.3. Descriptive Analysis of Brand Equity (H3) ... 39
4.5. Multiple Regressions Analysis ... 43
4.6. Hypothesis testing ... 44
4.7. Equation ... 44
CHAPTER V – CONCLUSIONS AND RECOMMENDATIONS ... 46
5.1. Summary of the main findings ... 46
5.2. Recommendations for further improvements in DABACO’s brand ... 47
REFERENCES ... 50
LIST OF TABLES
Table 4.1. Gender breakdown ... 21
Table 4.2. Age ... 22
Table 4.3. Average monthly income (by million Vietnam dongs) ... 22
Table 4.4. Reliability Test of Brand Awareness ... 23
Table 4.5. Descriptive Analysis of Brand Loyalty ... 25
Table 4.6. Reliability Test of Brand Equity ... 26
Table 4.7. KMO and Bartlett's Test of Brand Awareness ... 28
Table 4.8. Total Variance Explained of Brand Awareness ... 28
Table 4.9. Factor Loading of Brand Awareness ... 28
Table 4.11. Total Variance Explained of Brand Loyalty ... 29
Table 4.12. Factor Loadings of Brand Loyalty ... 30
Table 4.13. KMO and Bartlett's Test of Brand Equity ... 30
Table 4.15. Factor Loadings of Brand Equity ... 31
Table 4.16. I can recognize DABACO products‟ packages ... 32
Table 4.17. I can recognize DABACO Company among different brands ... 33
Table 4.18. The recognition of DABACO brand encourages me to think of DABACO products in my next purchasing ... 34
Table 4.19. I can quickly remember the logo of DABACO Company... 35
Table 4.20. Descriptive Statistics of Brand Loyalty ... Error! Bookmark not defined. Table 4.21. I am committed to DABACO‟s brand ... 36
Table 4.22. I would recommend DABACO to my friends and family ... 37
Table 4.23. I will not buy animal feeds from other brands if DABACO is not available in the stores at that time ... 37
Table 4.24. I have intention to purchase DABACO in the future ... 38
Table 4.25. DABACO brand is my first choice when thinking about animal feeds products ... 38
Table 4.26. Descriptive Statistics of Brand Equity ... 39
Table 4.27. I have high preference for DABACO brand ... 40
Table 4.28. Products from DABACO are different from that of other brands ... 41
Table 4.29. DABACO brand makes me feel connected ... 41
Table 4.30. DABACO is a long-term brand ... 42
Table 4.31. The preference for DABACO brand encourages me to buy DABACO products 42 Table 4.33. Model Summaryb ... Error! Bookmark not defined. Table 4.34 – Coefficientsa ... 44
LIST OF FIGURES
Figure 2.1: Aaker‟s conceptual model ... 10 Figure 2.2: Azizi and Kapak‟s conceptual model ... 11 Figure 3.1: The proposed research model of determinants of brand equity ... 14
CHAPTER I – INTRODUCTION
1.1. Research Background
In fact, brand – one of the most significant factors of the marketing field has attracted meticulous attention from animal feed practitioners. Brand is generally understood as the classification of value and trust which might heavily affect the purchasing decisions of customers. Moreover, for Vietnamese consumers, the more loyalty a consumer is toward a certain brand, the more opportunity that brand has to be introduced to new users via the “word-of-mouth”. More importantly, this can eliminate the number of lapsers who may switch to use rival brands.
DABACO Group is an organization specializing mainly on animal feed, castle and poultry breeding and food processing in Vietnam. DABACO was established in 1996 and until now it has been developed to be listed as the first name in animal feed in Viet Nam and being one of ten biggest enterprises specialised in animal feed nationwide. However, the organization, in order to reach the international market and compete effectively with the rising competition in the domestic market, it is critical for DABACO to build and maintain strong and healthy brand.
In accordance with the mentioned problem facing DABACO Company in Vietnam market playground, this research aims at responding to the question why customers‟ purchasing intention is affected by a certain brand and how brand equity should be improved to help DABACO Company sustainably develop in the increasingly intense market. Based on the above discussions, the author has made decisions to choose: “Influence of brand on animal feed in Vietnam – A case study of DABACO Company” as his research topic.
1.2. Research Objectives
The general objective of the study is to identify the influential determinants that might affect the brand equity of DABACO Company in Viet Nam. From the findings of the research, some possible recommendations for further improvements of DABACO Company in the next difficult times with tough competition in Vietnam market place. Specifically, the research is guided by the following objectives:
(1) To identify significant determinants of brand development of DABACO Company brand in Viet Nam market
(2) To identify how these determinants affect the consumers‟ purchasing decisions of DABACO‟s products in the Vietnamese market.
(3) To implement integrated marketing communication strategies in the brand development of DABACO Company in the Vietnamese market.
(4) To improve the positioning & sustainable competitive advantage of DABACO Company through brand development in the Vietnamese market.
1.3. Research Questions
The main questions which will guide the whole research include:
(1) What are significant determinants of brand development of DABACO Company brand in Viet Nam market?
(2) How do these determinants affect the consumers‟ purchasing decisions of DABACO Company‟s products in the Vietnamese market?
(3) How should integrated marketing communication strategies be applied in the brand development of DABACO Company in the Vietnamese market?
(4) What are some recommendations to improve the positioning & sustainable competitive advantage of DABACO Company through brand development in the Vietnamese market?
1.4. Tentative Structure of the Research
The structure to which the dissertation will follow is briefly described as below
Chapter I – Introduction
In chapter I, the general background of the research will be provided in order that the readers will be equipped with basic perspective toward the study. Research‟s objectives and questions that will guide the whole research are introduced. Brief description of research methodology is also provided accordingly. Finally, the author identifies the main structure of the dissertation.
Chapter II – Review of the Literature
In this chapter, the discussions of relevant literatures toward different determinants in the research conceptual framework will be provided.
Chapter III – Research Methodology
The third section illustrates the main approaches toward the research methodology that will be applied in the research. Following, the procedures of data collection and analysis methods are also discussed.
Chapter IV – Data analysis, Findings and Discussions
In this chapter, the analysis of data will be presented leading to the discussions of main findings of the research.
Chapter V – Recommendations and Conclusions
A conclusion toward the main points in the dissertation will be presented. Furthermore, recommendations for further improvements if any will also be introduced.
CHAPTER II – REVIEW OF THE LITERATURE
Chapter II functions as the theoretical base for the whole study which makes attempts to analyze the brand related theories in the literatures in order to create a comprehensive conceptual framework for the paper. This section, therefore, will first dig into brand and other concepts related to brand building with the purpose of dealing with the research questions proposed in chapter I.
2.1. Brand concept
The concept of brand has long been recognized as a decisive factor for sustainable development of the organization by numerous researchers and businessmen. Brand and customer satisfaction are evaluated as the two most significant intangible resources of an organization (Taleghani and Almasi, 2011) which could contribute to stronger competitive advantages of that organization. Previously, the concept of brand is defined very simply. In traditional definition, brand is understood as the image, symbol or a name which could distinguishes the organization‟s products/services from that of numerous other rivals in the market (Aaker, 1991). Nevertheless, in the modern marketing theory, brand is more frequently to be approached from the customer-based perspective in which it is defined as the experiences of the customers toward the identification variables of an organization (including logo, slogan, brand name or promotional campaign). The identification should implicit and illustrate the values which are expected and enjoyed by the customers (Silva et al, 2012).
Brand might be either corporate brand or product brand. These two types of branding are totally different from each other by nature (Shahri, 2011). Product brand, in one hand, stresses on the relationship between the products and the clients in which marketing plays the role as a short tactic. In the other hand, corporate brand highlights the strategic role of the manager with critical responsibility. While product brand mainly pays attention to “people, values, practices and processes” (Balmer and Gray, as cited in Shahri, 2011), corporate brand is proved to be more complicated which is associated clearly with the long-term vision and corporate strategy of the organization. Branding strategy, indeed, is the application of corporate brand image on each product or service of the organization individually.
In the context of modern business world, the price is no longer to be at the top priority of the consumers anymore. Instead of that, customer loyalty and how to attract new customers are proved to be more important (Malik et al, 2013). Brand is now so increasingly appreciated by the customers that many of them are willing to pay a great amount of money for a branded item actually. The impacts of brand on customers‟ buying behaviors are proved to be excessively positive (Malik et al, 2013). Customers believe that branded item is a guarantee of quality and high social esteem which encourages the customers‟ purchasing decision and the performance of the organization eventually. Malik et al (2013) also listed out different determinants of brand values which could affect the purchasing decision of customers. Those determinants include guarantee, social responsibility and status symbol. Any organization whose brand has high social responsibility, strong guarantee and high status symbol could gain high level of customer loyalty and repeat purchasing activities of the customers. The impacts of brand on the purchasing behaviors of the consumers are proved to not mediating but direct.
Besides, Malik et al (2013) recommend that advertisement is the effective driving force to convey the message underlying brand image. The frequency of advertisement increases the possibility of being remembered and the time duration in which the brand image could stay in customers‟ mind. Furthermore, the authors also imply that in this society, customers highly appreciate the social status. Thus, the brand image which illustrates the high status symbol can be more attractive to the customers and create real competitive edge for the organization.
The authors also emphasize that brand is gradually understood as “something more than mere identifiers” with the emergence of brand equity. So, what is brand equity and why is it so important to a business?
2.2. Factor affecting brand development
2.2.1. Brand equity
As one of the most important issue in the branding field (Azizi and Kapak, 2013), brand equity has attracted the serious attention from the literature recently and resulted in hot debate between the marketing and accounting fields (Wood, 2000). While accounting always digs into brand equity as a financial-based construct which delivers the value to the firm, marketers usually take a different approach to work with this concept. Nevertheless, even
from the perspective of marketing only, brand equity is also understood under a variety of approaches which are whether consumer-oriented approach or company-oriented one. In spite of the availability of numerous different researches regarding brand equity from the literatures, there is still no exact definition of this concept.
However, the consumer-oriented definition is still the more popular and practical approach. Aaker (1991) has simplified this hot-debated issue by providing a customer-based definition of brand equity as “a set of brand assets and liabilities linked to a brand, its name and symbol that add to or subtract from the value provided by a product or service to a firm and/or to that firms‟ customers”. In a simpler definition, Park and Srinivasan (as cited in Pappu et al, 2005) assert that brand equity is stacked to “the value endowed by the brand to the product”.
More specifically, brand equity is understood as the benefits that allow the products to stand out others in the market thanks to the power of brand name (Stahl et al, 2012). It is supposed that brand equity brings various benefits to an organization. Brand equity has three main important functions (Lee and Leh, 2011). First of all, brand equity plays the role of the magnet which attracts potential customers to use the products of enterprises. Higher brand equity brings higher customer preferences and increases the purchasing intentions of potential customers. Secondly, for current customers, brand equity acts as the identifier that reminds the customers of the brand‟s products or services. Finally, it increases the commitment of customers to the organization. Regarding the significance of brand equity in the association with other brand constructs, Lassar et al (1995) assure that both brand extension and brand introductions are effectively supported by brand equity.
There are three approaches to measure brand equity. Stahl et al (2012) emphasize that brand equity could be evaluated through customer mind-set, product market or financial market. First of all, financial market approach could help to realize the future potentials of brand by subjective judgments while product market approach focuses on marketing practices but is unable to measure future values of the brand. Customer mind-set approach, in another hand, pays attention to the diagnostic value which analyses the strengths and weaknesses of identified brand. However, this approach is limited due to the lack of necessary information regarding brand performance such as market share or profitability.
Stahl et al (2012) also list out four key pillar of brand equity including (1) knowledge, (2) relevance, (3) esteem and (4) differentiation. The first factor - the knowledge of the
customers directly affect the possibility of the brand to be recognized by the customers which is closely related to brand awareness. Meanwhile, the other three factors – relevance, esteem and differentiation relate directly to brand association.
The perspective of Malik et al (2013) is approved by the study of Zhang (2015) on brand image. Following Zhang‟s perception (2015), brand image is evaluated as the key driver of brand equity which reflects the general perception of customers toward a brand and strongly affects their purchasing decisions. Brand image has a significant role in enhancing customer satisfaction, especially in the service field. For example, in a store, there are four elements could influence the store image including “store infrastructure, convenience, store service and sales activities” (Zhang, 2015). If the store is perceived by the customers with the image of a advanced and excellent store services, customers‟ satisfaction will increase leading to their higher loyalty which directly impact future purchasing intentions of customers. By that way, brand image is perceived as one of the key driving forces of customers‟ loyalty.
2.2.2. Brand loyalty
It has long been recognized that brand development not depends on the quantity of customers but their commitment to and purchasing decisions toward the organizations‟ products or services (Odin et al, 2001) which highlights the significance of brand loyalty to the development of organization‟s brand. From customers‟ point of view, brand loyalty is understood as the biased responses of customer times by times when deciding among alternative brands (Touzani and Temessek, 2009). Brand loyalty is a decisive factor affecting the repurchasing decisions of customers (Jensen and Hansen, 2006).
The brand loyalty involves in the repeated purchasing behaviours of customers. It means that the good customer retention leads to the brand loyalty. There are several reasons that create the brand loyalty. The quality of products and services which make customers to repeatedly come back to the companies, the continuous promotion programs which attract customers and drive customers to come back. The after-sales services or the staffs‟ attitudes are also two of the reasons that lead to the brand loyalty (Neslin, 2002). By another definition, brand loyalty is understood as the biased responses of customers toward an identified brand among sets of different brands due to the psychological impact of than brand on customers (Mao, 2000). Simply stated, the brand loyalty involves the psychological factor or the psychological process. The brand loyalty can be achieved when the customers come
back for the products and services so many times because they totally put their trusts in the brand names. Therefore, in the market penetration strategy of Organizations, the company should make every effort to achieve the brand loyalty in the markets of Southeast Asia because the brand loyalty will help the company expand market share and achieve higher profitability (Denoue and Saykiewicz, 2009). In addition, the customers‟ engagement also helps the company achieve its objectives and goals amidst the context of global economic downturn generated from the financial crunch triggered in the United States. Simply stated, the brand loyalty measures the loyalty of customers to an identified brand name by evaluating the re-purchasing behaviours of these customers. Having an insight into the brand loyalty, companies are able to promote or reinforce the factors that affect the brand loyalty to achieve higher loyalty from their customers. As mentioned above, the brand loyalty is very important factor in enhancing the shareholders‟ values by reducing unsteadiness and related uncertainty with the future cash flows risk. Some previous researches have indicated that the nexus or correlation between the customers‟ behaviours and the brand loyalty is proved to be excessively healthy and positive. In this dissertation, Organizations should make every effort to be fully aware of the brand loyalty to increase the shareholders‟ values and profits (Petersen et al, 2009).
2.2.3. Brand awareness
Along with brand loyalty and equity, brand awareness is also of great significance. Different from brand loyalty, brand awareness illustrates the degree, to which customers could easily recall the brand or in other words the identification of a brand (Chi et al, 2009). If brand loyalty plays an important role in purchasing decisions of customers, brand awareness has strong impacts on their purchasing intention.
Malik et al (2012) have assured that brand awareness has an important impact on the purchase intentions of consumers. First of all, brand awareness is generally understood as the familiarity of the customers toward the company‟s products and services. Brand awareness associates with the good and acceptable reputation of the organization in the market. The process of purchasing a product of customers involves careful consideration of different brands. There are generally five steps in a purchase intention process including “problem identification, information search, evaluating the alternatives, makes purchase and post-purchase behaviours” (Malik et al, 2012). Whether the post-purchase is planned carefully or not, the consideration among numerous alternatives is unavoidable. In this consideration time,
brand awareness takes effects by creating a close association between identified brand and customers‟ memory. The feeling and previous purchasing experiences of customers might affect the preference of customers and their loyalty toward the brand which eventually influence customers‟ purchasing intention. Without brand awareness, there is not any possibility for any transaction to be occurred (Malik et al, 2012). Furthermore, the reputation of brand in the market via brand awareness could take effects on the perceived risk evaluation which reduces the uncertainty and increase the level of assurance of the buying decisions.
The vital role of brand awareness in customers‟ purchasing decisions has been previously emphasized by Chi, Yeh and Yang (2009). Chi, Yeh and Yang (2009) refers to brand awareness as the recognition and recall possibility of a brand in customers‟ mind. The authors suggest three types of brand awareness including unaided awareness, top of mind awareness and aided awareness. Chi, Yeh and Yang (2009) also distinguished brand awareness from width and depth. From the depth perspective, brand awareness assists customers in recalling and memorizing the brand easily. The recall of brand in customers‟ mind results in the width perspective of brand awareness which inspires the “infers” about the brand immediately when customers purchase a product. To explain for the reason why brand awareness has significantly important role in the purchasing process of customers, Chi, Yeh and Yang (2009) describes the purchasing process of customers which involves the preferences for familiar and popular products. Customers tend to buy the products with familiar and well-known brand. Brand awareness is essential in determining the possibility that a brand belong to the consideration set of customers when buying a products/ services. Positive brand awareness enables the customers to recognize the brand in the tremendous sea of product category and make purchase decision. Brand awareness, in this case, plays the role of consideration base for product selection on the basis of quality evaluation from other customers.
2.3. How to measure brand equity
As having been mentioned previously, brand equity is understood differently by accounting and marketing. Though the financial values of brand equity have been already measured by numerous approaches, the value scale of customer-oriented brand equity seems to be lacking (Lassar et al, 1995). Recognizing this inadequacy of brand equity measurement, Lassar et al (1995) have proposed five dimensions that should be applied to measure customer-based brand equity including “performance, value, social image, trustworthiness,
and commitment”. Furthermore, it is also concluded that the products with higher prices has higher frequency of having higher brand equity. Thus, price could be seen as determinant of customer-based brand equity measurement.
2.4. Associations among different factors of brand
developments
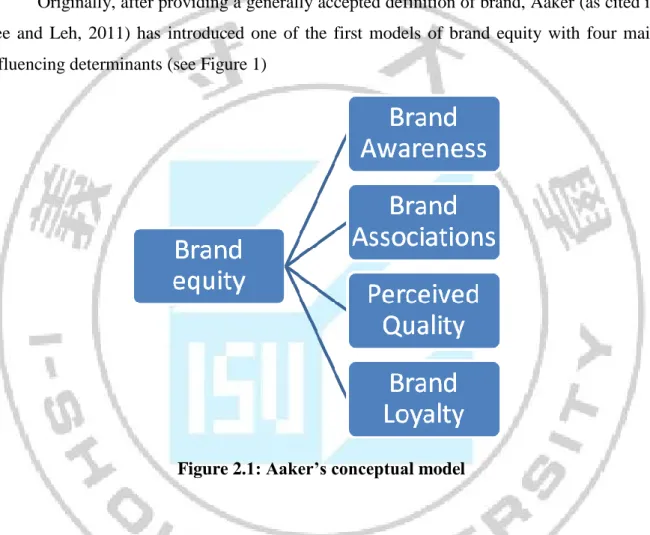
Originally, after providing a generally accepted definition of brand, Aaker (as cited in Lee and Leh, 2011) has introduced one of the first models of brand equity with four main influencing determinants (see Figure 1)
Figure 2.1: Aaker’s conceptual model
Sharing the same idea with Aaker (1991), Keller (2003) also describes Brand awareness, Brand associations, Perceived quality and Brand loyalty as the four main assets of the multi-dimensional concept - brand equity. All of these four constructs are said to have significant impacts on the measurement of consumer -based brand equity (Lee and Leh, 2011).
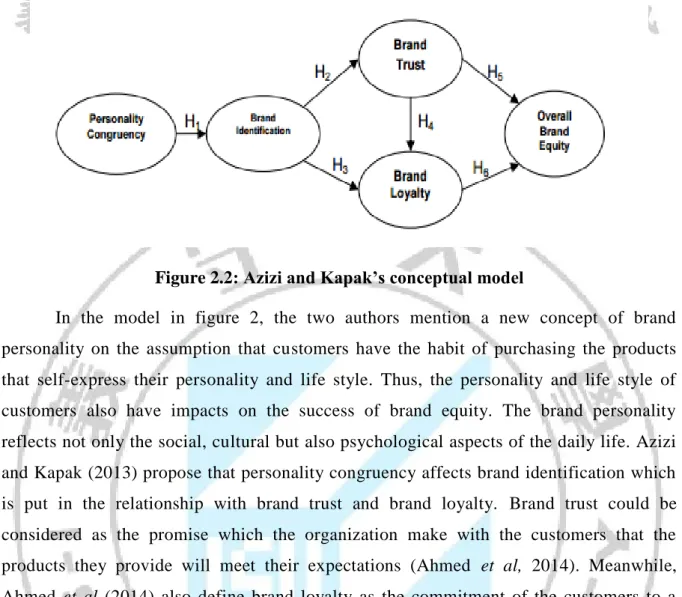
From a different perspective, Azizi and Kapak (2013) recommend a conceptual model of brand equity that links brand equity with the personality congruency of customers. The conceptual framework proposed by Azizi and Kapak is presented as follows:
Figure 2.2: Azizi and Kapak’s conceptual model
In the model in figure 2, the two authors mention a new concept of brand personality on the assumption that customers have the habit of purchasing the products that self-express their personality and life style. Thus, the personality and life style of customers also have impacts on the success of brand equity. The brand personality reflects not only the social, cultural but also psychological aspects of the daily life. Azizi and Kapak (2013) propose that personality congruency affects brand identification which is put in the relationship with brand trust and brand loyalty. Brand trust could be considered as the promise which the organization make with the customers that the products they provide will meet their expectations (Ahmed et al, 2014). Meanwhile, Ahmed et al (2014) also define brand loyalty as the commitment of the customers to a certain brand. With brand loyalty, customers will consistently repeat their purchasing behaviours with the brand leading to high sales volume. These two variables will eventually influence the overall brand equity which is the total value of a brand which are separated from the balance sheet and illustrated via the relationship and beliefs of the customers toward the brand (Wood, 2000).
From another perspective, Brand building has long been recognized as one of the key tools to differentiate organization from others which creates sustainable competitive advantage to the firm (Ghodeswar, 2008). Brand identity is established organization‟s understanding of its key external stakeholders (customers and business environment) as well as its competitors. According to Ghodeswar (2008), the differentiation role of brand belongs to the second level of its five-step evolving cycle from first labelling to the highest level of being cult. Ghodeswar also emphasizes that brand identity includes core and extended identity. While core brand identity is the constant values of brand which
remains the same no matter what market the organization operates in, extended brand identity is the additives which provide brand completeness. Differentiation also belongs to one of the three key roles of brand identity along with resonating with customers and representing what the organization will do overtime. Brand identity brings distinctive enduring values associated with the products or services provided by the organization.
There are four stages in a process of building distinctive brand identity recommended by Ghodeswar (2008). First of all, the brand should be positioned. Positioning the brand means establishing a general perception toward the brand in customers‟ mind which helps the organizations stand apart from other rivals‟ offerings in the market. Clearly, the differentiation function of brand identity has been illustrated right in the first stage. Well positioned brand creates distinctive and competitive advantage of the organization with distinctive brand focus. Secondly, when the brand has been well-positioned with distinctive characteristics, those features should be communicated effectively to the customers to achieve differentiated brand image. Brand performance, thirdly, will be delivered via product/service performance, customer care and customers delight. Finally, brand equity creates new relationships by numerous types of corporation which could enhance the differentiation of the host brand eventually. Ghodeswar (2008) has proved that brand differentiation involves in every single steps of establishing brand identity of an organization with different functions and roles.
Sharing the same idea with but even prior to Ghodeswar (2008), Romaniuk, Sharp and Ehrenberg (2007) put a more emphasis on the role of differentiation as a “core principle” of the marketing process. The performance of marketers is recommended to be evaluated on the basis of how well they differentiate their brand from others in the market. The authors highlight that differentiation is a must of brand which serves three main objectives: (1) to gain larger market share, (2) to maintain current market share and (3) generate higher profitability. With differentiation, the brand could become identifiable and a preference in the market which contributes to larger market share and higher profit. Romaniuk, Sharp and Ehrenberg (2007) also indicate that branding activity is an essential source of differentiation. Brand identity assists customers in noticing and realizing brand name in their purchasing process. The elements include colours, logo, slogans, symbols, celebrities and advertising styles. The brand identity communicates the distinctive characteristics of the products or services provided by the organization to customers which aid to differentiate the brand over others in the market.
Based on the three mentioned frameworks, the author has proposed his own model regarding different factors influencing brand equity which are (1) brand loyalty, (2) brand awareness, (3) brand trust and (4) personality congruency. Accordingly, hypotheses are also established on the assumptions that there are positive relationships between those determinants and organization‟s brand development.
CHAPTER III – RESEARCH METHODOLOGY
3.1. Chapter introduction
In the earlier section, we have detailed the literature framework with study of suitable documents. When the theoretical purpose is concentrated on the chapter II, the main mission of chapter III is to be the elaborated methodology foundation toward the methodology that will be applied in this research. Firstly, the design of the research including research philosophy, research approach and research method will be displayed. After that, by focusing on sampling technique, the introduction of data collection and analysis procedure is highlighted. Then, the comprehensive methodology system will be established.
3.2. Research model and hypotheses
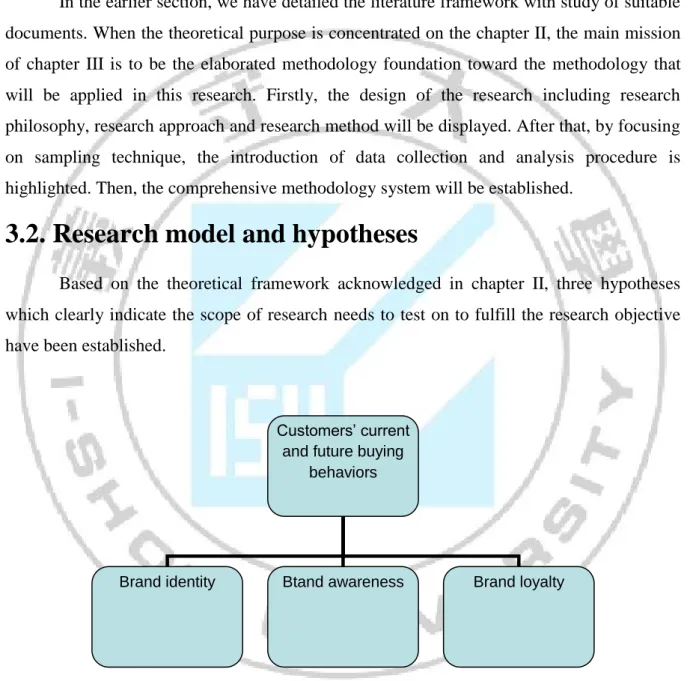
Based on the theoretical framework acknowledged in chapter II, three hypotheses which clearly indicate the scope of research needs to test on to fulfill the research objective have been established.
Figure 3.1: The proposed research model of determinants of brand equity Following, the research hypotheses that drive the research include:
H1: There is a positive relationship between brand identity and customers‟ current
and future buying behaviors
Customers’ current and future buying
behaviors
H2: There is a positive relationship between brand awareness and customers‟ current
and future buying behaviors
H3: There is a positive relationship between brand loyalty and customers‟ current and
future buying behaviors
As being seen in the above research model, the relationships between the dependent variable which is customers‟ current and future buying behaviors and different independent variables related to branding including brand identity, brand awareness and brand loyalty have been described by the author. Furthermore, the research concentrates on investigating the influence of communication marketing as a tool to enhance the effectiveness of branding on customers‟ purchase intention.
3.3. Research design
3.3.1. Research philosophy
Four main research philosophy types namely positivism, realism, interpretivsm, and pragmatism have been listed out by Saunders (2009) in his research. The type of research philosophy used will heavily impact the research development process as well as the final results. On the contrary, Neville in 2005, projected positivism and phenomenology as the two research philosophies that are most widely used in the current contemporary management research field.
The researcher decided to choose positivism as the main research philosophy of the dissertation after carefully considering the four main research philosophies. In Adler (1964)‟s definition, positivism is known as the “philosophical approach, theory, or system based on the view that in the social as well as the natural sciences sense experiences and their logical and mathematical treatment are the exclusive source of all worthwhile information”.
According to that definition, Adler (1964) emphasized that the main source of information in a research following positivism philosophy is the affirmative facts and real phenomena which will then be explained by scientific methods. Having the similar ideas with Alder, Hjorland (2005) convinces that positivism philosophy is glued with deductive technique in order to discover and verify the truth based on the empirical analysis.
The choice of positivism philosophy for this research is owing to two main reasons. Initially, positivism is the best research philosophy research philosophies which examine the
causational relationship among different antecedents (Hume, 1995). This dissertation focuses on examining the causational relationship between different determinants of brand on customers‟ current and future purchasing intention. Therefore, the positivism philosophy is extraordinary relevant for this research.
Secondly, the positivism supports researcher to examine the research topic from decisive and objective viewpoint (Leahey, 1992). This objective viewpoint made the researcher stop personal bias which is excessively important for such a graduate study.
3.3.2. Research approach
Many researchers have paid their attention to inductive and deductive which are the two most well-known approaches in the contemporary literature included in the four mentioned popular research philosophies. (Hyde, 2000)
Firstly, the inductive approach is addressed as a “bottom up” theory building procedure which moves from specific observations to the broader generalizations by Hyde (2000). Based on his own assertive problems, hypotheses and assumes some generalizations are created by researcher. Following those generalizations, for testing those hypotheses and building new theories, the researcher adopts the data collected from proper data collection and analysis instruments. Succeeding inductive approach, as the hypotheses have not been proved by any previous studies yet, largely doubtfulness restricts the research.
By contrast with the inductive approach, deductive approach takes notice of the existing theories in the literature and then deduces hypotheses from that literature (Robson, 2002). With this method, we can suppose that if a hypothesis is right in numerous cases, it will be right in almost all cases. In conclusion, deductive approach is a kind of theory testing process. The research is prevented from personal bias by deductive approach as it depends on previous subjective studies.
The deductive approach is more appropriate for the research which is a graduate paper limited by time and capacity. That is also the reason why the research considers deduction as the main approach.
3.3.3. Research method
Despite the fact that quantitative and qualitative are the two most popular research methods in the contemporary research, the distinction between those two is still “abstract”,
such as confusion or bias always exists. As a result, in this research, the author decided to choose a mix-method approach which utilizes both qualitative and quantitative research. Those two research methods will out balance the other disadvantage and assist each other alternatively.
To collect numeric data by the application of different numeric data collection technique such as questionnaires or statistics, the research uses quantitative method. Tables or charts are 2 forms make quantitative data become more vivid and virtually impressed when present numeric data. It is said that quantitative method will go well with the research following the deductive approach (Bryman and Bell, 2007), while qualitative approach strongly focuses on non-numeric data with the assistance of non-numeric technique such as interviews or observations.
The qualitative method functions as analyzing non-numeric data collected from literature and interview. Meanwhile, quantitative method takes the responsibilities of dealing the numeric data gathered from close-ended questions in questionnaires. This research is contributed by numeric and non-numeric data so that both qualitative and quantitative methods are applied.
3.4. Data collection method
3.4.1. Types of data
In general, secondary and primary data are two main types of data with its own advantages and disadvantages.
a. Secondary data
Secondary data is normally known as the data collected by other researchers in their prior research for different purposes and is currently being re-analyzed (Saunders et al, 2007) Secondary data consist of not only qualitative but also quantitative data which could be either raw data or published data. It has variety of sources to select from including journal articles, conference reports, published books, media or the Internet.
Numerous advantages are brought by applying secondary data in comparison with the primary one. Firstly, using secondary data will save more time than using primary data as secondary one is prepared to use without long data collection procedure (Church, 2001).. In addition, secondary data is enabled to be not limited by the geography boundaries as primary
data under the application of e-searching tools (Srivastava and Rego, 2011). Moreover, applying secondary data will bring economy because some of them are provided freely in the Internet or libraries of universities.
However, the researchers should look back some several drawbacks of secondary data. Initially, because of the huge secondary information available, it is difficult to assure the reliability and accuracy of the collected data which requires a careful selection and great e-searching skill. Secondly, it is inappropriate to use secondary data for the new research objectives as it was previously collected by other purpose. That makes researcher find difficult to control the secondary data to fit his own research design. Finally, while using secondary data, the issue of authenticity and copyright should also be taken notice of
In this research, the company‟s marketing department provided secondary data which will be analyzed and presented under the forms of tables and charts. Lately, to provide a sound theoretical framework for the research, secondary data from other sources such as books and the Internet will also be used.
b. Primary data
Primary data, however, is the data originated from the direct data collection of the researcher which is analyzed the first time in researcher‟s work (Srivastava and Rego, 2011). When the researcher could not find any secondary data which fits the purposes of his research, primary data is gathered under the application of numerous tools and techniques.
Different from secondary date, whatever data the researcher collect directly and is analyzed on the very first time of researcher‟s work is called primary data, following Srivastava and Rego (2011). The primary data will be the other alternative for the researcher in case there is no secondary data meet the requirements of his research.
Primary data is shown its advantages as it addresses the specific matters in the research. That explains why collected data will be perfect for the research design. In addition, the primary data is original; it promotes and guarantees the innovation of a research as a result. Of course, drawbacks are inevitable. The way to apply this kind of data has to challenge with a lot of difficulties. In detail, the research used primary data is more expensive and time-consuming than the one applied secondary data only. Besides, the researcher has to conduct the research within geographical boundaries.
dissertation. A questionnaire is designed and sent out to 100 customers of DABACO Company in Viet Nam to study the customers‟ evaluation about the brand equity and its impacts on their purchasing decisions.
Quantitative method is the main methodology of this research. The questionnaire survey during the writer‟s period of conducting this dissertation collects the primary data. To investigate the customers‟ evaluation about the brand equity and its impacts on their purchasing decision, 100 customers of DABACO Company in Vietnam are received a questionnaire. One of the most popular methods of collecting primary data is survey questionnaire which is mostly applied in descriptive and explanatory research (Saunders et al, 2007).
There are two main kinds of survey questionnaire includes Self-administered and interviewer administered questionnaire. In this research, self-administered questionnaire is used due to several reasons.
First of all, mostly closed end questions is listed in self-administered questionnaire that helps to save time and is quicker to be conducted. The interviewer administered questionnaire find challenging when conducting in geographically separated circumstance.
Secondly, self-administered questionnaire might prevent the interviewer from containing subjective bias.
Finally, self-administered questionnaire allows respondents to complete the survey whenever they want which could bring more accurate results.
3.4.2. Sampling Technology
Beside qualitative and quantitative research, sampling technique is very important to gather accurate data. Compare with qualitative and quantitative research, sampling technique is very important to gather accurate data.
Sampling technique has 2 main types: probability sampling and non-probability sampling (Saunders et al, 2009). The whole sample population is considered as its sample by probability sampling. However, respondents from different groups of the total population are selected by non-probability sampling. The customers of DABACO brand in Viet Nam are the sample population for the research. However, it is too large to select the sample population as the sample size of the research. Therefore, to define the sample size of the research, the author has applied non-probability technique
3.4.3. Questionnaire design
Self -administered questionnaire and interviewer-administered questionnaire are two main types of questionnaire. The author has chosen the self-administered questionnaire for the research, after considering the advantages and disadvantage of the two types of questionnaire. Firstly, it will be quick and cheaper to conduct in a large geographic area by self-administered questionnaire. In addition, another advantage of self-administered questionnaires is anonymity which makes participants to have the honest answers and avoid the bias ones. Last but not least, the respondent will feel more convenient as they can complete the survey whenever they want. Finally, the questionnaire is translated into Vietnamese and designed with mostly closed-ended questions so that the respondent can comprehend the questionnaire.
3.5. Data analysis method
To analyze the raw data selected from survey questionnaire, the research will apply SPSS 18 following the below steps. First of all, demographic statistics will be given as the threshold for the main part of the research in the form of descriptive analysis. Then the coefficients Cronbach‟s Alpha to test the reliability and Factor analysis will be applied to test and describe the association between different determinants and brand equity. Descriptive analysis will then be applied to take a deeper insight into the research problems. Finally, hypothesis testing is applied to determine whether proposed hypotheses are supported or not.
3.6. Chapter summary
In general, the set of methodology which will be applied to meet the research‟s objectives has been described in a detailed way by all above sections. Under the application of deductive approach and quantitative research method, positivism has been chosen as the main research philosophy. The main source of data will be collected under a survey questionnaire is Primary data. Chapter IV will show reader with the analysis of data and findings of the research by the data collected under this methodology.
CHAPTER IV – DATA ANALYSIS, DISCUSSIONS
AND FINDINGS
Chapter introduction
Previously, in the three above sections, the researcher has described the research topic of examining the influences of brand on animal feed in Vietnam on customers‟ purchasing intentions and behaviors with a case study into DABACO Company. In order to solve this research objective, the theoretical framework with three interdependent variables of brand including brand awareness, brand loyalty and brand equity has been introduced in chapter II with the assumption that those three variables have close relationship with the behaviors of the customers.
In order to test the theoretical framework built in chapter II, chapter III has described the set of methodology which will be applied in order to collect necessary data to address the research questions. A survey questionnaire has been distributed to the hand of 100 respondents who are DABACO‟s customers to collect their opinions toward how brand of DABACO affect their behaviors further.
With the data collected from the questionnaire survey, this chapter will analyze those data accordingly with the support from SPSS 20 in order to come up with the discussions and findings. Cronbach‟s Alpha Reliability Test, Factor Analysis, Descriptive Analysis and Multiple Regressions will be applied in this section. After this part, the current performance of DABACO brands and its impacts on customers‟ behaviors are expected to be revealed.
4.1. Background information of respondents
4.1.1. Gender breakdown of the respondents
Table 4.1. Gender breakdown
Frequency Percent Valid Percent Cumulative
Percent
Valid Male 42 42,0 42,0 42,0
Female 58 58,0 58,0 100,0
As can be seen from the above table that the gender distribution between male and female in this paper is relatively equal with 42% of the sample population going to male and 58% of the total population going to female. This figure indicates that there is no clear difference between male and female proportion which could help to reduce the gender bias in the main section further.
4.1.2. Age breakdown of the respondents
Table 4.2. Age
Frequency Percent Valid Percent
Cumulative Percent Valid 13-25 10 10,0 10,0 10,0 26-35 45 45,0 45,0 55,0 36-45 45 45,0 45,0 100,0 Total 100 100,0 100,0
Table 4.2 indicate the age breakdown of the total sample size which divides respondents into three main categories including 10% for 13-25 years old, 45% for 25-35 years old and finally another 45% of the respondents are from 36-45 years old
4.1.3. Distribution of respondents based on average monthly
income (by million Vietnam dongs)
Table 4.3. Average monthly income (by million Vietnam dongs)
Frequency Percent Valid Percent
Cumulative Percent Valid <4 6 6,0 6,0 6,0 9-13 79 79,0 79,0 85,0 22-35 15 15,0 15,0 100,0 Total 100 100,0 100,0
Most customers accounting for 79% of the total sample size have medium income from 9 to 13 million a month. The high class respondents in terms of income account for 15% only. This group has the income ranging from 22 to 35 million Vietnam dongs per month.
The group whose monthly income is lower than 4 millions only accounts for 6% of the total sample size.
4.2. Reliability Test
In order to test the internal consistency of the collected data, the Cronbach‟s alpha reliability test has been applied. The data which passes the reliability test will be proved to be free from random error. The standards which should be satisfied in this Cronbach‟s alpha reliability test include:
Reliability coefficient of alpha > 0.60
The corrected item-total correlation > 0.30
„Alpha if item deleted‟ should be not greater than „reliability coefficient of alpha‟.
Reliability test of the three hypotheses will be presented in the following sections.
4.2.1. Reliability Test of Brand Awareness (H1)
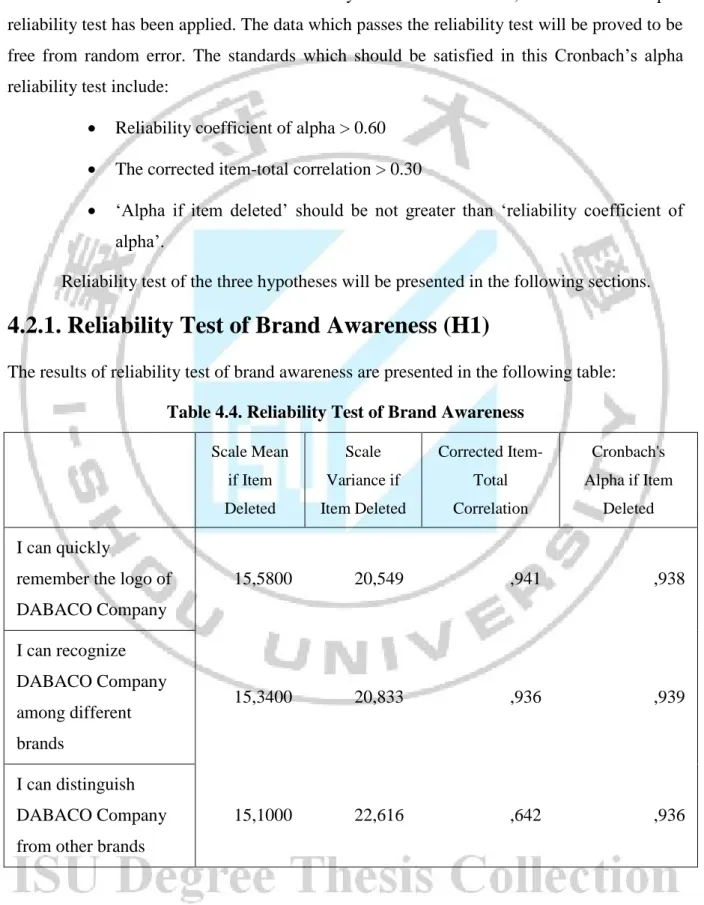
The results of reliability test of brand awareness are presented in the following table: Table 4.4. Reliability Test of Brand Awareness
Scale Mean if Item Deleted Scale Variance if Item Deleted Corrected Item-Total Correlation Cronbach's Alpha if Item Deleted I can quickly
remember the logo of DABACO Company 15,5800 20,549 ,941 ,938 I can recognize DABACO Company among different brands 15,3400 20,833 ,936 ,939 I can distinguish DABACO Company from other brands
I can recognize DABACO products‟ packages 15,4000 22,869 ,898 ,945 The recognition of DABACO brand encourages me to buy DABACO products 15,7200 21,699 ,926 ,941 The recognition of DABACO brand encourages me to think of DABACO products in my next purchasing 15,3600 22,677 ,903 ,944
Cronbach’s alpha reliability coefficient = 0.956
As can be seen from the above table, all determinants in the Brand Awareness hypothesis pass the reliability test because they satisfy the required standards which are indicated in the following section:
Reliability coefficient of alpha is 0.956 > 0.60
The corrected item-total correlation (0.941, 0.936, 0.642, 0.898, 0.926, and 0.903) > 0.30
„Alpha if item deleted‟ (0.938, 0.939, 0.936, 0.945, 0.941, and 0.944) are not greater than „reliability coefficient of alpha‟ which is 0.956.
Therefore, all variables of Brand Awareness will be kept for further analysis in the factor analysis test.
4.2.2. Reliability Test of Brand Loyalty (H2)
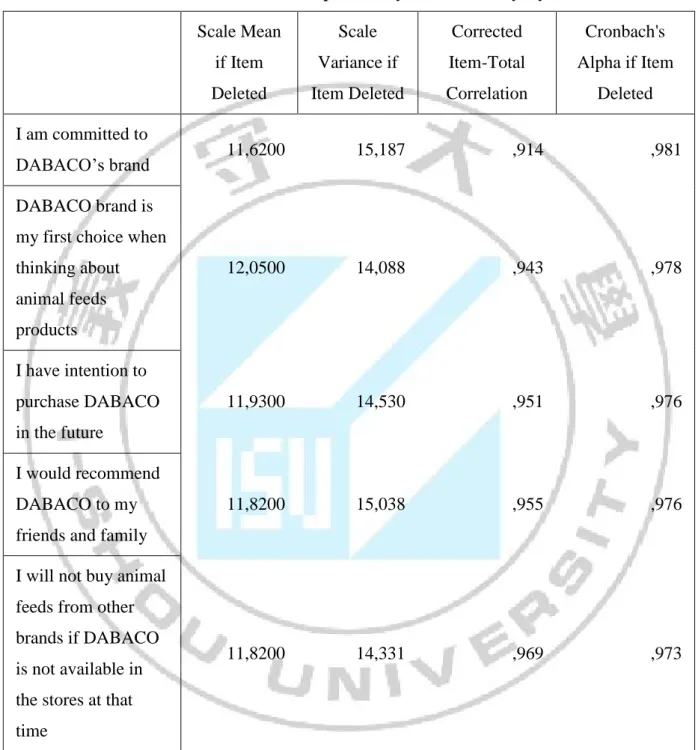
The results of reliability test of brand awareness are presented in the following table: Table 4.5. Descriptive Analysis of Brand Loyalty
Scale Mean if Item Deleted Scale Variance if Item Deleted Corrected Item-Total Correlation Cronbach's Alpha if Item Deleted I am committed to DABACO‟s brand 11,6200 15,187 ,914 ,981 DABACO brand is my first choice when thinking about animal feeds products 12,0500 14,088 ,943 ,978 I have intention to purchase DABACO in the future 11,9300 14,530 ,951 ,976 I would recommend DABACO to my friends and family
11,8200 15,038 ,955 ,976
I will not buy animal feeds from other brands if DABACO is not available in the stores at that time
11,8200 14,331 ,969 ,973
Cronbach’s alpha reliability coefficient = 0.981
As can be seen from the above table, all determinants in the Brand Loyalty hypothesis pass the reliability test because they satisfy the required standards which are indicated in the following section:
The corrected item-total correlation (0.914, 0.943, 0.951, 0.955, and 0.969) > 0.30
„Alpha if item deleted‟ (0.981, 0.978, 0.976, 0.976 and 0.973) are not greater than „reliability coefficient of alpha‟ which is 0.981.
Therefore, all variables of Brand Loyalty will be kept for further analysis in the factor analysis test.
4.2.3. Reliability Test of Brand Equity (H3)
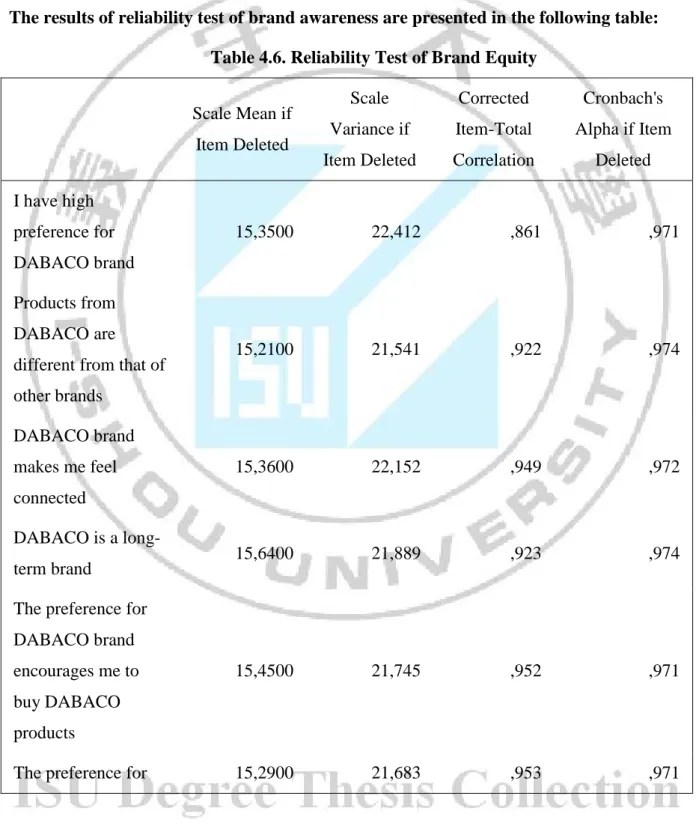
The results of reliability test of brand awareness are presented in the following table: Table 4.6. Reliability Test of Brand Equity
Scale Mean if Item Deleted Scale Variance if Item Deleted Corrected Item-Total Correlation Cronbach's Alpha if Item Deleted I have high preference for DABACO brand 15,3500 22,412 ,861 ,971 Products from DABACO are different from that of other brands 15,2100 21,541 ,922 ,974 DABACO brand makes me feel connected 15,3600 22,152 ,949 ,972 DABACO is a long-term brand 15,6400 21,889 ,923 ,974
The preference for DABACO brand encourages me to buy DABACO products
15,4500 21,745 ,952 ,971
DABACO brand encourages me to think of DABACO products in my next purchasing
Cronbach’s alpha reliability coefficient = 0.978
As can be seen from the above table, all determinants in the Brand Equity hypothesis pass the reliability test because they satisfy the required standards which are indicated in the following section:
Reliability coefficient of alpha is 0.978 > 0.60
The corrected item-total correlation (0.861, 0.922, 0.949, 0.923, 0.952, and 0.953) > 0.30
„Alpha if item deleted‟ (0.971, 0.974, 0.972, 0.974, 0.971, and 0.971) are not greater than „reliability coefficient of alpha‟ which is 0.978.
Therefore, all variables of Brand Equity will be kept for further analysis in the factor analysis test.
4.3. Factor Analysis
After the Reliability Test, Factor Analysis test is also applied in order to reduce the unnecessary variables in the identified set of variables in the framework without affect the overall results. The Reliability Test of this paper is conducted on the bas is of the following standards:
- KMO (Kaiser-Meyer-Olkin) is between 0.5 and 1.0 - Barlett sig. is lower than 0.05 (or 5%)
- The cumulative Eigenvalues are greater than 0.05 (or 5%) - Factor loading is greater than 0.50
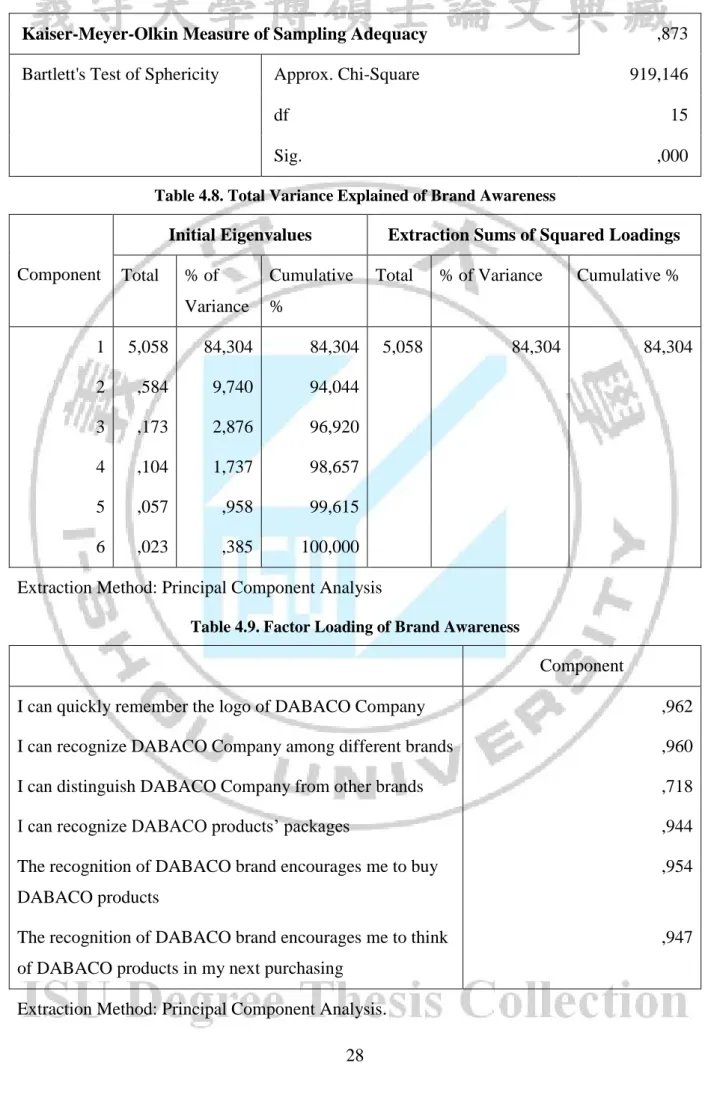
Table 4.7. KMO and Bartlett's Test of Brand Awareness
Kaiser-Meyer-Olkin Measure of Sampling Adequacy ,873
Bartlett's Test of Sphericity Approx. Chi-Square 919,146
df 15
Sig. ,000
Table 4.8. Total Variance Explained of Brand Awareness
Component
Initial Eigenvalues Extraction Sums of Squared Loadings Total % of
Variance
Cumulative %
Total % of Variance Cumulative %
1 5,058 84,304 84,304 5,058 84,304 84,304 2 ,584 9,740 94,044 3 ,173 2,876 96,920 4 ,104 1,737 98,657 5 ,057 ,958 99,615 6 ,023 ,385 100,000
Extraction Method: Principal Component Analysis
Table 4.9. Factor Loading of Brand Awareness
Component
I can quickly remember the logo of DABACO Company ,962
I can recognize DABACO Company among different brands ,960
I can distinguish DABACO Company from other brands ,718
I can recognize DABACO products‟ packages ,944
The recognition of DABACO brand encourages me to buy DABACO products
,954
The recognition of DABACO brand encourages me to think of DABACO products in my next purchasing
a. 1 components extracted
The results from the above table have indicated that all determinants of Brand Awareness could satisfy the standards of the factor analysis test of this paper. Specifically, the results are presented as follows.
- KMO (Kaiser-Meyer-Olkin) is 0.873 which is between 0.5 and 1.0 - Barlett sig. is 0.000 which is lower than 0.05 (or 5%)
- The cumulative of variance is 84.304% which are bigger enough.
- Factor loadings (0.962, 0.960, 0.718, 0.944, 0.954 and 0.947) are all greater than 0.50
4.3.2. Factor Analysis Test of Brand Loyalty (H2)
Table 4.10. KMO and Bartlett's Test of Brand Loyalty
Kaiser-Meyer-Olkin Measure of Sampling Adequacy. ,887
Bartlett's Test of Sphericity Approx. Chi-Square 862,424
df 10
Sig. ,000
Table 4.11. Total Variance Explained of Brand Loyalty
Component
Initial Eigenvalues Extraction Sums of Squared Loadings Total % of
Variance
Cumulative %
Total % of Variance Cumulative %
1 4,665 93,299 93,299 4,665 93,299 93,299
2 ,142 2,836 96,135
3 ,096 1,930 98,065
4 ,065 1,303 99,368
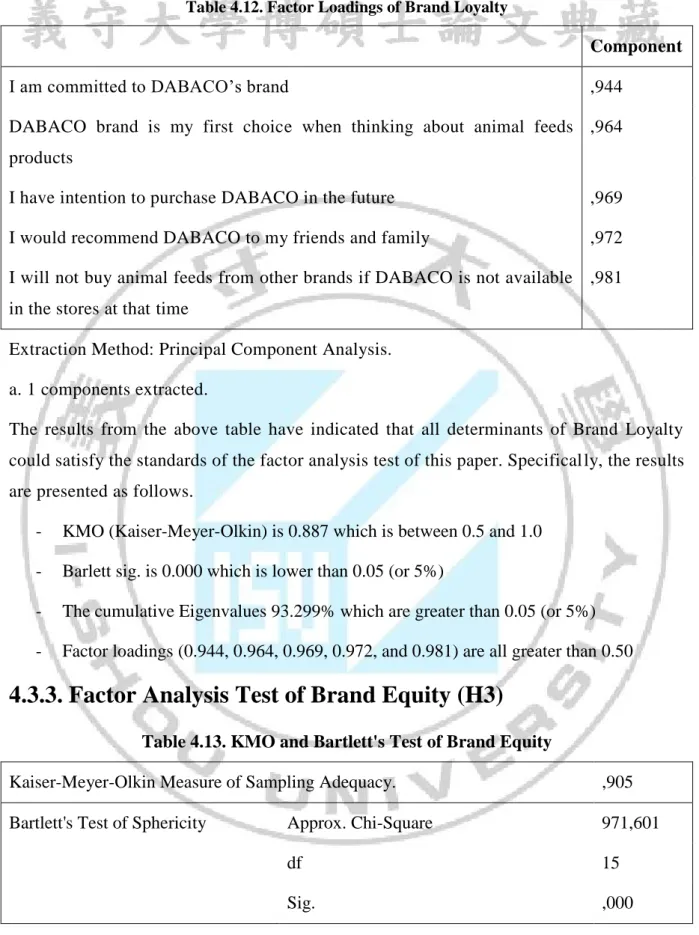
Table 4.12. Factor Loadings of Brand Loyalty
Component
I am committed to DABACO‟s brand ,944
DABACO brand is my first choice when thinking about animal feeds products
,964
I have intention to purchase DABACO in the future ,969
I would recommend DABACO to my friends and family ,972
I will not buy animal feeds from other brands if DABACO is not available in the stores at that time
,981
Extraction Method: Principal Component Analysis. a. 1 components extracted.
The results from the above table have indicated that all determinants of Brand Loyalty could satisfy the standards of the factor analysis test of this paper. Specifical ly, the results are presented as follows.
- KMO (Kaiser-Meyer-Olkin) is 0.887 which is between 0.5 and 1.0 - Barlett sig. is 0.000 which is lower than 0.05 (or 5%)
- The cumulative Eigenvalues 93.299% which are greater than 0.05 (or 5%) - Factor loadings (0.944, 0.964, 0.969, 0.972, and 0.981) are all greater than 0.50
4.3.3. Factor Analysis Test of Brand Equity (H3)
Table 4.13. KMO and Bartlett's Test of Brand Equity
Kaiser-Meyer-Olkin Measure of Sampling Adequacy. ,905
Bartlett's Test of Sphericity Approx. Chi-Square 971,601
df 15
Table 4.14. Total Variance Explained of Brand Equity
Component
Initial Eigenvalues Extraction Sums of Squared Loadings Total % of Variance Cumulative % Total % of Variance Cumulative % 1 5,412 90,196 90,196 5,412 90,196 90,196 2 ,225 3,757 93,952 3 ,148 2,459 96,411 4 ,131 2,191 98,602 5 ,047 ,786 99,388
Extraction Method: Principal Component Analysis.
Table 4.15. Factor Loadings of Brand Equity
Component
I have high preference for DABACO brand ,901
Products from DABACO are different from that of other brands ,946
DABACO brand makes me feel connected ,966
DABACO is a long-term brand ,947
The preference for DABACO brand encourages me to buy DABACO
products ,968
Extraction Method: Principal Component Analysis. a. 1 components extracted.
The results from the above table have indicated that all determinants of Brand Equity could satisfy the standards of the factor analysis test of this paper. Specifically, the results are presented as follows.
- KMO (Kaiser-Meyer-Olkin) is 0.873 which is between 0.5 and 1.0 - Barlett sig. is 0.000 which is lower than 0.05 (or 5%)
- The cumulative of variance is 84.304% which are bigger enough .
4.4. Descriptive Statistics of Brand Related Determinants
4.4.1. Descriptive Statistics of Brand Awareness (H1)
First of all, it is generally agreed that the level to which the customers could recognize the organization‟s products via the brand is significantly important indeed. In fact, the identification of brand affects the customers‟ buying behaviors strongly. There are six determinants of brand awareness which will be identified in the following sections.
I can quickly remember the logo of DABACO Company I can recognize DABACO Company among different brands I can recognize DABACO products‟ packages The recognition of DABACO brand encourages me to buy DABACO products The recognition of DABACO brand encourages me to think of DABACO products in my next purchasing N Valid 100 100 100 100 100 Missing 0 0 0 0 0 Mean 2,9200 3,1600 3,4000 2,7800 3,1400 Mode 4,00 3,00 4,00 3,00 3,00
As can be seen from the above table, the brand awareness of DABACO is relatively strong. Among the six determinants of this hypothesis, the products‟ packages of DABACO are the most recognizable patterns of DABACO‟s brand (with Mean =3.4, Mode= 4). Details of the descriptive analysis of DABACO‟s packages are presented in the following table.
Table 4.16. I can recognize DABACO products’ packages
Frequency Percent Valid Percent Cumulative Percent Valid Strongly disagree 6 6,0 6,0 6,0 Disagree 21 21,0 21,0 27,0 Neutral 18 18,0 18,0 45,0 Agree 37 37,0 37,0 82,0
Strongly
agree 18 18,0 18,0 100,0
Total 100 100,0 100,0
The packages of DABACO‟s products are designed in a standardized form which is excessively identifiable by the customers (agreed by 55% of the respondents). Each of the packages is printed with a large and eye-catching design. The products are the ones which directly associate with the customers and leaves strong impression on customers‟ minds. Only 27% of the customers do not find the products‟ packages of DABACO recognizable and 18% of them neither agree nor disagree with this statement.
The two next following satisfactory determinants of brand awareness of DABACO Company are the identification of DABACO in comparison with different brands and the motivating function of DABACO‟s brand in influencing the purchasing behaviors of the customers. Many customer agree that they could easily distinguish DABACO among different brands with Mean =3.16, Mode=3.
Table 4.17. I can recognize DABACO Company among different brands
Frequency Percent Valid Percent Cumulative Percent Valid Strongly disagree 8 8,0 8,0 8,0 Disagree 18 18,0 18,0 26,0 Neutral 33 33,0 33,0 59,0 Agree 32 32,0 32,0 91,0 Strongly agree 9 9,0 9,0 100,0 Total 100 100,0 100,0
As can be seen from the above table, a large proportion of the customers (account for 41% of the total sample population) agree that they can recognize DABACO Company among various brands in the market. Another 33% of the respondents, in the other hand, keep a neutral attitude toward the recognition of DABACO‟s brand among different other brands in the markets. Only 26% find DABACO Company not recognizable enough to be distinguished among numerous brands in the market.
Closely follow, the customers also agree that the recognition of DABACO‟s brand has strong impacts on encouraging them to think of DABACO products in their next purchasing (Mean=3.14, Mode=3). The high recognition from DABACO which is distinguishable from other brands could motivate customers to think about DABACO whenever they are in needs of animal feed products. As can be seen in the below table, the proportion between agreeing and disagreeing customers are relatively equal which is 29% and 20% respectively. Meanwhile, more than half of the respondents (account for 51% of the total sample size) mark a neutral response toward this statement.
Table 4.18. The recognition of DABACO brand encourages me to think of DABACO products in my next purchasing Frequency Percent Valid Percent Cumulative Percent Valid Strongly disagree 3 3,0 3,0 3,0 Disagree 17 17,0 17,0 20,0 Neutral 51 51,0 51,0 71,0 Agree 21 21,0 21,0 92,0 Strongly agree 8 8,0 8,0 100,0 Total 100 100,0 100,0
Nevertheless, it is noticeable that although customers could recognize DABACO‟s brand, it is not positive enough in order to encourage them to buy DABACO‟s products (Mean=2.78, Mode=3). Customers know about DABACO‟s brand but it is not strong enough to persuade them to buy and repeat their purchasing further. Furthermore, the logo of DABACO Company is proved to be not adequately recognizable (Mean=2.92, Mode=4). The logo is not presented in the eye-catching position in the products. Also, the logo‟s size is proved to be relatively small which not enough to draw the attention from the customers. Regarding the recognition of DABACO‟s logo, detailed descriptive analysis is presented in the following table.