Chapter 2 Background
2.1 About software visualization
Software visualization uses the technique of typography, graphic design, animation and cinematography with modern human-computer interaction and computer graphics technology to facilitate both the human understanding and effective use of computer software. Two broad categories of software visualization have been developed: algorithm visualization and program visualization. The relationship between the various types of software visualization and related fields are shown as Figure 1.
Figure 1 – The domain of software visualization.
animation, such as the early film Sort Out Sorting (SOS) of Baecker [8], Brown’s BALSA [9] and Zeus [10].
Program visualization is the visualization of actual program codes or data structures in either static or dynamic form. We prefer to differentiate program visualization form others topics within software visualization because it connotes a connection with program (lower-level) as opposed to the algorithm (higher-level).
Indeed, Myers’s taxonomies [11] refer two orthogonal dimensions of code vs. data and static vs. dynamic that still form a basis for our division of discipline. Static code visualization might include some kind of program map such as the SEE Program Visualizer [12], while an example of static data visualization might appear as a “boxes and arrows” diagram of a linked list data structure showing the contents. An example of an animated data visualization might show this same diagram with the arrows and contents changing dynamically as program was running, while a simple animated code visualization could highlight lines of code as they are being executed.
Visual Programming (VP) is the use of “visual” techniques to specify a program.
The main difference between Visual Program and Software Visualization is the goal involved: Visual Program seeks to make programs easier to specify by using a graphical notation while Software Visualization seeks to make programs and algorithms easier to understand using various techniques.
An area related to Visual Programming that also resembles Software Visualization is Programming by Demonstration (PbD). Programming by Demonstration is the specification of programs using user’s demonstrated examples.
The idea is that users may not need advanced programming skill to construct a program, but may be able to demonstrate an example and have the system infer a program. Thus, if users know how to perform a task on a computer, then that should be sufficient to create a program to perform the task. For example, they may show how some sample data is manipulated. This is usually accomplished using a graphical interface, which, as with Visual Programming, makes the result a kind of Software Visualization.
Other related field is Computer Visualization. Stasko and Wehrli [13] introduced the visualization including such aspects as hardware performance, sometimes called Performance Visualization. This kind of visualization is important in such things as load balancing or performance optimization on multiprocessor architectures.
2.2 The roles act in software visualization system
There are many different roles acting in software visualization systems. There is usually a programmer who writes the original program or algorithm. Programmers may not know that their programs will be visualized when they write them. And there is a software visualization software developer who writes the software that allows programs or algorithms to be visualized and specifies how the visualization is to be connected or applied to program. Finally, the person is users or viewers, who may view the visualization statically, or interact and browse it.
2.3 A framework for classifying software visualization systems
There are six categories for this framework including scope, context, form, method, interaction and effectiveness shown as in Figure 2.
The original programmer writes the programs or algorithms that may or may not be able to be visualized according to the scope category. The software visualization developer produces a system with certain capabilities which determine what aspects of program can be shown, thus the second category: context, and specifies the visualization resulting in method category. The output of the software visualization systems takes some kind of form and the user has some kind of interaction with it.
Finally, the whole visualization will have some degree of effectiveness in helping the user understand the program or algorithm. Below sections we will discuss the six categories in detail.
2.3.1 Scope
Scope means the range of programs that the software visualization system can take input for visualization. There are two major divisions of scope information:
generality and scalability. We show a complete tree of the sub-categories as Figure 3.
Figure 2 – The first level of the software visualization taxonomy hierarchy.
Figure 3 – Scope category hierarchy.
Generality means a system can generate visualization of arbitrary programs within a particular class or a fixed set of examples. A generalized system usually has some restrictions governing it capabilities:
Hardware: What hardware does it run in?
Operating System: What operating system is required to run it?
Language: What programming language must users’ programs be written in?
Concurrency: If the programming language is capable of concurrency, can the software visualization system visualize the concurrent aspects?
Application: What are the restrictions on the kinds of users’ programs that can be visualized?
Specialty: What kinds of programs is it particularly good at visualizing?
Scalability means the degree that a system can handle. Scalability includes combination of:
Program: What is the largest program it can handle?
Data Sets: What is the largest input data it can handle?
2.3.2 Context
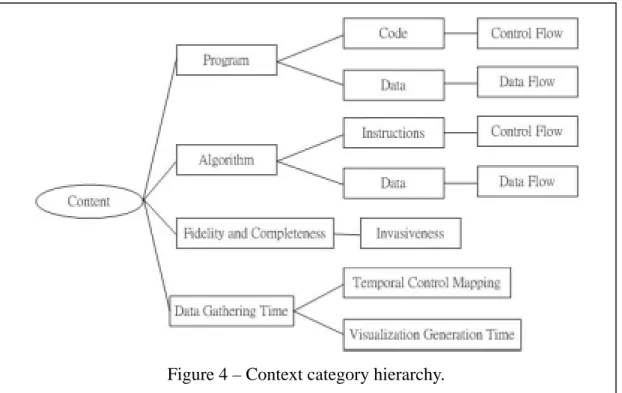
Context means what subset of information about the software is visualized by the software visualization system. We show a complete tree of the sub-categories as Figure 4. Two of the most important parts of this information are the program, by which we mean the source code, and algorithm of software. The difference between program and algorithm depend on the design purpose. If the system is designed for educate users about a general algorithm, it falls into the class of algorithm visualization. However if the system is designed for helping users to implement an algorithm, it is more likely program visualization.
Program means what degree the system visualizes the actual implemented program. This category is further subdivided as follow:
Code: To what degree does the system visualize the instructions in the program source code? Control Flow: To what degree does the system visualize the flow control in the program source code?
Data: To what degree does the system visualize the data structure in the program source code? Data Flow: To what degree does the system visualize the flow of data in the program source code?
Algorithm means what degree the system visualizes the high-level algorithm behind the software. This category is further subdivided as follow:
Instructions: To what degree does the system visualize the instructions in the algorithm? Control Flow: To what degree does the system visualize the flow control of the algorithm instructions?
Data: To what degree does the system visualize the high-level data structures in the algorithm? Data Flow: To what degree does the system visualize the flow of data in the algorithm?
Figure 4 – Context category hierarchy.
The other two important parts of this category are fidelity and completeness, which characterize the accuracy of this visualization, and data gathering time, which describes the point where information about the software is gathered. Fidelity and completeness means the metaphors present the true and complete behavior of the underlying virtual software. This category is further subdivided as follow:
Invasiveness: If the system can be used to visualize concurrent application, does its use disrupt the execution sequence of the program?
Data gathering time means the data on which the visualization depends gathered.
The data may gather in compile-time or run-time. This category is further subdivided as follow:
Temporal Control Mapping: What is mapping between “program time” and
“visualization time”?
Visualization Generation Time: Is the visualization produced as a batch job from data recorded during a previous run, or is it produced live as the program executes?
2.3.3 Form
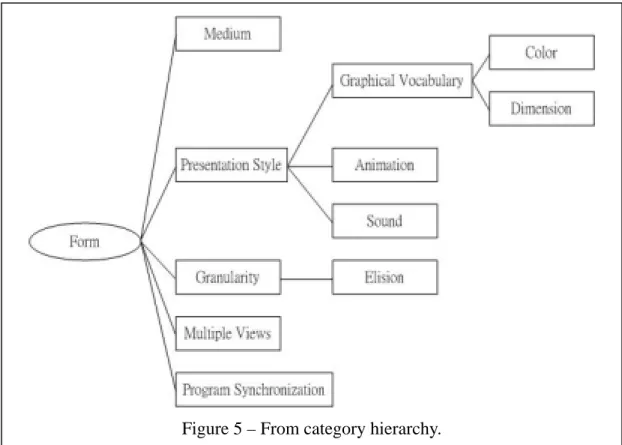
Form means the characteristics of the output of the visualization system. This is concerned with how the characteristics of the system are directly related to what can be displayed. We show a complete tree of the sub-categories as Figure 5.
Medium means the primary target medium for the visualization system.
Common choices include paper, film or videotape, or graphical computer. Virtual reality environment are expected to become a common target medium for software visualization system.
Presentation style means the general appearance of the visualization. This category is further subdivided as follow:
Graphical Vocabulary: What graphical elements are used in the visualization produced by the system? It provides some mental model for user to make them easily to understand the software.
Color: What kind of color does the system make its visualization meaningful?
Dimension: What degree are extra dimensions used in the visualization?
Traditional systems have used simple tw0-dimensional graphics, but recent systems tend to three-dimension.
Animation: If the system gathers run-time data, what degree does the resulting visualization use animation? The most obvious and frequent use of animation in program visualization systems is to capture and convey the temporal aspects of software in execution.
Sound: The system use some kind of sound to convey information.
Figure 5 – From category hierarchy.
Granularity means users can select coarse-grained or fine-detail visualization data. This category is further subdivided as follow:
Elision: Does the system provide facilities for eliding information? When dealing with large amounts of information, it is an important feature. Users can elide or hide some information that they are not interest.
Multiple Views might include simultaneous coarse-grained and fine-detail views of data structure, or a graphical view of changing program data with a corresponding view of execution source code.
Program Synchronization is useful for comparing the execution speed of two programs, for determining how one algorithm differs from another similar algorithm, and for investigating how a particular algorithm is flawed with respect to a correct algorithm.
2.3.4 Method
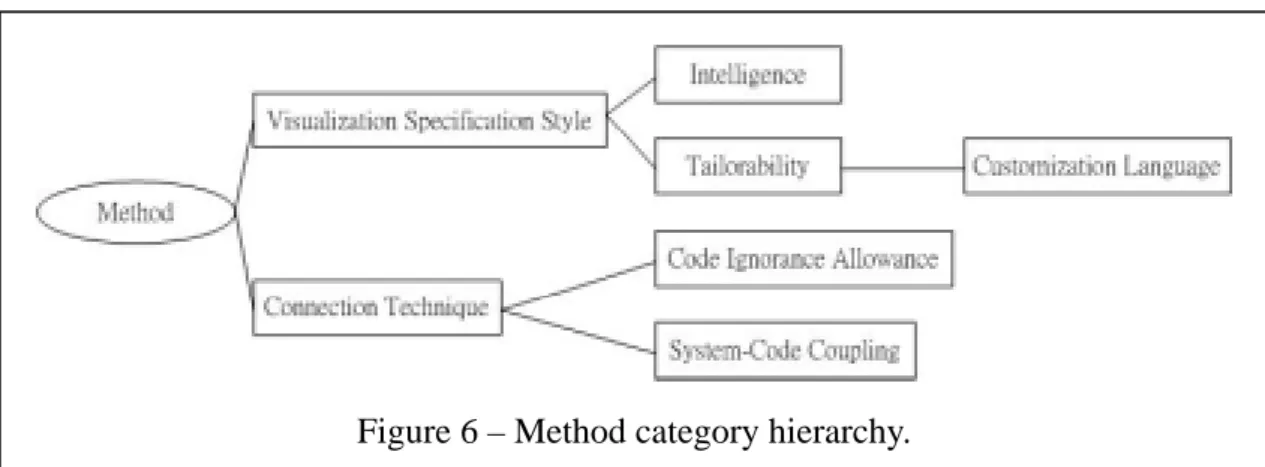
Method means how the software visualization developer creates the visualization for users. We show a complete tree of the sub-categories as Figure 6.
Visualization Specification Style means the style of visualization specification is used. It can be completely fixed or they can be built a library or hierarchy of existing visualizations. Fixed system can not change when users use it. The display from has been written when the visualization software is developed, opposite another
Figure 6 – Method category hierarchy.
software from an AI point of view? Is the automatic view the users want?
Tailor ability: How can the user customize their own visualization?
Customization Language: If the visualization is customizable, how can the visualization be specified? It describes the way that the system can accept customization instruction from user. Systems support interactive manipulation for users and the visualization depends on the users’
interactive manipulation.
Connection Technique means how the connection made between the visualization and the actual software. Some systems need to add statements to print the visualization commands at the interesting event. Some systems provide a special editor to annotate the program, but the original source code is still unchanged. And some of them automatically annotate by a pre-processor before it is compiled. But above ways are invasive and may be dangerous from a software point of view. So non-invasive solutions are expected. It is a non-invasive solution to attach a probe to data structures or code in a declarative manner so the structure can be monitored without affecting the source code at all. Another way is get the information from the bus or another part of hardware and show the information without affecting the source code. This category is further subdivided as follow:
Code Ignorance Allowance: If the visualization system is not completely automatic, how much knowledge of the program code is required for a visualization to be produced? All of the automatic systems have a high code ignorance allowance since they can produce visualization without any code
knowledge on the part of software visualization developer.
System-Code Coupling: How tightly is the visualization system coupled with the code? It is a measure of how closely software visualization system is tied to the program when it is visualizing.
2.3.5 Interaction
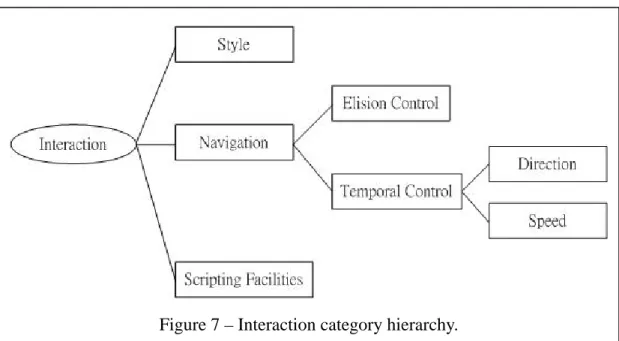
Interaction means how users interact with or control with the software visualization system. We show a complete tree of the sub-categories as Figure 7.
Style means what method the user employs to give instruction to the system.
Example include on-screen buttons, menus or command line statements. The most common style of interaction is buttons and menu in the window-based programs.
Navigation means the system support navigation through the visualization. When visualizing large programs or data sets, it is very important for users. This category is further subdivided as follow:
Elision Control: Can the user elide information or suppress detail from display?
It is useful for information culling, the removal of excess information which is not relevant to the user’s line of inquiry and which severs only to clutter the display.
Figure 7 – Interaction category hierarchy.
Speed: Can the user control the speed of execution? Users can make the program stop and start as well as faster or slower.
Scripting Facilities means the system provides facilities for managing the recording and playing back of interactions with particular visualization. In other words, a user can run it like videotape again and again.
2.3.6 Effectiveness
This is highly subjective measure and may be made up of many factors. The effectiveness depends on the purpose of the software visualization system. Purpose means what purpose is the system suited. It is hard to design a software visualization system for general purpose. The system may be designed for data, algorithm, teaching or debugging. For example, for teaching will emphasize what the algorithm is going on and ignore the real data works. Oppositely, for debugging will emphasize the data flow and ignore the algorithm. Different purpose will make the system to be designed in different ways.