CHAPTER FOUR RESULTS AND DISCUSSION
In this chapter, the results of this study are presented and discussed according to the five research questions. First, the participants’ mastery of strategies measured by the vocabulary learning strategy questionnaire (VLSQ) is analyzed by descriptive statistics. Then, the top five strategies mastered the most and the least well are identified. Second, the results concerning the differences between the experimental group and control group in their mastery of the six kinds of instructed strategies are tested by two-way ANOVA repeated measures. Third, the performances of the experimental and control groups in the vocabulary pretest, immediate posttest, and delayed posttest (VTs) are analyzed through two-way ANOVA repeated measures.
Fourth, two-way ANOVA repeated measures are performed to analyze the differences between the experimental and control groups in vocabulary learning motivation.
Finally, the students’ responses to the open-ended questions in the vocabulary learning strategy instruction questionnaire (VLSIQ) and in the interview are analyzed in a qualitative way. The participants’ responses to the questions in the second part of the VLSIQ are analyzed by descriptive statistics.
The Participants’ Mastery of Strategies
In order to see the overall patterns of vocabulary learning strategy use by all the students as a group and by each of the two groups (experimental vs. control groups), their responses to the vocabulary learning strategy questionnaire (VLSQ) before (T1), immediately after (T2) and four weeks (T3) after the instruction were analyzed by descriptive statistics (e.g., mean, standard deviation, etc.). In this section, the participants’ mastery of overall strategies (N = 50) by all the students as a group and by each of the two groups is discussed first. Then the five strategies mastered the most
well are demonstrated and examined. Finally, the five strategies mastered the least well by each of the two groups are identified and compared.
Mastery of Overall Strategy Use
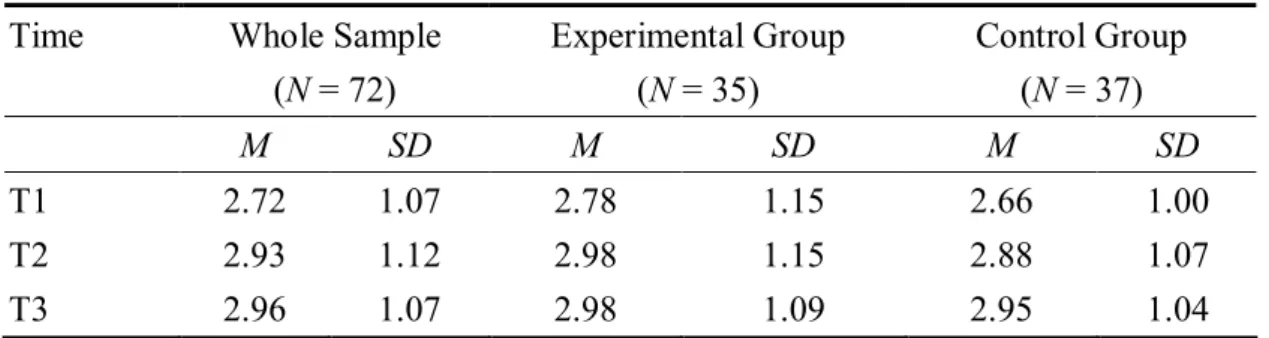
The overall mean scores of all the participants’ use of vocabulary learning strategies, as shown in Table 8, were 2.72 before, 2.93 immediately after and 2.96 four weeks after the instruction. This result suggests the participants were medium users of vocabulary learning strategies. They did not use vocabulary learning strategies with enough mastery though they made slight progress one semester later.
As for the strategy use by each of the two groups, the participants in the experimental group (means = 2.78 in T1, 2.98 in T2, and 2.98 in T3) and those in the control group (means = 2.66 in T1, 2.88 in T2, and 2.95 in T3) showed a similar trend of increased, though slight, mastery of strategies. It seems that the instruction of six types of vocabulary learning strategies did not substantially increase the experimental group’s mastery over the overall strategy use. This finding contradicts Chou’s (2006) study of effects of language learning strategy instruction on vocational senior high school students. After the strategy-integrated instruction, Chou’s participants in the experimental group significantly increased the frequency of their overall strategy use.
One reason why the experimental group in the present study did not improve substantially in strategy mastery may be that after twelve-week instruction of six kinds of vocabulary learning strategies, the experimental group still could not extend themselves beyond their “stylistic comfort zone” (Oxford, 2003) to employ a variety of strategies in learning vocabulary. Another reason may be that they thought the six kinds of instructed strategies were helpful enough for them to learn vocabulary. More interestingly, the control group also increased their mastery of overall strategies steadily from 2.66 and 2.88 to 2.95 throughout the study. This might be due to the fact
that the large amount of vocabulary encountered in a senior high school required them to employ the strategies to aid vocabulary learning on their own despite lack of vocabulary learning strategy instruction (VLSI).
Table 8. Mastery of Overall Strategy Use by Group
Time Whole Sample
(N = 72)
Experimental Group (N = 35)
Control Group (N = 37)
M SD M SD M SD
T1 2.72 1.07 2.78 1.15 2.66 1.00
T2 2.93 1.12 2.98 1.15 2.88 1.07
T3 2.96 1.07 2.98 1.09 2.95 1.04
Note. T1 = pretest; T2 = immediate posttest; T3 = delayed posttest.
N = number of participants. M = mean. SD = standard deviation.
Top Five Vocabulary Learning Strategies Mastered
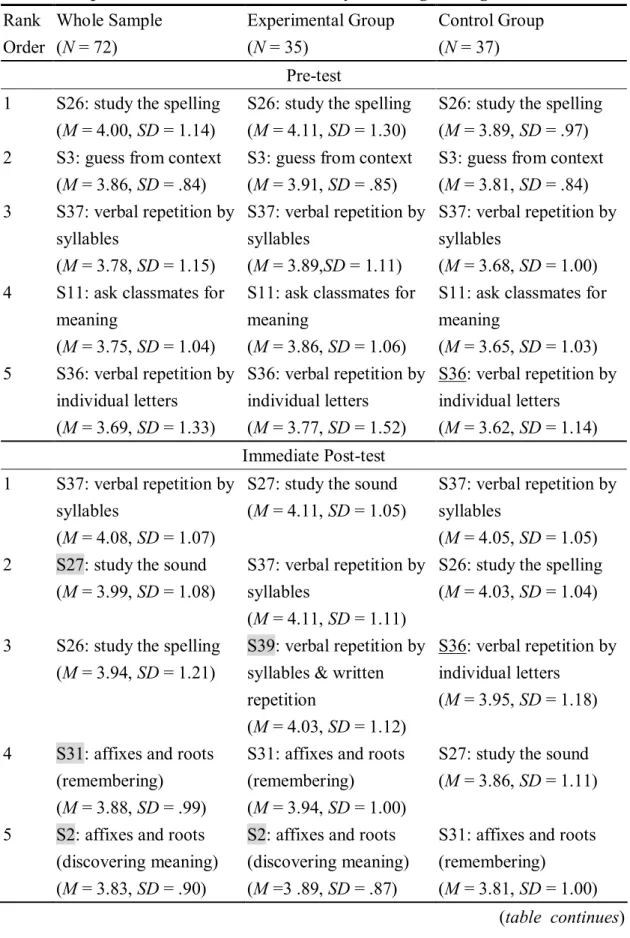
The top five strategies mastered by the participants out of the fifty strategies were ranked in descending order according to the mean scores of mastery. As Table 9 shows, before the instruction, a general tendency was found for the experimental group and the control group. The five strategies mastered the most by all the participants as a group, and by each of the experimental group and the control group were the same. Strategy Item 26 “study the spelling of a word” (Mtotal = 4 ; Mexperimental
= 4.11 ; Mcontrol = 3.89) ranked first; Strategy Item 3 “guess from textual context”
(Mtotal = 3.86 ; Mexperimental = 3.91 ; Mcontrol = 3.81) ranked second; Strategy Item 37
“verbal repetition by syllables” (Mtotal = 3.78 ; Mexperimental = 3.89 ; Mcontrol = 3.68) ranked third; Strategy Item 11 “ask classmates for meaning” (Mtotal = 3.75 ; Mexperimental = 3.86 ; Mcontrol = 3.65) ranked fourth; Strategy Item 36 “verbal repetition by individual letters” (Mtotal = 3.69 ; Mexperimental = 3.77 ; Mcontrol = 3.62) ranked fifth.
Table 9. Top Five Most Mastered Vocabulary Learning Strategies Rank
Order
Whole Sample (N = 72)
Experimental Group (N = 35)
Control Group (N = 37) Pre-test
1 S26: study the spelling (M = 4.00, SD = 1.14)
S26: study the spelling (M = 4.11, SD = 1.30)
S26: study the spelling (M = 3.89, SD = .97) 2 S3: guess from context
(M = 3.86, SD = .84)
S3: guess from context (M = 3.91, SD = .85)
S3: guess from context (M = 3.81, SD = .84) 3 S37: verbal repetition by
syllables
(M = 3.78, SD = 1.15)
S37: verbal repetition by syllables
(M = 3.89,SD = 1.11)
S37: verbal repetition by syllables
(M = 3.68, SD = 1.00) 4 S11: ask classmates for
meaning
(M = 3.75, SD = 1.04)
S11: ask classmates for meaning
(M = 3.86, SD = 1.06)
S11: ask classmates for meaning
(M = 3.65, SD = 1.03) 5 S36: verbal repetition by
individual letters (M = 3.69, SD = 1.33)
S36: verbal repetition by individual letters
(M = 3.77, SD = 1.52)
S36: verbal repetition by individual letters
(M = 3.62, SD = 1.14) Immediate Post-test
1 S37: verbal repetition by syllables
(M = 4.08, SD = 1.07)
S27: study the sound (M = 4.11, SD = 1.05)
S37: verbal repetition by syllables
(M = 4.05, SD = 1.05) 2 S27: study the sound
(M = 3.99, SD = 1.08)
S37: verbal repetition by syllables
(M = 4.11, SD = 1.11)
S26: study the spelling (M = 4.03, SD = 1.04)
3 S26: study the spelling (M = 3.94, SD = 1.21)
S39: verbal repetition by syllables & written repetition
(M = 4.03, SD = 1.12)
S36: verbal repetition by individual letters
(M = 3.95, SD = 1.18)
4 S31: affixes and roots (remembering) (M = 3.88, SD = .99)
S31: affixes and roots (remembering)
(M = 3.94, SD = 1.00)
S27: study the sound (M = 3.86, SD = 1.11)
5 S2: affixes and roots (discovering meaning) (M = 3.83, SD = .90)
S2: affixes and roots (discovering meaning) (M =3 .89, SD = .87)
S31: affixes and roots (remembering)
(M = 3.81, SD = 1.00) (table continues)
Table 9. Top Five Most Mastered Vocabulary Learning Strategies (continued) Rank
Order
Whole Sample (N = 72)
Experimental Group (N = 35)
Control Group (N = 37) Delayed Post-test
1 S27: study the sound (M = 3.88, SD = 1.05)
S2: affixes and roots (discovering meaning) (M = 3.94, SD = .73)
S37: verbal repetition by syllables
(M = 3.97, SD = 1.12) 2 S37: verbal repetition by
syllables
(M = 3.88, SD = 1.10)
S27: study the sound (M = 3.91, SD = 1.07)
S27: study the sound (M = 3.84, SD = 1.04)
3 S31: affixes and roots (remembering)
(M = 3.82, SD = 1.00)
S11: ask classmates for meaning
(M = 3.83, SD = .92)
S31: affixes and roots (remembering)
(M = 3.84, SD = 1.07) 4 S2: affixes and roots
(discovering meaning) (M = 3.76, SD = .76)
S31: affixes and roots (remembering) (M = 3.80, SD = .93)
S26: study the spelling (M = 3.73, SD = 1.10)
5 S26: study the spelling (M = 3.72, SD = 1.21)
S37: verbal repetition by syllables
(M = 3.71, SD = 1.09)
S36: verbal repetition by individual letters
(M = 3.68, SD = 1.40) Note. S = a vocabulary learning strategy item listed in the VLSQ.
Immediately after the instruction, some changes occurred in strategy mastery.
For all the participants as a group, Strategy Item 27 “study the sound of a word,”
Strategy Item 31 “use affixes and roots to remember words” and Strategy Item 2 “use affixes and roots to discover the meaning” were included in the list of the top five mastered strategies in place of Strategy Item 3 “guess from textual context,” Strategy Item 36 “verbal repetition by individual letters,” and Strategy Item 11 “ask classmates for meaning.” The mastery of “study the sound of a word” may be due to the fact that both groups were often asked to say the word aloud in class. The reason why the strategies involving using word parts were mastered well may be that that derivational words were provided in the vocabulary section of the English textbook (i.e., providing
competitive, competitively, competition while the word compete was presented). As
for the experimental group, after the instruction, the participants dramatically changed their ranking of top five mastered strategies. Except Strategy Item 37 “verbal repetition by syllables,” the remaining four strategies included in the pre-instruction mastery list were replaced with Strategy Item 27 “study the sound of a word,”
Strategy Item 39 “verbal repetition by syllables and written repetition at the same time,” Strategy Item 31 “use affixes and roots to remember words” and Strategy Item 2 “use affixes and roots to discover the meaning.” Compared to the experimental group, the control group changed only a little in the list. Strategy Item 27 “study the sound of a word” and Strategy Item 31 “use affixes and roots to remember words”
were included in the top five list in place of Strategy Item 3 “guess from textual context” and Strategy Item 11 “ask classmates for meaning.”
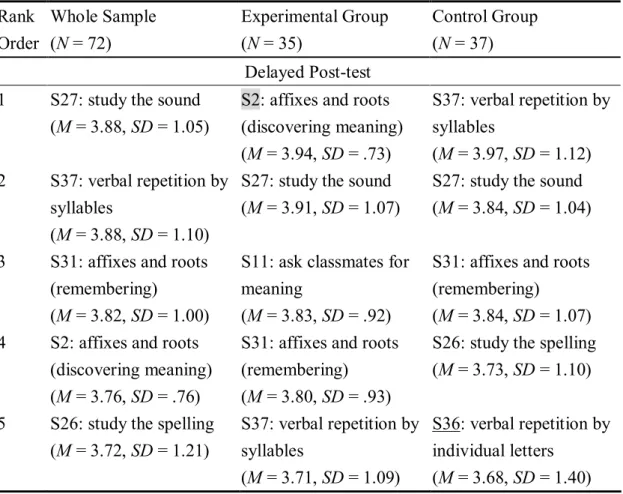
Four weeks after the instruction, the top five mastered strategies by all the participants as a group, the experimental group, and the control group were almost the same as those in the immediate posttest list but with different rankings. Some differences lay between the experimental and control groups. The control group included in their delayed posttest list the same five strategies in their immediate posttest list while the experimental group included Strategy Item 11 “ask classmates for meaning” in place of Strategy Item 39 “verbal repetition by syllables and written repetition at the same time.” Moreover, the experimental group ranked Strategy Item 2 “use affixes and roots to discover the meaning” first while the control group did not include “use affixes and roots to discover the meaning” in their top five list at all.
Based on the results shown in Table 9, two general patterns could be found throughout the study. First, the strategies mastered the best by all the participants seemed to involve “rote learning” (verbal and written repetition) and the form (spelling/sound) of a word. This finding was in line with Yeh and Wang’s (2004). The
participants’ preference for repetition strategies also echoed with the Japanese EFL learners in Schmitt’s (1997) study and the Taiwanese EFL learners in Chen’s (1998) study. This phenomenon could be related to students’ L1 learning. In Taiwan, students have been instructed to use written and verbal repetition to memorize Chinese characters beginning in elementary schools. The repetition strategy may be transferred to English vocabulary learning. Second, all the participants were better able to use affixes and roots to memorize words. This may be accounted for by the way vocabulary is presented in their English textbook and the test items on their exams. The English textbooks in senior high school, unlike those in junior high school, offered a group of derivational words in the vocabulary section (for example, offering competitive and competition after the new word compete). When taking an English
monthly exam or a vocabulary weekly quiz, the participants were often required to spell out a derivational word with a base word provided (for example, spelling out competition while compete is prompted).
However, two great differences existed in the mastery of strategy items between the experimental group and the control group. The first difference was detected in use of verbal repetition by individual letters. From the beginning to the end of the study, the control group included Strategy Item 36 “verbal repetition by individual letters” in the top five list while the experimental group dropped it out of the list immediately after VLSI. This may be due to the instruction of phonological analysis, which might arouse the students’ awareness to view English words as a combination of sounds or syllables rather than a group of individual letters (Huang et al., 2004). The other discrepancy was the use of affixes and roots to discover meanings. It seems that the instruction of word-part analysis enabled the experimental group to employ this strategy with more mastery to figure out the meaning of a word. To sum up, VLSI can help learners process the form and the sound of a word with more mastery and
according to the researcher’s observation, with greater accuracy.
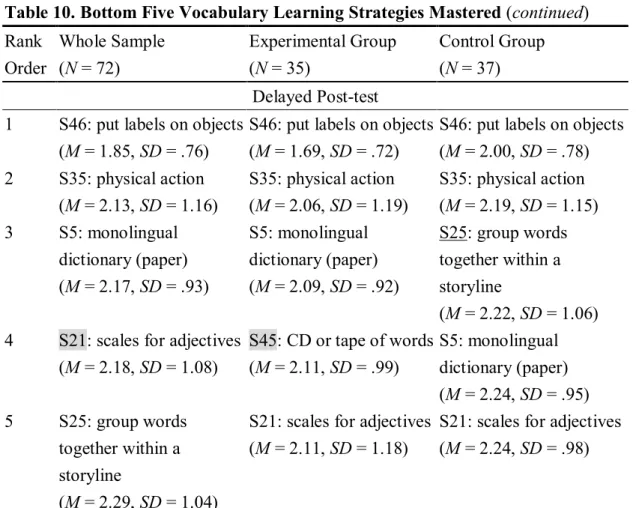
Bottom Five Vocabulary Learning Strategies Mastered
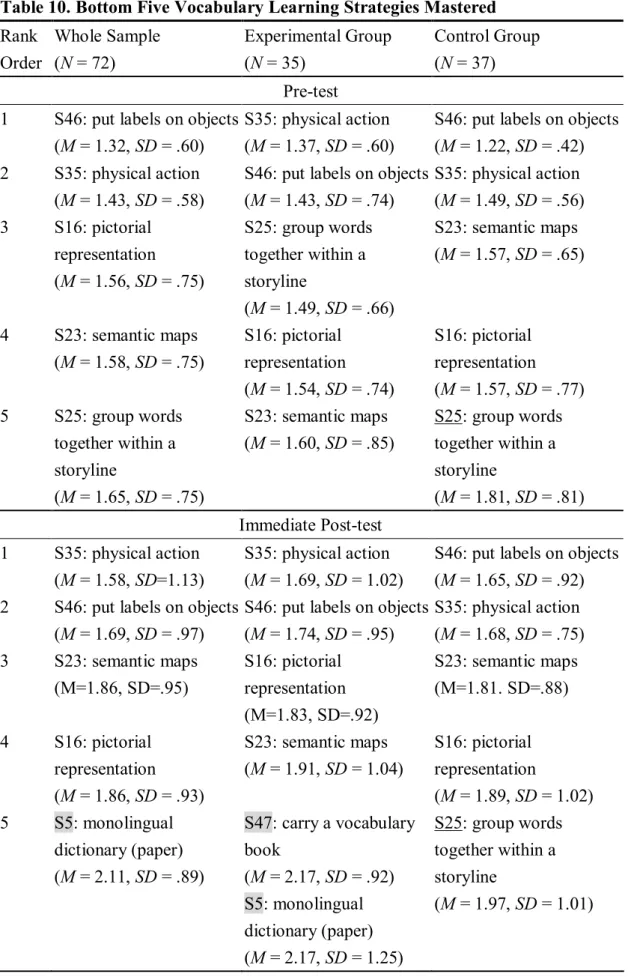
As shown in Table 10, before the study, for all the participants as a group, and for each of the two groups, the five vocabulary learning strategies mastered the least well were Strategy Item 46 “put English labels on physical objects,” Strategy Item 35
“use physical action to remember a word,” Strategy Item 16 “study a word with a pictorial representation of its meaning,” Strategy Item 23 “use semantic maps,” and Strategy Item 25 “group words together within a storyline.” Immediately after the instruction, Strategy Item 5 “use monolingual dictionary” was included in the list by all the participants; Strategy Item 5 “use monolingual dictionary” and Strategy Item 47 “carry a vocabulary book to memorize words” were included by the experimental group in place of Strategy 25 “group words together within a storyline.” As for the control group’s mastery of strategies in the immediate posttest, the five vocabulary learning strategies mastered the least well remained the same as those in the pretest.
Four weeks after the instruction, Strategy Item 21 “use scales for gradable adjectives”
was included by all the participants in the list in place of Strategy item 16 “study a word with a pictorial representation of its meaning.” Strategy Item 45 “listen to CDs or tapes of words” was included by the experimental group in place of Strategy Item 23 “use semantic maps” and Strategy Item 47 “carry a vocabulary book”; Strategy Item 5 “use monolingual dictionary,” and Strategy Item 21 “use scales for gradable adjectives” were included by the control group in place of Strategy item 16 “study a word with a pictorial representation of its meaning” and Strategy item 23 “use semantic maps.”
Table 10. Bottom Five Vocabulary Learning Strategies Mastered Rank
Order
Whole Sample (N = 72)
Experimental Group (N = 35)
Control Group (N = 37) Pre-test
1 S46: put labels on objects (M = 1.32, SD = .60)
S35: physical action (M = 1.37, SD = .60)
S46: put labels on objects (M = 1.22, SD = .42) 2 S35: physical action
(M = 1.43, SD = .58)
S46: put labels on objects (M = 1.43, SD = .74)
S35: physical action (M = 1.49, SD = .56) 3 S16: pictorial
representation (M = 1.56, SD = .75)
S25: group words together within a storyline
(M = 1.49, SD = .66)
S23: semantic maps (M = 1.57, SD = .65)
4 S23: semantic maps (M = 1.58, SD = .75)
S16: pictorial representation (M = 1.54, SD = .74)
S16: pictorial representation (M = 1.57, SD = .77) 5 S25: group words
together within a storyline
(M = 1.65, SD = .75)
S23: semantic maps (M = 1.60, SD = .85)
S25: group words together within a storyline
(M = 1.81, SD = .81) Immediate Post-test
1 S35: physical action (M = 1.58, SD=1.13)
S35: physical action (M = 1.69, SD = 1.02)
S46: put labels on objects (M = 1.65, SD = .92) 2 S46: put labels on objects
(M = 1.69, SD = .97)
S46: put labels on objects (M = 1.74, SD = .95)
S35: physical action (M = 1.68, SD = .75) 3 S23: semantic maps
(M=1.86, SD=.95)
S16: pictorial representation (M=1.83, SD=.92)
S23: semantic maps (M=1.81. SD=.88)
4 S16: pictorial representation (M = 1.86, SD = .93)
S23: semantic maps (M = 1.91, SD = 1.04)
S16: pictorial representation
(M = 1.89, SD = 1.02) 5 S5: monolingual
dictionary (paper) (M = 2.11, SD = .89)
S47: carry a vocabulary book
(M = 2.17, SD = .92) S5: monolingual dictionary (paper) (M = 2.17, SD = 1.25)
S25: group words together within a storyline
(M = 1.97, SD = 1.01)
(table continues)
Table 10. Bottom Five Vocabulary Learning Strategies Mastered (continued) Rank
Order
Whole Sample (N = 72)
Experimental Group (N = 35)
Control Group (N = 37) Delayed Post-test
1 S46: put labels on objects (M = 1.85, SD = .76)
S46: put labels on objects (M = 1.69, SD = .72)
S46: put labels on objects (M = 2.00, SD = .78) 2 S35: physical action
(M = 2.13, SD = 1.16)
S35: physical action (M = 2.06, SD = 1.19)
S35: physical action (M = 2.19, SD = 1.15) 3 S5: monolingual
dictionary (paper) (M = 2.17, SD = .93)
S5: monolingual dictionary (paper) (M = 2.09, SD = .92)
S25: group words together within a storyline
(M = 2.22, SD = 1.06) 4 S21: scales for adjectives
(M = 2.18, SD = 1.08)
S45: CD or tape of words (M = 2.11, SD = .99)
S5: monolingual dictionary (paper) (M = 2.24, SD = .95) 5 S25: group words
together within a storyline
(M = 2.29, SD = 1.04)
S21: scales for adjectives (M = 2.11, SD = 1.18)
S21: scales for adjectives (M = 2.24, SD = .98)
Note. S = a vocabulary learning strategy item listed in the VLSQ.
The strategies reported to be mastered the least well were found to share the following characteristics. First, it seems that the strategies involving study aids were not mastered very well by the participants in the present study. For example, visual aids (e.g., labels, pictures, and vocabulary books), auditory aids (e.g., CDs and tapes), and physical aids (e.g., physical action) were reported to be adopted with less mastery.
These study aids, in fact, can make words more perceptible, and help learners remember vocabulary; yet they may have been considered so troublesome that the participants in this study seldom used them. Surprisingly, even with instruction of how to keep vocabulary books and cards, the experimental group failed to master Strategy Item 47 “carry vocabulary books” well. According to their responses toward VLSI in the questionnaires and in the interview, one explanation is that their laziness
hindered them from carrying vocabulary books though they were aware that vocabulary learning requires repetitive exposures. Another study aid the participants did not master well was use of a monolingual dictionary. One possible explanation may be that consultation of a monolingual dictionary requires ability to read and understand English explanations. The participants in the present study may not have enough ability to do this yet. Therefore, they felt more secure when looking up words in a dictionary with L1/Chinese definitions. The findings about the participants’ lack of mastery in use of study aids are in agreement with Yeh and Wang’s study (2004).
Second, the strategies involving deeper mental processing seemed to be mastered the least well. They are “semantic maps,” “grouping words together within a story line,”
and “scales for gradable adjectives.” These strategies belong to memory strategies that
“relate new material to existing knowledge” on Schmitt’s taxonomy. The reason why these memory strategies were mastered the least well may be that they are more difficult than rote learning to employ and need specified training. Take the strategy
“group words together within a storyline” for example. After VLSI, the experimental group excluded it from the mastered-least-well list while the control group included this strategy in the list throughout the study. This finding suggests once students are taught how to employ a certain strategy involving deeper processing, they may gradually acquire mastery over it.
To sum up, as shown in participants’ use of overall strategies, VLSI does not appear to be effective in greatly increasing the mastery of overall strategy use. But the list of the strategies mastered the most and the least well demonstrates the advantage of VLSI over traditional vocabulary instruction in using phonological analysis to study the sound and word-part analysis to learn and discover the meaning of a word.
However, more VLSI on deeper memory strategies that create mental linkages is needed because the strategies promoting deeper mental process, such as grouping,
association, using imagery, and keywords, can enhance the retention of target words (Cohen & Aphek, 1981; Ellis, 1997; Oxford, 1990), but the participants of this study did not master well.
Differences Between the Experimental Group and Control Group in Mastery of the Instructed Vocabulary Learning Strategies
In this section, with a view to examining the effectiveness of VLSI on the instructed strategies, the summed mastery scores of fifteen items (see Table 4) on the VLSQ corresponding to the six types of vocabulary learning strategies taught to the experimental group were analyzed.
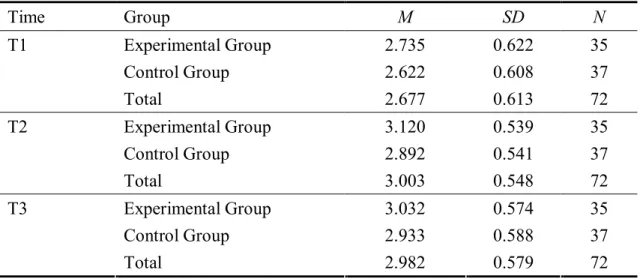
Table 11. Descriptive Statistics of Mastery over the Instructed Strategies
Time Group M SD N
Experimental Group 2.735 0.622 35
Control Group 2.622 0.608 37
T1
Total 2.677 0.613 72
Experimental Group 3.120 0.539 35
Control Group 2.892 0.541 37
T2
Total 3.003 0.548 72
Experimental Group 3.032 0.574 35
Control Group 2.933 0.588 37
T3
Total 2.982 0.579 72
Note. T1 = pretest; T2 = immediate posttest; T3 = delayed posttest.
Table 11 shows descriptive statistics of mastery over the instructed strategies.
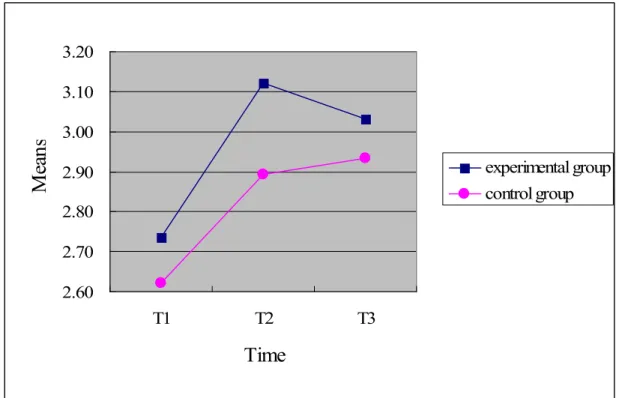
The mean scores of mastery over the instructed strategies for the experimental group in three tests were 2.735, 3.120, and 3.032, and for the control group were 2.622, 2.892, and 2.933. The experimental group increased mastery over the instructed strategies in T2, but suffered from a slight loss of mastery in T3, whereas surprisingly, the control group steadily gained more mastery over the instructed strategies
throughout the study.
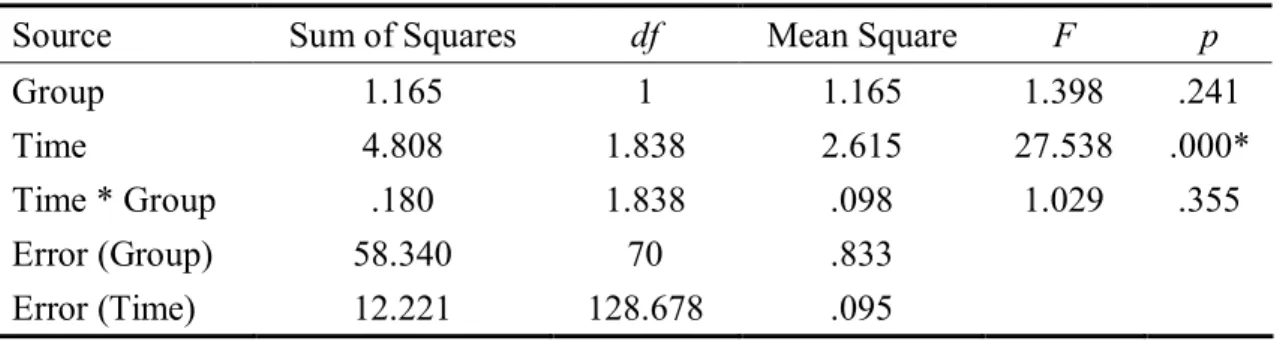
Table 12. Summary of Two-way ANOVA on Mastery of Instructed Strategies
Source Sum of Squares df Mean Square F p
Group 1.165 1 1.165 1.398 .241
Time 4.808 1.838 2.615 27.538 .000*
Time * Group .180 1.838 .098 1.029 .355
Error (Group) 58.340 70 .833
Error (Time) 12.221 128.678 .095
Note. * p < .05.
In order to test for time, group, and time by group effects on mastery over the instructed strategies, data were further submitted to a repeated-measures analysis of variance (ANOVA) using a two between-subjects, three within-subjects factorial design on the summed mastery scores. The between-subject factor was group (experimental group vs. control group), whereas the within-subject factor was time (T1 vs. T2 vs. T3). Results are shown in Table 12. No significant group effects were found, F = 1.398, p = .241.
Table 13. Post Hoc Comparisons for Time Effect on Mastery Over Instructed Strategies
I (Time) J (Time) MD (I-J) Std. Error p
T2 (M = 3.006) T1 (M = 2.678) .328* .051 .000
T3 (M = 2.983) T2 (M = 3.006) -.023 .042 .580
T3 (M = 2.983) T1 (M = 2.678) .304* .054 .000
Note. T1 = pretest; T2 = immediate posttest; T3 = delayed posttest.
MD = mean difference.
* p < .05.
However, there was a significant Time effect, F = 27.538, p = .000. Post hoc pairwise comparisons of estimated marginal means further showed that a significant change existed between the pretest and the immediate posttest, and between the
pretest and the delayed posttest in favor of posttests. But no significant changes occurred between the immediate posttest and the delayed posttest (see Table 13). This finding means after the study all the participants significantly increased mastery of the six types of strategies, and no significant decline in mastery was found between the immediate posttest and the four-week delayed posttest.
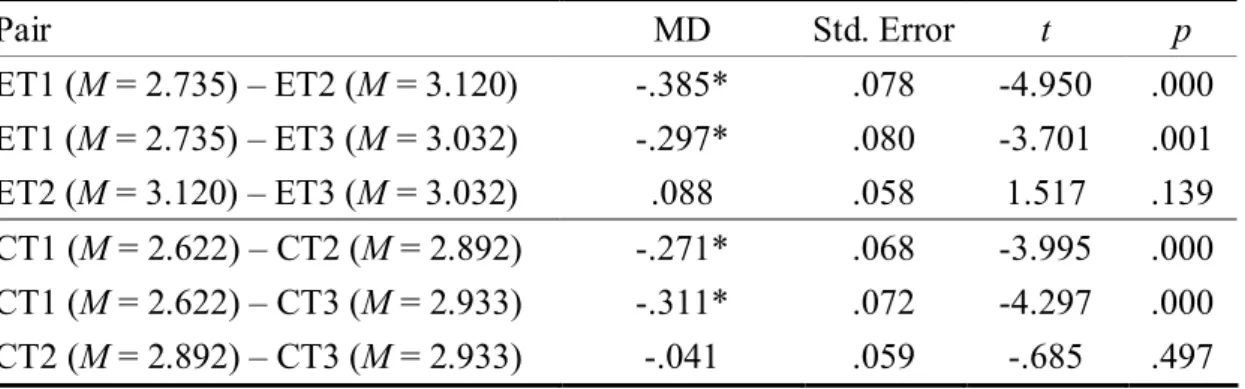
Table 14. Paired-samples t-Test of Mastery Over Instructed Strategies
Pair MD Std. Error t p
ET1 (M = 2.735) – ET2 (M = 3.120) -.385* .078 -4.950 .000 ET1 (M = 2.735) – ET3 (M = 3.032) -.297* .080 -3.701 .001 ET2 (M = 3.120) – ET3 (M = 3.032) .088 .058 1.517 .139 CT1 (M = 2.622) – CT2 (M = 2.892) -.271* .068 -3.995 .000 CT1 (M = 2.622) – CT3 (M = 2.933) -.311* .072 -4.297 .000 CT2 (M = 2.892) – CT3 (M = 2.933) -.041 .059 -.685 .497 Note. E = experimental group. C = control group.
T1 = pretest; T2 = immediate posttest; T3 = delayed posttest.
MD = mean difference.
* p < .05.
The results of paired samples t-tests in Table 14 also confirmed that both the experimental and the control groups increased mastery of the strategies after the study.
VLSI did not seem to help the experimental group perform better than the control group in increasing mastery over instructed strategies. This may be due to the fact that among the six types of vocabulary learning strategies instructed, except “phonological analysis” and “word-part analysis,” the other four strategies were not adopted frequently by the experimental group (see later section for further explanation).
Besides, although two of the six strategies—“using dictionaries” and “word-part analysis”— were not taught to the control group, the control group might still employ these two strategies often on their own.
2.60 2.70 2.80 2.90 3.00 3.10 3.20
T1 T2 T3
Time
Means
experimental group control group
Figure 1. Group Pretest (T1), Posttest (T2) and Delayed Posttest (T3) Means of Mastery over Instructed Strategies
Figure 1 gives a graphical representation of the means. According to the statistical analyses presented above, the VLSI treatment was not found to significantly increase the experimental group’s mastery over the instructed strategies. But Figure 1 shows that after VLSI, the difference between the experimental group and the control group was greater. However, in the delayed posttest, a decline in strategy mastery was found in the experimental group while the control group’s strategy mastery remained almost the same. That is, four weeks after the VLSI, the difference between the two groups in strategy mastery was not as great as that in the immediate posttest. This may be because after VLSI, the experimental group was not required to monitor their own strategy use on a strategy checklist any more. Without the teacher’s strategy instruction and monitoring, they seemed to reduce use of the instructed strategies. To sum up, after the twelve-week instruction, VLSI was not found effective in achieving more mastery over the instructed strategies. Moreover, as VLSI ceased, a loss in the
experimental group’s mastery occurred. It is suggested that a longer period of strategy training and constant teachers’ monitoring are needed in VLSI.
Differences Between the Experimental Group and Control Group in Their Performance on Vocabulary Tests
This section presents the change of the participants’ performances across three vocabulary tests. In order to investigate the effect of VLSI on vocabulary recognition and production, data were submitted to a repeated-measures analysis of variance (ANOVA) using a two between-subjects, three within-subjects factorial design on the scores of vocabulary recognition and production tests separately. The between-subjects factor was group (experimental group vs. control group), whereas the within-subjects factor was time (T1 vs. T2 vs. T3). The participants’ performance of vocabulary recognition is discussed first. Then their performance of vocabulary production is compared.
The Participants’ Performances in Vocabulary Recognition
The results of the pretest (T1), immediate posttest (T2), delayed posttest (T3) mean scores and standard deviations (SD) of each group’s performance in vocabulary recognition were presented in Table 15. The mean scores of the reception segment in vocabulary tests for the experimental group were 6.486 in the pretest, 17.714 in the immediate posttest, and 17.257 in the delayed posttest, and for the control group were 6.000, 12.568, and 12.027. Both groups made progress but to different degrees after the instruction.
Table 15. Descriptive Statistics of Vocabulary Recognition
Time Group M SD N
Experimental Group 6.486 5.382 35
Control Group 6.000 3.606 37
T1
Total 6.236 4.530 72
Experimental Group 17.714 8.757 35
Control Group 12.568 7.515 37
T2
Total 15.069 8.489 72
Experimental Group 17.257 8.793 35
Control Group 12.027 7.599 37
T3
Total 14.569 8.558 72
Note. T1 = pretest; T2 = immediate posttest; T3 = delayed posttest.
Two-way ANOVA was performed to test for time, group, and time by group effects on vocabulary recognition. The results in Table 16 revealed significant group (F = 5.715, p = .020), time (F = 117.859, p = .000), and time by group effects (F = 8.692, p = .001). Because of the finding of a significant interaction effect between time and group, simple main effects would be further analyzed to confirm the group effect.
Table 16. Summary of Two-way ANOVA on Vocabulary Recognition
Source Sum of Squares df Mean Square F p
Group 707.423 1 707.423 5.715 .020*
Time 3596.539 1.760 2043.072 117.859 .000*
Time * Group 265.243 1.760 150.675 8.692 .001*
Error (Group) 8664.535 70 123.779
Error (Time) 2136.091 123.225 17.335
Note. * p < .05.
As for the group effect on three individual tests, the results of the simple main effect in Table 17 revealed that no significant difference existed between the experimental group and the control group in the vocabulary pretest (p = .783), while
significant differences were found between two groups in the immediate posttest (p
= .004), and in the delayed posttest (p = .003). This means the two groups had similar previous reception knowledge of the target items in the vocabulary test, but after VLSI, the experimental group performed significantly better than the control group in recognizing the meanings of the target words in two posttests.
Table 17. Simple Main Group Effect on Vocabulary Recognition
Source Sum of Squares df Mean Square F p
Group
in T1 4.243 1 4.243 .076 .783
in T2 476.429 1 476.429 8.523 .004*
in T3 491.994 1 491.994 8.802 .003*
Error 10800.626 193.225 55.897
Note. T1 = pretest; T2 = immediate posttest; T3 = delayed posttest.
* p < .05.
With regard to time effect on vocabulary recognition, the results showed significant time effect on the experimental group’s and the control group’s performances in vocabulary recognition (see Table 18).
Table 18. Simple Main Time Effect on Vocabulary Recognition
Source Sum of Squares df Mean Square F p
Time
in E group 2826.990 2 1413.495 81.540 .000*
in C group 983.586 1.442 682.272 39.358 .000*
Error 2136.091 123.225 17.335
Note. E = Experimental; C = Control.
* p < .05.
The results of paired samples t-tests , as shown in Table 19, further revealed that both the experimental and control groups performed significantly better in the two posttests (immediate and delayed) than in the pretest. However, the two groups’
performances in the immediate posttest were not significantly different from their performances in the delayed posttest. This indicates that a significant progress in vocabulary recognition immediately after vocabulary instruction, be it strategy-integrated or not, and that no significant loss occurred in the delayed posttest.
Table 19. Paired-samples t-Test of Vocabulary Recognition
Pair MD Std. Error p
ET1 (M = 6.486) – ET2 (M = 17.714) -11.229* 1.023 .000 ET1 (M = 6.486) – ET3 (M = 17.257) -10.771* 1.032 .000
ET2 (M = 17.714) – ET3 (M = 17.257) .457 .908 .618
CT1 (M = 6.000) – CT2 (M = 12.568) -6.568* .938 .000 CT1 (M = 6.000) – CT3 (M = 12.027) -6.027* 1.012 .000
CT2 (M = 12.568) – CT3 (M = 12.027) .541 .532 .317
Note. E = experimental group. C = control group.
T1 = pretest; T2 = immediate posttest; T3 = delayed posttest.
MD = mean difference.
* p < .05.
Figure 2 gives a graphical representation of two groups’ means of vocabulary recognition in vocabulary tests. Learning occurred in both groups, but the students in the experimental group performed significantly better than the students in the control group in immediate and delayed posttests. That is, VLSI was found effective in increasing the significant gain of receptive vocabulary knowledge in this study.
A slight forgetting curve can be observed in both groups, but the decline was not statistically significant. This may be because the target words, belonging to Word Level Two, often appeared in the participants’ outside reading or English magazines.
Another reason may be that the participants had taken the tests three times and the practice effect arose.
2.00 4.00 6.00 8.00 10.00 12.00 14.00 16.00 18.00 20.00
T1 T2 T3
Time
Means experimental group
control group
Figure 2. Group Pretest (T1), Posttest (T2) and Delayed Posttest (T3) Means of Recognition in the Vocabulary Test
The Participants’ Performances in Vocabulary Production
In this section, the same statistical analyses performed on the recognition data were applied to the production data. The results of the pretest (T1), immediate posttest (T2), delayed posttest (T3) mean scores (M) and standard deviations (SD) of each group’s performance on vocabulary production were presented in Table 20 below.
The mean scores of the production segment in vocabulary tests for the experimental group were 4.229 in the pretest, 11.743 in the immediate posttest, and 12.057 in the delayed posttest, and for the control group were 3.243, 8.324, and 8.135. The two groups made progress in vocabulary production to different degrees.
Table 20. Descriptive Statistics of Vocabulary Production
Time Group M SD N
Experimental Group 4.229 4.609 35
Control Group 3.243 2.871 37
T1
Total 3.722 3.821 72
Experimental Group 11.743 8.922 35
Control Group 8.324 8.590 37
T2
Total 9.986 8.860 72
Experimental Group 12.057 8.918 35
Control Group 8.135 8.590 37
T3
Total 10.042 8.910 72
As presented in Table 21, ANOVA tests revealed no significant group effect (F
= 3.052, p = .085) and no significant interaction between group and time (p = .083) but significant time effect on vocabulary production (p = .000). This means no significant differences existed between the experimental group and the control group, but time had significant effect on the participants’ performance of vocabulary production.
Table 21. Summary of Two-way ANOVA on Vocabulary Production
Source Sum of Squares df Mean Square F p
Group 415.600 1 415.600 3.052 .085
Time 1921.331 1.402 1370.752 60.882 .000*
Time*Group 88.720 1.402 63.296 2.811 .083
Error (Group) 9532.900 70 136.184
Error (Time) 2209.086 98.116 22.515
Note. * p < .05.
Post hoc pairwise comparisons of estimated marginal means with Time as the independent variable showed that significant difference occurred between the pretest and the immediate posttest (p = .000), and between the pretest and the delayed posttest (p = .000) while no significant change existed between the immediate and delayed posttests, p = .873, (see Table 22). This indicates that all the participants as a
group performed significantly better in the two posttests than in the pretest, and they did not suffer significant loss in their productive vocabulary knowledge four weeks after the treatment.
Table 22. Post Hoc Comparisons for Time Effect on Vocabulary Production
I (Time) J (Time) MD (I-J) Std. Error p
T2 (M = 10.034) T1 (M = 3.736) 6.298* .774 .000
T3 (M = 10.096) T2 (M = 10.034) .063 .391 .873
T3 (M = 10.096) T1 (M = 3.736) 6.360* .751 .000
Note. T1 = pretest; T2 = immediate posttest; T3 = delayed posttest.
* p < .05.
Figure 3 gives a graphical representation of the means of vocabulary production in the vocabulary tests. The analyses above showed that no significant differences lay
2.00 4.00 6.00 8.00 10.00 12.00 14.00 16.00 18.00 20.00
T1 T2 T3
Time
Means experimental group
control group
Figure 3. Group Pretest (T1), Posttest (T2) and Delayed Posttest (T3) Means of Production in the Vocabulary Test
between the experimental group and the control group in the pretest, immediate, and delayed posttests. However, as shown in Figure 3, the distances between the two groups in the two posttests were greater than in the pretest. In the delayed posttest, a little gain in the experimental group’s vocabulary production was found while a slight loss in the control group’s vocabulary production was observed. It seems that VLSI might benefit the experimental group in longer retention of a word’s spelling. In summary, VLSI was not significantly effective in increasing the gain of vocabulary production in this study, but it benefited vocabulary production to a certain degree.
Differences Between the Experimental Group and Control Group in Motivation for Learning Vocabulary
In this section, the main concern will be the effect of VLSI on vocabulary learning motivation. The results of the pretest (T1), immediate posttest (T2), delayed posttest (T3) mean scores (M) and standard deviations (SD) of each group’s motivation for learning vocabulary are presented in Table 23.
Table 23. Descriptive Statistics of Vocabulary Learning Motivation
Time Group M SD N
Experimental Group 2.879 0.644 35
Control Group 2.723 0.467 37
T1
Total 2.799 0.561 72
Experimental Group 2.867 0.654 35
Control Group 2.850 0.547 37
T2
Total 2.858 0.597 72
Experimental Group 3.022 0.673 35
Control Group 2.858 0.591 37
T3
Total 2.938 0.633 72
The mean scores for the experimental group were 2.879 in the pretest, 2.867 in
the immediate posttest, and 3.022 in the delayed posttest, and for the control group were 2.723, 2.850, and 2.858. The experimental group did not increase motivation for learning vocabulary immediately after the instruction but increased motivation in the delayed posttest; the control group steadily increased motivation for learning vocabulary throughout the study.
Table 24. Summary of Two-way ANOVA on Vocabulary Learning Motivation
Source Sum of Squares df Mean Square F p
Group .681 1 .681 .739 .393
Time .707 2 .353 4.635 .011*
Time * Group .245 2 .122 1.604 .205
Error (Group) 64.544 70 .922
Error (Test) 10.671 140 .076
Note. * p < .05.
Though the two groups showed some discrepancies in motivation for learning vocabulary, the discrepancies did not reach a significant level, F = .739, p = .393 (see Table 24). Two-way ANOVA repeated measures also revealed no significant interaction between Group and Time (F = 1.604 , p = .205). However, significant Time effect was found (F = 4.635 , p = .011).
Table 25. Post Hoc Comparisons For Time Effect on Vocabulary Learning Motivation
I (Time) J (Time) MD (I-J) Std. Error p
T2 (M = 2.858) T1 (M = 2.801) .058 .045 .205
T3 (M = 2.940) T2 (M = 2.858) .082 .042 .057
T3 (M = 2.940) T1 (M = 2.801 ) .139* .050 .007
Note. T1 = pretest; T2 = immediate posttest; T3 = delayed posttest.
MD = mean difference
* p < .05.
In order to further investigate Time effect, post hoc pairwise multiple
comparison of estimated marginal means and paired samples t-tests were performed.
Table 25 shows that significant differences occurred between T1 and T3 in favor of the delayed posttest while no significant difference existed between T1 and T2, nor between T2 and T3. This means all the participants as a group significantly increased their motivation for vocabulary learning at the very end of the study while their motivation did not increase significantly in the immediate posttest. This may be due to the vocabulary test they had to take weekly and the huge vocabulary gap they had to bridge between senior high and junior high schools (Huang, 1997). This vocabulary gap was demonstrated in Lin’s (2006) quantitative analysis of the vocabulary in the first volume of Taiwanese senior high school English textbooks. Details will be provided in later section. They might be overwhelmed at first, but then they might be used to the amount of vocabulary they had to deal with in each lesson after one semester’s study in senior high school. They were more aware that vocabulary is important for their language learning and became more motivated in the end of the study.
Table 26. Paired-samples t-Test of Vocabulary Learning Motivation
Pair MD SD t p
ET1 (M = 2.879) – ET2 (M = 2.867) .012 .410 .168 .868 ET1 (M = 2.879) – ET3 (M = 3.022) -.144 .436 -1.949 .060 ET2 (M = 2.867) – ET3 (M = 3.022) -.155* .374 -2.459 .019 CT1 (M = 2.723) – CT2 (M = 2.850) -.127* .351 -2.191 .035 CT1 (M = 2.723) – CT3 (M = 2.858) -.136 .419 -1.973 .056 CT2 (M = 2.850) - CT3 (M = 2.858) -.010 .345 -.167 .868 Note. E = experimental group. C = control group.
T1 = pretest; T2 = immediate posttest; T3 = delayed posttest.
MD = mean difference.
* p < .05.
The results of paired samples t-tests, as presented in Table 26, revealed that for
the experimental group no significant change occurred between T1 and T2, and T1 and T3, but significant increase was found between T2 and T3. For the control group significant change was found between T1 and T2, but no significant change existed between T1 and T3, and T2 and T3. It seems that VLSI was not the factor that directly increased the participants’ motivation for learning vocabulary. This finding is consistent with Johnson’s (1997). Johnson’s Mexican university participants who received listening strategy training had similar motivation before and immediately after the treatment.
2.60 2.70 2.80 2.90 3.00 3.10
T1 T2 T3
Time
Means
experimental group control group
Figure 4. Group Pretest (T1), Posttest (T2) and Delayed Posttest (T3) Means of Vocabulary Learning Motivation
The statistical analyses above show that no significant differences in vocabulary learning motivation existed between the two groups across three different times. From a graphical representation of the means of two groups’ vocabulary learning motivation (see Figure 4), other observations can be made and some inferences can be
drawn. As for the differences between T1 and T2, the motivation the experimental group had in the immediate posttest remained almost the same as the motivation they had before the study while the control group increased their motivation in the immediate posttest. It seems that VLSI offered little help to the experimental group in improving vocabulary learning motivation. This may be due to the fact that during VLSI, the experimental group was often required to complete a variety of vocabulary tasks on their own and to apply the instructed strategies to the supplementary materials. The experimental group may view application of vocabulary learning strategies troublesome, and think vocabulary learning demands great efforts.
Moreover, based on Peng’s (2002) investigation of the correlation between Taiwanese senior high school students’ motivation and strategy use, the students who learn because they are required to tend to lack intrinsic motivation for their learning and to use fewer strategies that needs more efforts. As for the control group, their motivation increased in the immediate test probably because they had more freedom to choose what and how to learn. The ineffectiveness of VLSI on increasing motivation in this study contradicts Chiang’s (2005) findings that language learning strategy integrated instruction significantly motivated the junior high students to learn English.
As for the differences between T2 and T3, the experimental group increased their motivation in the delayed posttest while the control group had almost the same motivation as they had in the immediate posttest. The increase found in the experimental group may be due to the halt of VLSI. After the VLSI, the participants in the experimental group were no longer required to receive strategy training and to complete the tasks about the instructed strategies. The experimental group increased their motivation for learning vocabulary probably because they felt relieved. They had known how to learn vocabulary with some strategies and most importantly, could learn in the way they liked and chose the strategies they considered effective to learn