IINNTTRROODDUUCCTTIIOONN
Insulin is an important regulator of glucose homeostasis. It also plays a role in plurimetabolic syndrome, more commonly referred to as
Syndrome X [1]. Type 2 diabetes mellitus (DM) is determined by genetic, and environmental factors, and insulin resistance [2,3]. In addition, insulin resistance is associated with other diseases, including obesity, hypertension, dyslipidemia, and cardiovascular disease [4,5].
Modest weight loss can reduce insulinemia, thereby contributing to a decrease in morbidity and presumably, mortality [6,7].
O
Obbjjeeccttiivveess.. Many researchers have found that plasma leptin concentration is associated with insulin levels in non-diabetic subjects. However, the relationship between leptin concentrations and insulin levels in type 2 diabetes mellitus (DM) patients has rarely been investigated. The aim of this study was to investigate that relationship.
M
Meetthhooddss.. Fasting plasma glucose, fasting serum insulin (FSI), leptin concentration and body mass index (BMI) were measured in 100 type 2 DM subjects (50 males and 50 females).
R
Reessuullttss.. There were no significant differences in age, BMI, fasting plasma glucose, FSI and HbA1c between male and female subjects. The mean leptin concentration of the female subjects was significantly higher than that of the male subjects (7.75 6.41 vs 3.72 3.70 ng/mL, p < 0.01).
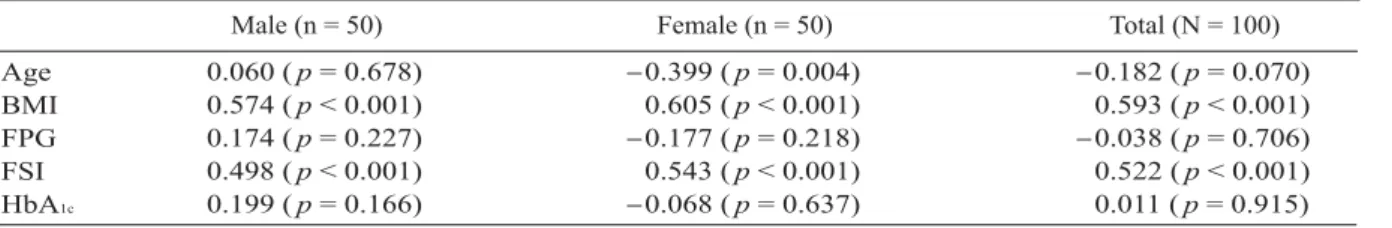
Using Pearson correlation analysis, leptin concentration positively correlated with BMI (r = 0.574, p < 0.001) and FSI levels (r = 0.498, p < 0.001) in the male subjects. It also positively correlated with BMI (r = 0.605, p < 0.001) and FSI levels (r = 0.543, p < 0.001) but inversely correlated with age (r = 0.399, p = 0.004) in the female subjects. After adjusting for age, BMI, and insulin modifying medications, FSI was significantly and positively related to leptin concentration ( = 0.180, p = 0.031) in the male subjects but not in the female subjects ( = 0.131, p = 0.089). BMI also positively correlated with leptin concentrations in both genders after considering the effects of FSI and other covariates.
C
Coonncclluussiioonnss.. Leptin concentration significantly correlated with FSI levels in men with type 2 diabetes but not in women with type 2 diabetes. The difference between the two groups may be due to age, gender effect, or other potential confounders. Further investigation is necessary. ( Mid Taiwan J Med 2003;8:1-7)
K
Keeyy wwoorrddss
insulin, leptin, type 2 DM
Received : August 27, 2002. Revised : October 29, 2002.
Accepted : January 8, 2003.
Address reprint requests to : Ching-Chu Chen, Division of Endocrinology and Metabolism, Department of Medicine, China Medical College Hospital, 2 Yuh-Der Road, Taichung 404, Taiwan, R.O.C.
Relationship Between Fasting Leptin and Insulin Concentrations in Type 2
Diabetes Mellitus Patients
Ying-Chung Chang, Ching-Chu Chen, Chih-Ming Chien, Rong-Hsing Chen, Tzu-Yuan Wang, Chwen-Tzuei Chang
Division of Endocrinology and Metabolism, Department of Medicine,
China Medical College Hospital, Taichung, Taiwan, R.O.C.
Leptin, the product of the ob gene, fluctuates considerably with body weight changes and more particularly with adiposity [8,9]. The physiological factors that modulate plasma leptin levels include sex, body fat, exercise, and fluctuations in caloric supply. Hormones that effect leptin production include insulin, glucocorticoids, sex steroids, growth hormone, somatostatin, and insulin-like growth factor I [10- 12]. End-stage renal disease which is a catabolic and anorectic state, is associated with marked elevation in leptin levels [13,14]. A current hypothesis holds that leptin is a "lipostate", regulating appetite through a negative feedback mechanism, and may counteract the anabolic fat- storing effects of insulin. Leptin has been shown to be positively associated with insulin resistance [15] and insulin concentrations [16] among non-
diabetic subjects. However, the relationship between leptin and insulin concentrations in type 2 DM has rarely been investigated. The purpose of this study was to investigate the relationship.
M
MAATTEERRIIAALLSS AANNDD MMEETTHHOODDSS Subjects
We recruited 100 type 2 DM subjects (50 males and 50 females) from the diabetic clinic at the China Medical College Hospital. Type 2 DM was diagnosed according to the 1985 World Health Organization criteria [17]. Subjects who were being treated with glucocorticoids, sex steroids, growth hormone, somatostatin, or insulin, had a history of thyroid disease or serum creatinin levels >1.5 mg/dL were excluded [10- 14]. All subjects were being treated with diet alone or diet plus oral hypoglycemic agents when
Male (n = 50)50.48 24.40 148.20 9.01 6.94 3.72
7.29 4.05 32.04 5.72 1.15 3.70 Table 1. Clinical and metabolic characteristics of subjects
Values are arithmetic means standard deviation; DM = diabetes mellitus; BMI = body mass index; FPG = fasting plasma glucose; FSI = fasting serum insulin; HTN = hypertension; ACEI = angiotensin-converting enzyme inhibitor; AIIRB = angiotensin II receptor blocker; CCB = Ca-channel blocker. *p < 0.01, male vs female.
Age (yr) BMI (kg/m2) FPG (mg/dL) FSI (
µ
U/mL) HbA1c (%) Leptin (ng/mL)*Medications for DM Diet alone
Sulfonylurea (S) Metformin (M) S + M
S + M + Acarbose Medications for HTN ACEI
AIIRB Diuretics CCB
-blocker -blocker ACEI + -blocker ACEI + -blocker ACEI + CCB CCB + -blocker
-blocker + AIIRB ACEI + CCB + -blocker ACEI + CCB + -blocker Diuretic + ACEI + CCB
3 (6%) 8 (16%) 2 (4%) 36 (72%)
1 (2%) 5 (10%) 1 (2%) 1 (2%) 2 (4%) 2 (4%) 1 (2%) 5 (10%) 0 1 (2%) 0 0 1 (2%) 1 (2%) 1 (2%)
Female (n = 50) 51.64
26.59 147.76 10.68 6.84 7.75
7.51 5.46 28.90 13.40 1.16 6.41 4 (8%) 9 (18%) 4 (8%) 32 (64%)
1 (2%) 6 (12%) 4 (8%) 0 4 (8%) 0 1 (2%) 2 (4%) 1 (2%) 3 (6%) 2 (4%) 1 (2%) 0 0 0
Total (N = 100) 51.06
26.00 147.98 9.84 6.89 5.73
7.39 4.82 30.36 10.28 1.15 5.59 7 (7%) 17 (17%) 10 (10%) 68 (68%) 2 (2%) 11 (11%)
5 (5%) 1 (1%) 6 (6%) 2 (2%) 2 (2%) 7 (7%) 1 (1%) 4 (4%) 2 (2%) 1 (1%) 1 (1%) 1 (1%) 1 (1%)
the study began. Thirty-eight percent of the type 2 diabetic subjects also had hypertension and were being treated with anti-hypertensive agents (Table 1).
Measurements
The weight and height of each DM control subjects who had fasted overnight were recorded at our diabetic clinic. Blood samples were obtained between 8:00 and 9:00 A.M. after an overnight fast. BMI was calculated as weight (kilogram) divided by height (meter
2). The glycated hemoglobin A1c (HbA
1c) levels 3 months preceding the study were recorded.
Plasma glucose concentration was assayed by the glucose oxidase method (Astra-8, Beckman, Calif, USA). HbA1c levels were measured using ion-exchange HPLC (HLC-723 GHbV, Tosoh, Tokyo, Japan). Serum was stored at 70 C until assay of the leptin and insulin concentrations. The serum insulin concentration was determined using a commercial radioimmunoassay (RIA) kit (Diagnostic Products Corp., Los Angels, Calif, USA). The inter-assay coefficient of variation (CV) of insulin was 8.7% and the intra-assay CV was 3.5%. Serum leptin concentration was measured using a commercial RIA kit Linco Research, St. Louis, Mo, USA). The inter-assay CV of leptin was 6.5% and the intra-assay CV was 3.6%.
Statistical Analysis
All data are presented as mean standard deviation (SD). The differences in the clinical and metabolic variables between male and female subjects were compared by Student's t test. The correlation between leptin and other variables was assessed by Pearson correlation coefficients.
Independent associations of leptin concentration
with other variables were analyzed by multiple linear regression. A p value of less than 0.05 was considered statistically significant. All statistical analyses were carried out by SPSS IX software.
R
REESSUULLTTSS
The clinical and metabolic characteristics of the subjects and medications for DM and hypertension control are shown in Table 1. There were no significant differences in age, BMI, fasting plasma glucose, FSI and HbA
1cbetween male and female subjects. The mean leptin concentration of the female subjects was significantly higher than that of the male subjects (7.75 6.41 vs 3.72 3.70 ng/mL, p < 0.01).
The association between leptin concentration and selected variables is presented in Table 2. Leptin concentration positively correlated with BMI (r = 0.574, p < 0.001) and FSI levels (r = 0.498, p < 0.001) in the male subjects. It also positively correlated with BMI (r = 0.605, p < 0.001) and FSI levels (r = 0.543, p < 0.001) but inversely correlated with age (r = 0.399, p = 0.004) in the female subjects. In all of the subjects, leptin concentration positively correlated with BMI (r = 0.593, p < 0.001) and FSI levels (r = 0.522, p < 0.001).
We evaluated the association between leptin concentrations and FSI levels of the covariates using multiple linear regression analyses in both genders (Table 3). After adjusting for age, BMI, and insulin modifying medications, including metformin, sulfonylurea, acarbose, ACEI, AIIRB, diuretics, -blocker and -blocker, FSI was found to be significantly and positively related to leptin concentration ( = 0.180, p = 0.031) in the male subjects but not in
Male (n = 50)Age BMI FPG FSI HbA1c
0.060 ( p = 0.678) 0.574 ( p < 0.001) 0.174 ( p = 0.227) 0.498 ( p < 0.001) 0.199 ( p = 0.166)
Table 2. Pearson's correlation coefficient (r) of leptin with selected variables
BMI = body mass index; FPG = fasting plasma glucose; FSI = fasting serum insulin.
Female (n = 50) 0.399 ( p = 0.004) 0.605 ( p < 0.001) 0.177 ( p = 0.218) 0.543 ( p < 0.001) 0.068 ( p = 0.637)
Total (N = 100) 0.182 ( p = 0.070) 0.593 ( p < 0.001) 0.038 ( p = 0.706) 0.522 ( p < 0.001) 0.011 ( p = 0.915)
the female subjects ( = 0.131, p = 0.089). BMI also positively correlated with leptin concentration in male ( = 0.477, p < 0.001) and female ( = 0.508, p = 0.002) subjects after considering the effects of FSI and other covariates.
D
DIISSCCUUSSSSIIOONN
In this study, we found that leptin concentrations of the female subjects were significantly higher than those of the male subjects, results which are consistent with previous studies [9,16]. The mechanism of this gender difference has not been completely elucidated. The different effects of androgens and estrogens on leptin production of adipocytes [11,18] and the difference in fat distribution between men and women [19,20] may be contributed to gender differences.
Leptin concentration positively correlates with the percentage of body fat and BMI [8,9].
This relationship was confirmed by our study. It has been shown that sustained hyperinsulinemia stimulates leptin messenger RNA expression [21,22] although acute changes in insulin levels do not seem to affect the expression of leptin [23].
However, the study by Couillard et al demonstrated a positive association between insulin and leptin [24]. In fact, increases in insulin
have been shown to increase leptin levels in obese males in physiological amounts [25,26]. In type 2 DM, insulin resistance alone will not result in hyperglycemia without at least some degree of impaired -cell function. This concept is supported by data from the United Kingdom Prospective Diabetic Study (UKPDS), which supported that -cells in patients with type 2 diabetes are already reduced by approximately 50% at the time of diagnosis [27].
Age inversely correlated with leptin concentration in our female subjects with type 2 diabetes but not in the male subjects according to Pearson analysis. However, after multiple linear regression analysis, no correlation between age and leptin concentration in female subjects was found. The reported decline in plasma leptin concentrations probably reflects the combined effects of age and estrogen deficiency [11,28].
The relationship between age and leptin concentration in both genders in our study differed from previous reports. Sample size, age distribution of selected samples, medications and other potential confounders may have contributed to the differences. In addition, after adjusting for age and BMI, the relationship between FSI levels and leptin concentration in our female subjects was not statistically significant. Age and gender effects, such as leptin decline in menopausal
Male (n = 50)
SE p
FSI BMI
Adjusted for BMI and age FSI
BMI Age
Adjusted for BMI, age and insulin modifying medications FSI
BMI Age
Medication*
0.204 0.406
F = 16.44 total R2 = 41.2%
0.193 0.438 0.075
F = 11.67 total R2 = 43.2%
0.180 0.477 0.106 2.296
F = 8.95 total R2 = 44.3%
0.080 0.112
0.079 0.144 0.058
0.081 0.122 0.067 2.465
0.014 0.001
0.019 0.001 0.204
0.031 0.001 0.121 0.357
Female (n = 50)
SE p
0.146 0.517
F = 17.89 total R2 = 43.2%
0.133 0.512 0.041
F = 11.74 total R2 = 43.4%
0.131 0.508 0.048 1.021
F = 8.66 total R2 = 43.5%
0.063 0.153
0.074 0.156 0.122
0.075 0.158 0.125 3.042
0.024 0.002
0.081 0.002 0.738
0.089 0.002 0.703 0.739 Table 3. Multiple linear regression analysis of selected variables with leptin values
SE = standard error; BMI = body mass index; FSI = fasting serum insulin. *Medications includes metformin, sulfonylurea, acarbose, ACEI, AIIRB, diuretics, -blocker and -blocker.
women due to estrogen deficiency, may play a role in this change.
In our type 2 DM subjects, some of the insulin modifying medications given for DM and hypertension control may have affected insulin concentration or sensitivity. We cannot exclude the effects of the medications on leptin concentration, although there were no significant differences between the non-medication group (n = 5) and medication group (n = 95) in leptin concentration. Therefore, in multiple linear regression analyses we adjusted for insulin modifying medications, including metformin, sulfonylurea, acarbose, ACEI, AIIRB, diuretics, -blocker and -blocker. The relationship between leptin concentration and FSI levels did not change in either gender.
In conclusion, we found that plasma leptin concentration is significantly related to insulin concentration in the male subjects with type 2 diabetes but not in the female diabetics. Leptin may be involved in regulating insulin resistance and may play an important role in the pathogenesis of type 2 DM. Further investigation to elucidate the relationship among leptin concentration, age, gender effect, and insulin resistance is necessary.
R
REEFFEERREENNCCEESS
1. Reaven GM. Role of insulin resistance in human disease. Diabetes 1988;37:1495-507.
2. DeFronzo RA. Lilly lecture 1987. The triumvirate:
beta-cell, muscle, liver. A collusion responsible for NIDDM. [Review] Diabetes 1988;37:667-87.
3. DeFronzo RA, Bonadonna RC, Ferrannini E.
Pathogenesis of NIDDM. A balance overview.
Diabetes Care 1992;15:318-68.
4. Serrano Rios M. Relationship between obesity and the increased risk of major complications in non-insulin- dependent diabetes mellitus. [Review] Eur J Clin Invest 1998;28(Suppl 2):14-8.
5. Stern MP. Do non-insulin-dependent diabetes mellitus and cardiovascular disease share common antecedents? [Review] Ann Intern Med 1996;124:110-6.
6. Goldstein DJ. Beneficial health effects of modest weight loss. [Review] Int J Obes Metab Disord 1992;16:397-415.
7. Wing RR, Jeffery RW. Effect of modest weight loss on
changes in cardiovascular risk factors: are there differences between men and women or between weight loss and maintenance? Int J Obes Relat Metab Disovd 1995;19:67-73.
8. Maffei M, Halaas J, Ravussin E, et al. Leptin levels in human and rodent: measurement of plasma leptin and ob RNA in obese and weight-reduced subjects. Nat Med 1995;1:1155-61.
9. Considine RV, Sinha MK, Heiman ML, et al. Serum immunoreactive-leptin concentrations in normal- weight and obese humans. N Engl J Med 1996;334:
292-5.
10.Masuzaki H, Ogawa Y, Hosoda K, et al.
Glucocorticoid regulation of leptin synthesis and secretion in humans: elevated plasma leptin levels in Cushing's syndrome. J Clin Endocrinol Metab 1997;
82:2542-7.
11. Elbers JM, Asscheman H, Seidell JC, et al. Reversal of the sex difference in serum leptin levels upon cross- sex hormone administration in transsexuals. J Clin Endocrinol Metab 1997;82:3267-70.
12. Donahoo WT, Jensen DR, Yost TJ, et al. Isoproterenol and somatostatin decrease plasma leptin in humans: a novel mechanism regulating leptin secretion. J Clin Endocrinol Metab 1997;82:4139-43.
13. Sharma K, Considine RV, Michael B, et al. Plasma leptin is partly cleared by the kidney and is elevated in hemodialysis patients. Kidney Int 1997;51:1980-5.
14. Grinspoon S, Gulick T, Askari H, et al. Serum leptin levels in women with anorexia nervoxa. J Clin Endocrinol Metab 1996;81:3861-3.
15. Haffner SM, Miettnen H, Mykkanen L, et al. Leptin concentrations and insulin sensitivity in normoglycemic men. Int J Obes 1997;21:393-9.
16. Dagogo-Jack S, Fanelli C, Paramore D, et al. Plasma leptin and insulin relationships in obese and nonobese humans. Diabetes 1996;45:695-8.
17. WHO Study Group. Diabetes mellitus. Technical report series no. 727. Geneva: World Health Organization, 1985.
18. Jockenhovel F, Blum WF, Vogel E, et al. Testosterone substitution normalizes elevated serum leptin levels in hypogonadal men. J Clin Endocrinol Metab 1997;82:2510-3.
19. Hu FB, Chen C, Wang B, et al. Leptin concentration in relation to overall adiposity, fat distribution, and blood pressure in a rural Chinese population. Int J Obes Relat Metab Disord 2001;15:121-5.
20. Bennett FI, McFarlane-Anderson N, Wilks R, et al.
Leptin concentration in women is influenced by
regional distribution of adipose tissue. Am J Clin Nutr 1997;66:1340-4.
21. Kolaczynski JW, Considine RV, Ohannesian J, et al.
Responses of leptin to shot-term fasting and refeeding in humans: a link with ketogenesis but not ketones themselves. Diabetes 1996;45:1511-5.
22. Kolaczynski JW, Ohannesian J, Considine RV, et al.
Responses of leptin to shot-term and prolonged overfeeding in humans. J Clin Endocrinol Metab 1996;81:4162-5.
23. Vidal H, Auboeuf D, De Vos P, et al. The expression of ob gene is not acutely regulated by insulin and fasting in human abdominal subcutaneous adipose tissue. J Clin Invest 1996;98:251-5.
24. Couillard C, Mauriege P, Prud'homme D, et al. Plasma leptin concentrations: gender differences and association with metabolic risk factors for
cardiovascular disease. Diabetologia 1997;40:1178- 84.
25. Boden G, Chen X, Kolaczynski JW, et al. Effects of prolonged hyperinsulinemia on serum leptin in normal human subjects. J Clin Invest 1997;100:1107-13.
26. Saad MF, Khan A, Sharma A, et al. Physiological insulinemia acutely modulates plasma leptin. Diabetes 1998:47:544-9.
27. UK Prospective Diabetes Study (UKPDS) Group:
Intensive blood-glucose control and sulphonylureas or insulin compared with conventional treatment and risk of complications in patients with type 2 diabetes (UKPDS 33). Lancet 1998;352:837-53.
28. Ostlund RE Jr, Yang JW, Klein S, et al. Relation between plasma leptin concentration and body fat, gender, diet, age, and metabolic covariates. J Clin Endocrinol Metab 1996;81:3909-13.
2
2 2
( )
2 (7.75 6.41
vs 3.72 3.70 ng/mL p < 0.01) (r = 0.574
p < 0.001) (r = 0.498 p < 0.001)
(r = 0.605 p < 0.001) (r = 0.543 p < 0.001) (r = 0.399 p = 0.004)
2 2
2 2
2 2003;8:1-7
2
404 2
2002 8 27 2002 10 29
2003 1 8