R E S E A R C H A R T I C L E
Open Access
Quality of life predicts survival in patients with
non-small cell lung cancer
Tsai-Chung Li
1,2, Chia-Ing Li
3,4,5, Chun-Hua Tseng
6, Kuan-Shin Lin
6, Sing-Yu Yang
1, Chih-Yi Chen
7, Te-Chun Hsia
8,
Yih-Dar Lee
9,10and Cheng-Chieh Lin
3,4,11*Abstract
Background: Patients with non-small cell lung cancer (NSCLC) have a poor prognosis. The objective of this study was to examine the relationship of EORTC QLQ-C30 and QLQ-LC13 and survival in patients with NSCLC undergoing different treatments.
Methods: Investigators conducted a health-related quality of life (HRQOL) survey of 488 patients with NSCLC: 162 patients undergoing surgery, 312 patients without surgery, and their survival status was prospectively followed up. EORTC QLQ-C30 and QLQ-LC13 scores and clinical variables at baseline were analyzed using Cox’s proportional hazard regression to identify factors that influenced survival.
Results: Median survival of these 474 patients was 9.82 months. After adjustment, emotional functioning scale, and symptom scales of pain and nausea/vomiting are associated with survival in NSCLC patients with surgery whereas social functioning scale, and symptom scales for fatigue, appetite loss, and financial problems had a significant impact on survival in NSCLC patients without surgery. The results of multivariate analysis showed that none of QLQ-LC13 scales are significant predictors of survival. After simultaneously considering these scales, we found significant independent predictors of survival were nausea/vomiting (HR = 0.11, 95% CI = 0.02-0.63 for score >0 compared with =0) in NSCLC patients with surgery and appetite loss (HR = 1.77, 95% CI = 1.26-2.49 for score >0 compared with =0) in NSCLC patients without surgery.
Conclusions: HRQOL provides additional predictive information that supplements traditional clinical factors, and is a new prognostic indicator for survival of NSCLC patients under different treatments.
Keywords: Lung cancer, HRQOL, Prognostic factors, Survival Background
Lung cancer (LC) is the leading cause of cancer-associated mortality worldwide. In 2011, malignant neoplasm was the number one leading cause of death in Taiwan, accounting for more than 20% of total deaths [1]. Lung cancer was ranked as the second most common cancer in men, accounting for about 21.2% of all cancer deaths, and was the most common cancer in women, accounting for about 16.7% of all cancer deaths.
A growing body of research shows that self-perceptions of health are linked to mortality, even when more objective
health measures, such as morbidity [2,3], social support [3], and health behaviors [4] are controlled. Health-related quality of life (HRQOL) and its assessment have become increasingly important in the field of oncology. HRQOL is an important aspect of cancer care. It has been acknowl-edged as an important end point in cancer clinical trials and clinical practice, along with the traditional end points, including tumor response rate, disease-free survival, and overall survival. Several studies have investigated the prog-nostic factors of patients with lung cancer, and these have been reported to enable the differentiation of patients with favorable and adverse prognoses [5-8]; analyses of advanced non-small cell lung carcinoma treated with chemotherapy [5] or with radiotherapy [6], of new cases of all cancer types and treatments [7], and of advanced lung * Correspondence:[email protected]
3
Department of Medical Research, China Medical University Hospital, Taichung, Taiwan
4
School of Medicine, College of Medicine, China Medical University, Taichung, Taiwan
Full list of author information is available at the end of the article
© 2012 Li et al.; licensee BioMed Central Ltd. This is an Open Access article distributed under the terms of the Creative Commons Attribution License (http://creativecommons.org/licenses/by/2.0), which permits unrestricted use, distribution, and reproduction in any medium, provided the original work is properly cited.
carcinoma of all cancer types with chemotherapy [8] have been undertaken.
There is an increasing need for the Chinese version HRQOL instruments for cancer patients due to increas-ing incidence rates of cancer in Taiwan. Although the Chinese version of the European Organization for Re-search and Treatment of Cancer (EORTC) QLQ-C30 and lung cancer-specific (LC-13) scales were available, their relationships with survival in lung cancer patients have never been reported. Therefore, the objective of this study was to examine the relationship of the EORTC QLQ-C30 and LC-13 scales and survival in Taiwanese patients with stages I-IV non-small cell lung cancer (NSCLC).
Methods NSCLC patients
From July 2004 to December 2007, we consecutively con-tacted NSCLC patients undergoing active chemotherapy, surgery or post-therapy follow-up in an inpatient setting or at the outpatient clinic of the Department of Oncology at China Medical University Hospital and Taichung Veter-ans General Hospital, two medical centers in central Taiwan. NSCLC patients in this cross-sectional study were initially recruited to participate in a known-groups validation study of the EORTC QLQ-C30 and QLQ-LC13. The eligibility criteria for inclusion were a clinical diagno-sis of NSCLC with local, advanced, or metastatic lung cancer; American Joint Committee on Cancer/Union International Cancer Center (AJCC/UICC) stages I-IV; the ability to read, write and speak Mandarin or Taiwanese; informed consent; and no major disabling medical or psy-chiatric conditions that would substantially impair cogni-tive functioning. Patients who declined to participate were excluded. Patients were instructed to complete the ques-tionnaires themselves. Patients who had difficulty in com-pleting the questionnaires were assisted by interviewers fluent in both Mandarin and Taiwanese. This study was approved by the Human Research Committee of China Medical University Hospital. Written informed consent was obtained from each participant.
Prognostic clinical variables
We abstracted data on tumor characteristics, such as date of diagnosis, histology, tumor type, stage, and treat-ment, and patient characteristics like gender, date of birth and co-morbidity at the time of diagnosis. We only included those cases with histology being categorized as NSCLC. Tumor type was categorized as squamous cell carcinoma, adenocarcinoma, and undifferentiated car-cinoma. Stage of lung cancer was defined by location and extent of primary and metastatic tumor involve-ment. The standard AJCC/UICC system was used for staging [9]. Stage of lung cancer was differentiated as I
or II, III (a or b), or IV, with the higher stage represent-ing more advanced disease. Treatment status was classi-fied as surgery, chemotherapy or post-therapy follow-up. Usually, NSCLC patients who did not have completely resected stage IA and IB would receive adjuvant therapy and NSCLC patients who are not candidates for surgery or who refuse surgery, curative intent chemotherapy or radiotherapy is used. Cancer duration was derived by calculating the difference between the date of entry and date of diagnosis, using month as the unit.
Instruments
The EORTC QLQ-C30 [10] and QLQ-LC13 [11] were used. The EORTC QLQ-C30 is a core cancer-specific questionnaire containing 30 items on patients’ functioning, global quality of life (QOL), and disease- and treatment-related symptoms. The QLQ-LC13 is a site-specific ques-tionnaire consisting of 13 items on lung cancer symptoms (cough, haemoptysis, dyspnoea, site-specific pain) and its treatment-related side-effects (sore mouth, dysphagia, per-ipheral neuropathy, alopecia). Previous study showed that overall validation results for the Chinese version of the EORTC QLQ-C30 and QLQ-LC13 confirmed it as a re-liable and valid questionnaire for assessing lung cancer-specific HRQOL in Taiwan [12]. Patients receiving chemotherapy completed questionnaires between the first cycle of therapy and the end of the 6thcycle. Patients undergoing surgery completed the surveys between one and 4 weeks after surgery. Patients free of recurrent dis-ease completed the questionnaires at a follow-up visit.
Main outcome measure
The primary outcome measure was survival due to any cause in the months following baseline assessment of HRQOL. Survival was ascertained by patients’ family mem-bers through telephone follow-up. For non-respondents, vital status was assessed by linking to the National Mortal-ity database through December 31, 2007 using gender, identification number, and date of birth. For individuals reported deceased by family members, the date of death and cause of death were confirmed using the same process. The precise date of death along with the date of entry was used to calculate the event time. Those who did not die were defined as censored and their data were censored on December 31, 2007.
Statistical analysis
The Cox proportional hazards model was used to assess the relative risk of survival in terms of the 2 HRQOL instruments. First, we categorized the scales of the QLQ C-30 and LC-13 according to their tertiles, and dichoto-mized the single-item symptom scales. Then, we evalu-ated the crude risk of survival separately for each scale, and added age, gender, stages of cancer, treatment type,
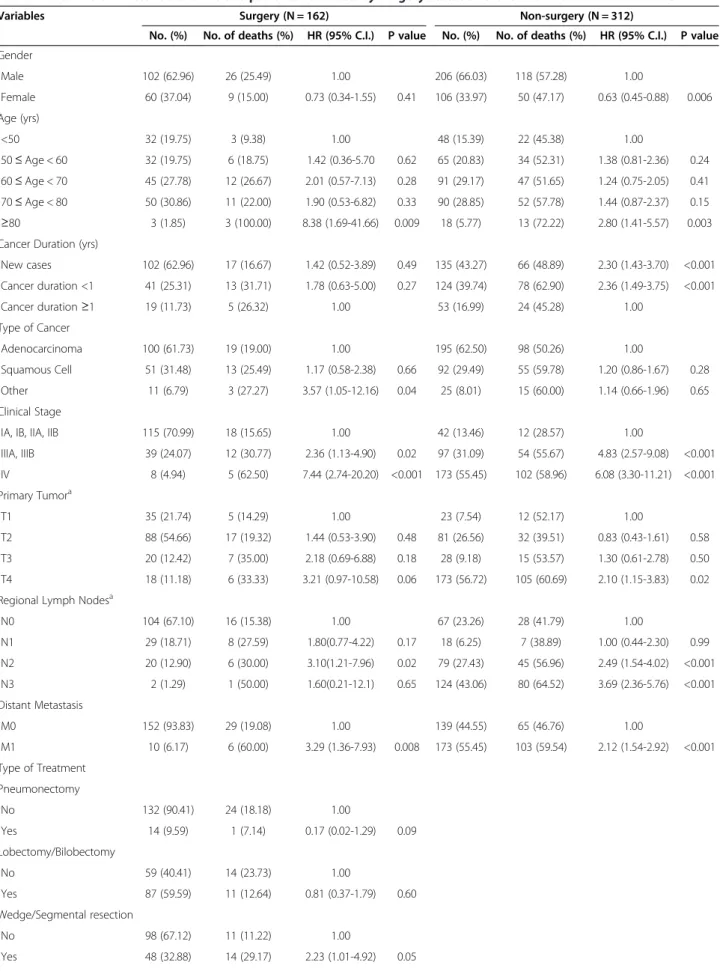
Table 1 Baseline characteristics of NSCLC patients stratified by surgery status and their relation to survival time
Variables Surgery (N = 162) Non-surgery (N = 312)
No. (%) No. of deaths (%) HR (95% C.I.) P value No. (%) No. of deaths (%) HR (95% C.I.) P value Gender Male 102 (62.96) 26 (25.49) 1.00 206 (66.03) 118 (57.28) 1.00 Female 60 (37.04) 9 (15.00) 0.73 (0.34-1.55) 0.41 106 (33.97) 50 (47.17) 0.63 (0.45-0.88) 0.006 Age (yrs) <50 32 (19.75) 3 (9.38) 1.00 48 (15.39) 22 (45.38) 1.00 50≤ Age < 60 32 (19.75) 6 (18.75) 1.42 (0.36-5.70 0.62 65 (20.83) 34 (52.31) 1.38 (0.81-2.36) 0.24 60≤ Age < 70 45 (27.78) 12 (26.67) 2.01 (0.57-7.13) 0.28 91 (29.17) 47 (51.65) 1.24 (0.75-2.05) 0.41 70≤ Age < 80 50 (30.86) 11 (22.00) 1.90 (0.53-6.82) 0.33 90 (28.85) 52 (57.78) 1.44 (0.87-2.37) 0.15 ≥80 3 (1.85) 3 (100.00) 8.38 (1.69-41.66) 0.009 18 (5.77) 13 (72.22) 2.80 (1.41-5.57) 0.003
Cancer Duration (yrs)
New cases 102 (62.96) 17 (16.67) 1.42 (0.52-3.89) 0.49 135 (43.27) 66 (48.89) 2.30 (1.43-3.70) <0.001 Cancer duration <1 41 (25.31) 13 (31.71) 1.78 (0.63-5.00) 0.27 124 (39.74) 78 (62.90) 2.36 (1.49-3.75) <0.001 Cancer duration≥1 19 (11.73) 5 (26.32) 1.00 53 (16.99) 24 (45.28) 1.00 Type of Cancer Adenocarcinoma 100 (61.73) 19 (19.00) 1.00 195 (62.50) 98 (50.26) 1.00 Squamous Cell 51 (31.48) 13 (25.49) 1.17 (0.58-2.38) 0.66 92 (29.49) 55 (59.78) 1.20 (0.86-1.67) 0.28 Other 11 (6.79) 3 (27.27) 3.57 (1.05-12.16) 0.04 25 (8.01) 15 (60.00) 1.14 (0.66-1.96) 0.65 Clinical Stage
IA, IB, IIA, IIB 115 (70.99) 18 (15.65) 1.00 42 (13.46) 12 (28.57) 1.00
IIIA, IIIB 39 (24.07) 12 (30.77) 2.36 (1.13-4.90) 0.02 97 (31.09) 54 (55.67) 4.83 (2.57-9.08) <0.001 IV 8 (4.94) 5 (62.50) 7.44 (2.74-20.20) <0.001 173 (55.45) 102 (58.96) 6.08 (3.30-11.21) <0.001 Primary Tumora T1 35 (21.74) 5 (14.29) 1.00 23 (7.54) 12 (52.17) 1.00 T2 88 (54.66) 17 (19.32) 1.44 (0.53-3.90) 0.48 81 (26.56) 32 (39.51) 0.83 (0.43-1.61) 0.58 T3 20 (12.42) 7 (35.00) 2.18 (0.69-6.88) 0.18 28 (9.18) 15 (53.57) 1.30 (0.61-2.78) 0.50 T4 18 (11.18) 6 (33.33) 3.21 (0.97-10.58) 0.06 173 (56.72) 105 (60.69) 2.10 (1.15-3.83) 0.02
Regional Lymph Nodesa
N0 104 (67.10) 16 (15.38) 1.00 67 (23.26) 28 (41.79) 1.00 N1 29 (18.71) 8 (27.59) 1.80(0.77-4.22) 0.17 18 (6.25) 7 (38.89) 1.00 (0.44-2.30) 0.99 N2 20 (12.90) 6 (30.00) 3.10(1.21-7.96) 0.02 79 (27.43) 45 (56.96) 2.49 (1.54-4.02) <0.001 N3 2 (1.29) 1 (50.00) 1.60(0.21-12.1) 0.65 124 (43.06) 80 (64.52) 3.69 (2.36-5.76) <0.001 Distant Metastasis M0 152 (93.83) 29 (19.08) 1.00 139 (44.55) 65 (46.76) 1.00 M1 10 (6.17) 6 (60.00) 3.29 (1.36-7.93) 0.008 173 (55.45) 103 (59.54) 2.12 (1.54-2.92) <0.001 Type of Treatment Pneumonectomy No 132 (90.41) 24 (18.18) 1.00 Yes 14 (9.59) 1 (7.14) 0.17 (0.02-1.29) 0.09 Lobectomy/Bilobectomy No 59 (40.41) 14 (23.73) 1.00 Yes 87 (59.59) 11 (12.64) 0.81 (0.37-1.79) 0.60 Wedge/Segmental resection No 98 (67.12) 11 (11.22) 1.00 Yes 48 (32.88) 14 (29.17) 2.23 (1.01-4.92) 0.05
duration of cancer, and lung cancer subtype. Next, we used the continuous variables of the QLQ C-30 and LC-13 scales to test linear trends. Finally, five models were examined. In the first model, the relative hazards of survival of all clinical variables were examined simultan-eously. In the second model, the functioning scales of the QLQ C-30 were examined simultaneously by adjusting for clinical parameters in the first model. In the third model, the relative hazards of survival were estimated simultan-eously for symptom scales of QLQ C-30 while considering all clinical parameters. In the fourth model, the relative hazards of survival of the symptom scales of the QLQ LC-13 were examined simultaneously by controlling for clinical parameters. In the last model, the signifi-cant scales of the QLQ C-30 and LC-13 in 2–4 models were examined simultaneously, while including the relative hazards of survival with the clinical parameters in the model. Kaplan-Meier estimates were used to ob-tain the proportion of patients who had an event dur-ing follow-up for those significant scales of QLQ-C30 and LC-13 in model 5 and log-rank tests were used to compare whether the survival functions across sub-groups were different. All analyses were conducted using SAS, version 9.1 (SAS Institute Inc. Cary NC).
Results
Patient population
Four hundred seventy-eight NSCLC patients (162 receiv-ing surgery and 312 not receivreceiv-ing surgery) participated in this study. The socio-demographic and clinical data and their relationship to survival stratified by surgery status are presented in Table 1. Age, clinical stage, pri-mary tumor, regional lymph nodes, distant metastasis,
and type of treatment were significantly associated with survival in both groups. In addition, female was signifi-cantly associated with longer survival (HR = 0.63, 95% CI = 0.45-0.88) and cancer duration <1 year was asso-ciated with worse survival (2.30, 1.43-3.70 for new cases; 2.36, 1.49-3.75 for <1 year) in patients without surgery.
Health-related quality of life and survival
Table 2 shows the results of univariate and multivariate analyses that examined whether the various QOL-C30 scores were significant for overall survival stratified by surgery status. After multivariate adjustment for adjust-ing for age, gender, cancer duration, type of cancer and cancer clinical stage of TNM, emotional functioning scale, and symptom scales of pain and nausea/vomiting are associated with survival in NSCLC patients with sur-gery whereas social functioning scale, and symptom scales for fatigue, appetite loss, and financial problems had a significant impact on survival in NSCLC patients without surgery. And there existed a significant linear trend for fatigue scale. For scales of the QLQ-LC13, the results of univariate analysis showed that the sore mouth in patients with surgery, and hemoptysis, and dysphagia scales of the QLQ-LC13 in NSCLC patients without sur-gery had a significant impact on survival Table 3. The results of multivariate analysis showed that none of these scales remained statistically significant after adjustment.
Hierarchical Cox’s proportional hazard models
Table 4 shows the hierarchical Cox’s proportional hazard models in NSCLC patients with surgery. The results for model 1 indicated that age, type of cancer, and regional lymph nodes were significant prognostic factors for survival,
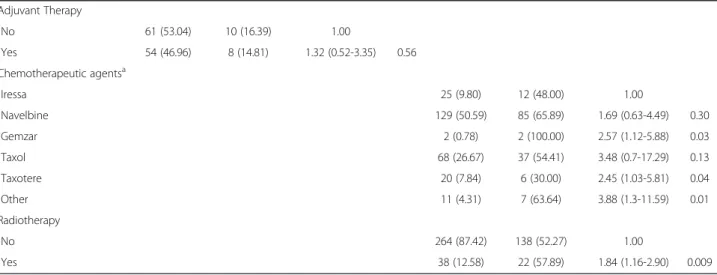
Table 1 Baseline characteristics of NSCLC patients stratified by surgery status and their relation to survival time (Continued) Adjuvant Therapy No 61 (53.04) 10 (16.39) 1.00 Yes 54 (46.96) 8 (14.81) 1.32 (0.52-3.35) 0.56 Chemotherapeutic agentsa Iressa 25 (9.80) 12 (48.00) 1.00 Navelbine 129 (50.59) 85 (65.89) 1.69 (0.63-4.49) 0.30 Gemzar 2 (0.78) 2 (100.00) 2.57 (1.12-5.88) 0.03 Taxol 68 (26.67) 37 (54.41) 3.48 (0.7-17.29) 0.13 Taxotere 20 (7.84) 6 (30.00) 2.45 (1.03-5.81) 0.04 Other 11 (4.31) 7 (63.64) 3.88 (1.3-11.59) 0.01 Radiotherapy No 264 (87.42) 138 (52.27) 1.00 Yes 38 (12.58) 22 (57.89) 1.84 (1.16-2.90) 0.009 a
and model 2 showed that emotional functioning scale of the QLQ C-30 was a strong predictor of subsequent survival, after adjusting for all other variables in the model (3.36, 1.05-10.69 for a score 83.33-100 compared to≤83.33). The
results for model 3 showed that the effect of the QLQ C-30 scales for nausea/vomiting (0.12, 0.02-0.71 for score >0 com-pared with score of 0) was statistically significant. Because none of adjusted HR for QLQ-LC13 scale was statistically
Table 2 Univariate and multivariate Cox’s analyses of baseline EORTC QLQ-C30 for overall survival stratified by surgery status Surgery (N = 162) Non-surgery (N = 312) Variables N # of death Crude HR (95%C.I.) Adjusted HR (95%C.I.) N # of death Crude HR(95%C.I.) Adjusted HR (95%C.I.) QLQ-C30
Physical Functioning (<100 as reference) 81 25 1.00 1.00 225 130 1.00 1.00
=100 81 10 0.52 (0.25-1.09) 0.61 (0.22-1.74) 84 35 0.67 (0.46-0.98)* 0.89 (0.59-1.35)
Role Functioning (<100 as reference) 27 5 1.00 1.00 105 61 1.00 1.00
=100 135 30 1.30 (0.51-3.36) 2.73 (0.66-11.39) 205 105 0.71 (0.52-0.98)* 1.08 (0.75-1.54) Emotional Functioning (<83.33 as reference) 62 12 1.00 1.00 122 63 1.00 1.00 83.33≤EFS < 100 44 11 1.29 (0.57-2.92) 3.36 (1.05-10.69)* 85 53 1.15 (0.8-1.66) 1.20 (0.81-1.78) =100 56 12 1.06 (0.48-2.36) 2.00 (0.67-5.96) 105 52 0.96 (0.66-1.39) 1.11 (0.75-1.66)
Cognitive Functioning (<100 as reference) 84 19 1.00 1.00 163 90 1.00 1.00
=100 78 16 0.82 (0.42-1.59) 1.21 (0.53-2.76) 149 78 1.00 (0.74-1.35) 1.11 (0.79-1.56)
Social Functioning (<100 as reference) 65 16 1.00 1.00 159 94 1.00 1.00
=100 96 19 0.76 (0.39-1.48) 1.41 (0.57-3.53) 151 73 0.57 (0.42-0.78)*** 0.70 (0.50-0.99)*
Global QOL (≤50 as reference) 54 16 1.00 1.00 166 98 1.00 1.00
50 < QLS≤66.67 55 7 0.43 (0.18-1.05) 0.51 (0.17-1.53) 72 40 0.75 (0.52-1.08) 0.90 (0.61-1.32) >66.67 52 11 0.72 (0.33-1.55) 0.98 (0.34-2.85) 73 29 0.45 (0.29-0.68)*** 0.79 (0.50-1.26) Fatigue (≤11.12 as reference) 96 15 1.00 1.00 99 46 1.00 1.00 11.12 < FAS≤33.34 36 10 1.65 (0.74-3.67) 1.78 (0.71-4.48) 111 52 1.37 (0.92-2.04) 1.49 (0.98-2.27) >33.34 30 10 1.83 (0.82-4.06) 1.07 (0.37-3.09) 102 70 2.52 (1.73-3.68)*** 2.00 (1.34-3.00)*** Pain (=0 as reference) 89 19 1.00 1.00 121 68 1.00 1.00 0 < Pain≤22.22 36 5 0.48 (0.18-1.28) 0.20 (0.05-0.78)* 73 34 0.73 (0.49-1.11) 0.82 (0.53-1.29) >22.22 37 11 0.98 (0.47-2.07) 0.53 (0.19-1.48) 118 66 1.18 (0.84-1.66) 1.02 (0.70-1.47) Nausea/Vomiting (=0 as reference) 147 31 1.00 1.00 248 124 1.00 1.00 >0 15 4 0.79 (0.28-2.24) 0.10 (0.02-0.56)** 63 43 1.44 (1.02-2.04)* 0.98 (0.66-1.44) Dyspnoea (=0 as reference) 114 17 1.00 1.00 156 72 1.00 1.00 >0 48 18 1.80 (0.93-3.51) 1.69 (0.70-4.07) 155 96 1.49 (1.10-2.02)* 1.08 (0.77-1.51) Insomnia (=0 as reference) 93 18 1.00 1.00 154 80 1.00 1.00 >0 68 17 1.29 (0.67-2.51) 1.62 (0.72-3.64) 152 82 0.93 (0.69-1.27) 0.99 (0.71-1.37)
Appetite Loss (=0 as reference) 125 28 1.00 1.00 188 84 1.00 1.00
>0 37 7 0.71 (0.31-1.63) 0.39 (0.13-1.20) 124 84 2.26 (1.66-3.07)*** 1.79 (1.27-2.52)***
Constipation (=0 as reference) 123 23 1.00 1.00 209 103 1.00 1.00
>0 39 12 1.86 (0.92-3.75) 1.41 (0.51-3.92) 102 65 1.38 (1.01-1.88)* 1.12 (0.80-1.57)
Diarrhoea (=0 as reference) 147 31 1.00 1.00 263 136 1.00 1.00
>0 15 4 1.12 (0.40-3.18) 0.49 (0.07-3.27) 48 32 1.25 (0.85-1.84) 1.28 (0.85-1.95)
Financial Difficulties (=0 as reference) 119 23 1.00 1.00 216 103 1.00 1.00
>0 41 11 1.52 (0.74-3.12) 0.84 (0.28-2.55) 94 64 1.83 (1.34-2.51)*** 1.55 (1.08-2.20)*
Adjusted for age, sex, cancer duration, type of cancer and clinical stage (TNM stage). *:P < 0.05, **:P < 0.01, ***:P < 0.001.
significant, we fit model 5 directly. As model 5 shows, when significant scales of the QLQ C-30 were considered simul-taneously, nausea/vomiting was the only scale with a signifi-cant effect on survival (0.11, 0.02-0.63 for a score >0 compared to a score of 0) after controlling for all other vari-ables in the model.
Table 5 shows the hierarchical Cox’s proportional haz-ard models in NSCLC patients without surgery. The results for model 1 indicated that gender, age, cancer duration, type of cancer, regional lymph nodes, and dis-tant metastasis were significant prognostic factors for survival, and model 2 showed that social functioning scale of the QLQ C-30 was a strong predictor of subse-quent survival, after adjusting for all other variables in the model (0.70, 0.50-0.99 for a score 100 compared to <100). The results for model 3 showed that the effect of the QLQ C-30 scales for appetite loss (1.62, 1.12-2.36 for score >0 compared with score of 0) were significant. Because none of adjusted HR for QLQ-LC13 scale was statistically significant, we fit model 5 directly. As model 5 shows, when significant scales of the QLQ C-30 were
considered simultaneously, the effects of appetite loss on survival remained significant (1.77, 1.26-2.49) after con-trolling for all other variables in the model.
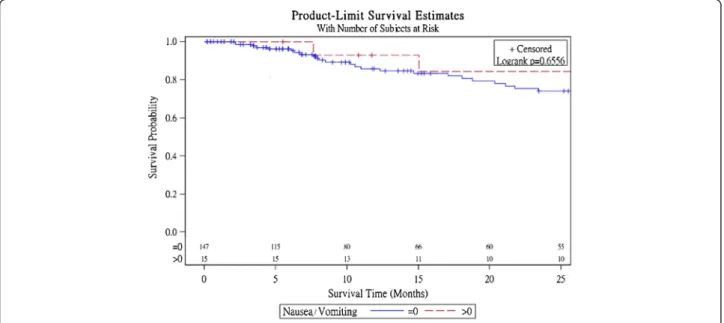
Survival curves
Figure 1 presents Kaplan-Meier survival curves within subgroups defined by nausea/vomiting scales in NSCLC patients with surgery and log-rank tests reveal that there are no difference within subgroups for these 3 scales. Figure 2 shows Kaplan-Meier survival curves within sub-groups defined by appetite loss and it is significantly dif-ferent (p < 0.001).
Discussion
The present study was the first one examining the rela-tionship between the Chinese version of the EORTC QLQ-C30 and QLQ-LC13 and all-cause survival while adjusting for an array of clinical parameters in a sample of NSCLC patients stratified by surgery status. We demonstrated that HRQOL measured by the QLQ C-30 was a strong and independent predictor of overall survival
Table 3 Univariate and multivariate Cox’s analyses of baseline EORTC QLQ-LC13 for overall survival stratified by surgery status Surgery (N = 162) Non-surgery (N = 312) Variables N # of death Crude HR (95%C.I.) Adjusted HR (95%C.I.) N # of death Crude HR (95%C.I.) Adjusted HR (95%C.I.) QLQ-LC13 Dyspnoea (=0 as reference) 82 8 1.00 1.00 107 44 1.00 1.00 >0 79 26 2.03 (0.91-4.51) 1.46 (0.51-4.16) 201 120 1.32 (0.93-1.86) 1.16 (0.80-1.69) Cough (=0 as reference) 52 10 1.00 1.00 82 43 1.00 1.00 >0 109 24 1.31 (0.63-2.75) 0.80 (0.33-1.91) 230 125 1.19 (0.84-1.69) 0.97 (0.68-1.40) Hemoptysis (=0 as reference) 146 30 1.00 1.00 261 142 1.00 1.00 >0 15 4 2.23 (0.78-6.37) 3.01 (0.81-11.18) 50 26 1.57 (1.03-2.39)* 1.04 (0.65-1.69)
Sore Mouth (=0 as reference) 154 30 1.00 1.00 278 147 1.00 1.00
>0 7 4 3.59 (1.26-10.20)* 0.87 (0.14-5.48) 33 21 1.16 (0.73-1.84) 1.03 (0.60-1.76)
Dysphagia (=0 as reference) 144 29 1.00 1.00 257 135 1.00 1.00
>0 17 5 1.31 (0.51-3.40) 0.58 (0.15-2.27) 53 32 1.73 (1.18-2.55)** 1.06 (0.68-1.64)
Peripheral Neuropathy (=0 as reference) 108 23 1.00 1.00 213 109 1.00 1.00
>0 53 11 0.86 (0.42-1.77) 1.03 (0.41-2.59) 97 59 1.10 (0.80-1.51) 1.03 (0.73-1.46)
Hair Loss (=0 as reference) 140 29 1..00 1.00 262 137 1.00 1.00
>0 21 5 1.01 (0.39-2.62) 0.32 (0.07-1.44) 47 29 0.99 (0.66-1.47) 1.11 (0.71-1.73)
Chest Pain (=0 as reference) 107 20 1.00 1.00 183 94 1.00 1.00
>0 54 14 1.05 (0.53-2.09) 0.52 (0.21-1.32) 128 73 1.07 (0.79-1.45) 0.97 (0.70-1.34)
Pain in Arm or Shoulder (=0 as reference) 123 25 1.00 1.00 217 114 1.00 1.00
>0 37 9 0.86 (0.40-1.84) 1.19 (0.45-3.14) 93 53 1.20 (0.87-1.67) 0.96 (0.66-1.39)
Other Pain Sites (=0 as reference) 117 26 1.00 193 106 1.00 1.00
>0 41 7 0.60 (0.26-1.39) 0.38 (0.12-1.19) 106 53 1.02 (0.74-1.42) 0.96 (0.67-1.38)
Adjusted for age, sex, cancer duration, type of cancer and clinical stage (TNM stage). *:P < 0.05, **:P < 0.01, ***:P < 0.001.
time. When we considered the functioning and symptom scales of the QLQ C-30 and QLQ LC-13 separately, the emotional functioning scale and symptom scales of pain, nausea/vomiting were strong predictors with regard to survival in NSCLC patients with surgery whereas the so-cial functioning scale and symptom scales of fatigue, appe-tite loss, and financial difficulties of the QLQ C-30 were strong predictors in NSCLC patients without surgery. Using goodness of fit as the criterion, items of symptoms
on the QLQ-C30 were the strongest predictors among them. None of QLQ-LC13 scales was significant predic-tors. After simultaneously taking all significant scales of the QLQ-C30 into account, nausea/vomiting for NSCLC patients with surgery and appetite loss for NSCLC patients without surgery were the most informative variables for an improved prediction of survival, besides the traditional clinical parameters. These findings suggest that prediction of the prognosis could be improved by considering these
Table 4 Evaluation of the independent contribution of retained baseline variables for each prognostic score in NSCLC patients with surgery
Surgery HR (95%C.I.)
Variables Model 1 Model 2 Model 3 Model 4
Gender (=Male as reference)
Female 0.90 (0.31-2.66) 1.27 (0.41-3.89) 1.62 (0.56-4.68) 1.86 (0.63-5.56)
Age (yrs) (<50 as reference)
50≤ Age < 60 1.54 (0.27-8.91) 1.51 (0.26-8.93) 2.24 (0.37-13.52) 2.55 (0.43-15.11)
60≤ Age < 70 3.71 (0.65-21.23) 3.01 (0.48-19.06) 3.88 (0.73-20.71) 3.50 (0.60-20.30)
70≤ Age < 80 3.32 (0.57-19.31) 2.84 (0.46-17.65) 3.53 (0.59-20.98) 3.68 (0.63-21.63)
≥80 41.03 (4.84-347.54)*** 55.83 (5.76-541.35)*** 168.87 (13.26-2150.64)*** 283.27 (21.01-3819.27)***
Cancer duration (yrs) (≥1 as reference)
New case 2.12 (0.65-6.92) 2.13 (0.64-7.03) 2.67 (0.70-10.12) 3.34 (0.88-12.63)
Cancer duration <1 2.24 (0.60-8.40) 2.16 (0.55-8.49) 3.71 (0.84-16.41) 4.78 (1.05-21.74)*
Type of Cancer (Adenocarcinoma as reference)
Squamous Cell 1.76 (0.66-4.68) 2.39 (0.86-6.7) 2.57 (0.94-7.02) 3.62 (1.21-10.86)*
Other 5.09 (1.03-25.12)* 6.01 (1.00-35.92)* 8.25 (1.58-43.09)* 6.64 (1.12-39.39)*
Primary Tumor (T1 as reference)
T2 0.84 (0.28-2.50) 1.02 (0.33-3.20) 1.33 (0.43-4.17) 1.47 (0.45-4.81)
T3 0.94 (0.23-3.78) 1.17 (0.29-4.80) 1.38 (0.35-5.48) 1.63 (0.40-6.64)
T4 1.54 (0.35-6.79) 2.55 (0.52-12.56) 4.42 (0.92-21.22) 5.40 (0.99-29.51)
Regional Lymph Nodes (N0 as reference)
N1 2.34 (0.85-6.45) 2.98 (1.02-8.68)* 2.73 (1.01-7.42)* 3.80 (1.34-10.80)*
N2 5.32 (1.70-16.64)** 6.17 (1.88-20.19)** 5.65 (1.68-18.96)** 7.39 (2.15-25.43)**
N3 6.74 (0.51-89.64) 16.60 (0.98-282.16) 4.55 (0.32-65.68) 9.75 (0.62-153.58)
Distant Metastasis (M0 as reference)
M1 1.73 (0.27-11) 1.07 (0.16-7.39) 1.51 (0.23-9.80) 1.79 (0.29-11.21)
QLQ-C30
Emotional Functioning (<83.33 as reference)
83.33≤EFS < 100 3.36 (1.05-10.69)* 2.56 (0.82-7.96) =100 2.00 (0.67-5.96) 1.17 (0.39-3.56) Pain (=0 as reference) 0 < Pain≤22.22 0.24 (0.06-1.01) >22.22 0.83 (0.30-2.25) Nausea/Vomiting (=0 as reference) >0 0.12 (0.02-0.71)* 0.11 (0.02-0.63)* −2 log likelihood 242.88 238.26 228.77 230.68 *:P < 0.05, **:P < 0.01, ***:P < 0.001.
HRQOL scales along with the current standard clinical prognostic variables.
The nausea/vomiting scale in NSCLC patients with sur-gery and appetite loss in NSCLC patients without sursur-gery seemed to capture all the prediction after simultaneously considering all the significant scales of the QLQ-C30 and QLQ-LC13. The emotional functioning and pain scales in NSCLC patients with surgery and social functioning,
fatigue, and financial difficulties scales in NSCLC patients without surgery became insignificant, possibly because they were moderately correlated with significant scales, and they did not provide new information regarding sur-vival after these 2 significant items were considered.
Several different aspects of pretreatment HRQOL have been associated with survival in advanced cancer [13-16], breast cancer [17-19], lung cancer [5-8], oesophageal cancer
Table 5 Evaluation of the independent contribution of retained baseline variables for each prognostic score in NSCLC patients without surgery
Non-surgery HR (95%C.I.)
Variables Model 1 Model 2 Model 3 Model 4
Gender (=Male as reference)
Female 0.53 (0.36-0.79)** 0.57 (0.38-0.85)** 0.52 (0.35-0.78)** 0.55 (0.37-0.82)**
Age (yrs) (<50 as reference)
50≤ Age < 60 1.92 (1.08-3.39)* 2.02 (1.15-3.56)* 2.46 (1.38-4.36)** 2.31 (1.3-4.11)**
60≤ Age < 70 1.45 (0.86-2.44) 1.47 (0.88-2.47) 1.40 (0.82-2.39) 1.41 (0.84-2.37)
70≤ Age < 80 1.80 (1.07-3.03)* 1.91 (1.13-3.24)* 1.93 (1.12-3.32)* 1.94 (1.15-3.29)*
≥80 3.70 (1.73-7.89)*** 4.53 (2.10-9.75)*** 4.65 (2.14-10.08)*** 4.73 (2.19-10.24)***
Cancer duration (yrs) (≥1 as reference)
New case 1.19 (0.69-2.05) 1.05 (0.61-1.82) 1.28 (0.74-2.22) 1.16 (0.66-2.01)
Cancer duration <1 1.79 (1.08-2.97)* 1.70 (1.02-2.82)* 1.62 (0.97-2.69) 1.62 (0.97-2.69)
Type of Cancer (Adenocarcinoma as reference)
Squamous Cell 0.91 (0.62-1.34) 0.93 (0.62-1.37) 0.87 (0.59-1.30) 0.92 (0.62-1.37)
Other 1.20 (0.65-2.20) 1.42 (0.75-2.68) 1.23 (0.63-2.38) 1.23 (0.64-2.36)
Primary Tumor (T1 as reference)
T2 0.57 (0.28-1.16) 0.60 (0.3-1.21) 0.54 (0.27-1.08) 0.54 (0.27-1.1)
T3 1.20 (0.55-2.64) 1.20 (0.54-2.65) 1.19 (0.54-2.64) 1.17 (0.53-2.58)
T4 1.28 (0.67-2.46) 1.32 (0.68-2.55) 1.15 (0.59-2.23) 1.22 (0.63-2.35)
Regional Lymph Nodes (N0 as reference)
N1 1.06 (0.45-2.49) 0.99 (0.42-2.31) 1.12 (0.47-2.66) 1.01 (0.43-2.37)
N2 2.12 (1.24-3.61)** 1.99 (1.17-3.38)* 1.82 (1.05-3.14)* 1.87 (1.09-3.20)*
N3 2.29 (1.34-3.92)** 2.14 (1.26-3.65)** 1.85 (1.06-3.22)* 1.84 (1.06-3.18)*
Distant Metastasis (M0 as reference)
M1 1.54 (1.04-2.28)* 1.52 (1.03-2.25)* 1.37 (0.91-2.07) 1.47 (0.99-2.19)
QLQ-C30
Social Functioning (<100 as reference)
=100 0.70 (0.50-0.99)* 0.73 (0.52-1.03)
Fatigue (≤11.12 as reference)
11.12 < FAS≤33.34 1.19 (0.77-1.86)
>33.34 1.45 (0.92-2.28)
Appetite Loss (=0 as reference)
>0 1.62 (1.12-2.36)* 1.77 (1.26-2.49)**
Financial Difficulties (=0 as reference)
>0 1.43 (0.99-2.06)
−2 log likelihood 1508.53 1490.90 1475.39 1480.24
[20-22], hepatocellular cancer [23], and head and neck can-cer [24]. Even though few studies have been carried out in lung cancer patients, our results are in agreement with those in studies of lung cancer patients. Herndon et al. in a study of 206 patients with advanced NSCLC using the QLQ-C30 and Duke-UNC Social Support Scale, found that in addition to the cancer type and dyspnoea, the pain scale was a prognostic factor of survival [5]. Similarly, Langendijk et al. in a study of 198 patients treated with external irradiation using the QLQ-C30, observed that global
QOL was an independent prognostic factor, but the effect varied as a function of cancer clinical stage in a 3-year fol-low-up [6]. Montazeri et al. using the Nottingham Health Profile, the QLQ-C30 and the QLQ-LC13, reported that the global QLQ of the QLQ-C30, along with age and ex-tent of disease, were the significant predictors of 3-month survival in 129 newly diagnosed lung cancer patients [7]. Recently, Dharma-Wardene et al. using the Functional Assessment of Cancer Therapy-General (FACT-G), found that the baseline FACT-G total score was a significant Figure1 Survival curves for the baseline nausea/vomiting scores in NSCLC patients with surgery.
predictor of subsequent survival in 42 patients with advanced lung cancer planning to undergo palliative chemotherapy [8].
Previous studies indicated that pre-treatment HRQOL is a significant factor for survival time, and pre-treatment assessment of HRQOL could help physicians in their clinical decisions, as it directly relates to patients’ survival time. Our finding is that cross-sectional HRQOL of all treatment types is also a significant factor for sur-vival outcome, and this has important implications: the as-sessment of HRQOL in lung cancer patients should be integrated into clinical practice and evaluated periodically to adequately monitor the outcome of any resulting treat-ment or regular follow-up visits. In addition, the inde-pendent prognostic value of the QLQ-C30 scales for these patients suggests that a better HRQOL score, reflecting fewer symptoms of appetite loss would result in better overall survival in NSCLC patients. In our opinion, one of the therapeutic goals of HRQOL is to facilitate communi-cation between patients and doctors, and help doctors provide care based on patients’ symptoms with the aim of improving overall survival by controlling the impact of disease and preserving or improving HRQOL.
The major strengths of our study are that all of the HRQOL data were available at baseline, with a less than 5% missing rate. The clinical characteristics of these patients were similar to those of the entire population of our clinical settings. A high standard of follow-up was applied, resulting in a low rate of loss to follow-up, a large number of events, and adequate overall statistical power. Furthermore, HRQOL was assessed using multi-dimensional QOL, which would be more informative than global QOL.
Our results should be interpreted with caution because of 5 limitations. One limitation is that some of deaths could not be confirmed through follow-up phone calls and had to be confirmed through linking with the Na-tional Mortality database. The death status of some patients with a missing identification number could not be confirmed. With only a few cases being lost to follow-up and with few missing identification numbers, the error should be small. Another potential drawback is that the analyses only considered baseline HRQOL; the relationship between changes in HRQOL measures and survival could not be examined. Future studies should focus on how the changes in HRQOL measures relate to survival due to any causes. Third, the study lacked infor-mation regarding pulmonary function, comorbidity, gen-etic factors and the physical environment of these patients; hence, we cannot rule out the possibility that our findings may be confounded due to these unmeas-ured variables. Fourth, due to limited number of sample size, we could not examine the relationship between HRQOL and survival in small cell lung cancer patients.
Last, this study did not establish a causal relationship between HRQOL and survival, since an unidentified fac-tor may have been involved. HRQOL may reflect a patient’s status of disease, which has a direct effect on a patient’s survival.
Conclusion
In conclusion, our findings from this study support the use of HRQOL assessment in routine clinical practice in a NSCLC patient population. Although the data were prospectively collected, the findings are limited by the cross-sectional assessment of HRQOL. Further studies incorporating longitudinal HRQOL assessment together with clinical prognostic factors may provide additional information that may aid the patient and clinician in decision-making in NSCLC.
Competing interests
The authors declare that they have no competing interests. Authors’ contributions
TCL and CCL contributed equally to the design of the study and the direction of its implementation, including supervision of the field activities, quality assurance and control. CHT, KSL, CYC and TCH supervised the field activities. CCL and YDL helped conduct the literature review and prepare the Methods and the Discussion sections of the text. TCL, CIL SYY and CCL designed the study’s analytic strategy and conducted the data analysis. All authors read and approved the final manuscript.
Acknowledgements
This study was supported by a research grant provided by the National Science Council, Taiwan, (NSC 95-2314-B-039-024-MY2), by China Medical University (CMU96-226 and CMU97-319), and Taiwan Department of Health, China Medical University Hospital Cancer Research Center of Excellence (DOH101-TD-C-111-005).
Author details
1Graduate Institute of Biostatistics, College of Public Health, China Medical
University, Taichung, Taiwan.2Department of Healthcare Administration,
College of Health Science, Asia University, Taichung, Taiwan.3Department of
Medical Research, China Medical University Hospital, Taichung, Taiwan.
4School of Medicine, College of Medicine, China Medical University,
Taichung, Taiwan.5Department of Public Health, College of Public Health,
China Medical University, Taichung, Taiwan.6Graduate Institute of Health
Care Administration, College of Public Health, China Medical University, Taichung, Taiwan.7Cancer Center, China Medical University Hospital,
Taichung, Taiwan.8Department of Internal Medicine, China Medical
University Hospital, Taichung, Taiwan.9Bristol-Myers Squibb (Taiwan) Ltd,
Global Development & Medical Affair, Taipei, Taiwan.10Department of Psychiatry, Medical College, National Cheng-Kung University, Tainan, Taiwan.
11Department of Family Medicine, China Medical University Hospital,
Taichung, Taiwan.
Received: 13 October 2011 Accepted: 13 July 2012 Published: 15 September 2012
References
1. Annual statistics report in 2011: Republic of China from Department of Health, R.O.C: http://www.doh.gov.tw/CHT2006/DM/DM2_2.aspx? now_fod_list_no=9510&class_no=440&level_no=1.
2. Menec VH, Chipperfield JG, Perry RP: Self-perceptions of health: a prospective analysis of mortality, control, and health. J Gerontol Psychol Sci 1999, 54B(2):85–93.
3. McCallum J, Shadbolt B, Wang D: Self-rated health and survival: a 7-year follow-up study of Australian elderly. Am J Public Health 1994, 84:1100–1105.
4. Borawski EA, Kinney JM, Kahana E: The meaning of older adults’ health appraisals: congruence with health status and determinant of mortality. J Gerontol Soc Sci 1996, 51B:S157–S170.
5. Herndon JE, Fleishman S, Kornblith AN, Kosty M, Green MR, Holland J: Is quality of life predictive of the survival of patients with advanced non-small cell lung carcinoma? Cancer 1999, 85:333–340.
6. Langendijk H, Aaronson NK, de Jong JM, ten Velde GP, Muller MJ, Wouters M: The prognostic impact of quality of life assessed with the EORTC QLQ-C30 in inoperable non-small cell lung carcinoma treated with radiotherapy. Radiother Oncol 2000, 55:19–25.
7. Montazeri A, Milroy R, Hole D, McEwen J, Gillis CR: Quality of life in lung cancer patients as an important prognostic factor. Lung Cancer 2001, 31:233–240.
8. D Dharma-Wardene M, Au HJ, Hanson J, Dupere D, Hewitt J, Feeny D: Baseline FACT-G score is a predictor of survival for advanced lung cancer. Qual Life Res 2004, 13:1209–1216.
9. Fleming ID, Cooper JS, Henso DE, Hutter RVP, Kennedy BJ, Murphy GP, O’Sullivan B, Sobin LH, Yarbro JW: AJCC Cancer Staging Manual. 5th edition. Philadelphia: Lippencott-Raven Publishers; 1997.
10. Aaronson NK, Ahmedzai S, Bergman B, Bullinger M, Cull A, Duez NJ, Filiberti A, Flechtner H, Fleishman SB, de Haes JCJM, Kaasa S, Klee MC, Osoba D, Razavi D, Rofe PB, Schraub S, Sneeuw KCA, Sullivan M, Takeda F: The European Organization for Research and Treatment of Cancer QLQ-C30: a quality of life instrument for use in international clinical trials in oncology. J Natl Cancer Inst 1993, 85:365–376.
11. Bergman B, Aaronson NK, Ahmedzai S, Kaasa S, Sullivan M: The EORTC QLQ-LC13: a modular supplement to the EORTC Core Quality of Life Questionnaire (QLQ-C30) for use in lung cancer clinical trials. Eur J Cancer 1994, 30A:635–642.
12. Chie WC, Yang CH, Hsu C, Yang PC: Quality of life of lung cancer patients: validation of the Taiwan Chinese version of the EORTC QLQ-C30 and QLQ-LC13. Qual Life Res 2004, 13:257–262.
13. Dancey J, Zee B, Osoba D, Whitehead M, Lu F, Kaizer L, Latreille J, Pater JL: Quality of life scores: an independent prognostic variable in a general population of cancer patients receiving chemotherapy. The National Cancer Institute of Canada Clinical Trials Group. Qual Life Res 1997, 6:151–158.
14. Ringdal GI, Ringdal K, Kvinnsland S, Götestam KG: Quality of life of cancer patients with different prognosis. Qual Life Res 1994, 3:143–154. 15. Ringdal GI, Gotestam KG, Kaasa S, Kvinnsland S, Ringdal K: Prognostic
factors and survival in a heterogeneous sample of cancer patients. Br J Cancer 1996, 73:1594–1599.
16. Coates A, Porzsolt F, Osoba D: Quality of life in oncology practice: prognostic value of EORTC QLQ-C30 scores in patients with advanced malignancy. Eur J Cancer 1997, 33:1025–1030.
17. Coates A, Forbes J, Simes RJ: Prognostic value of performance status and quality of life scores during chemotherapy for advanced breast cancer. The Australian New Zealand Breast Cancer Trials Group. J Clin Oncol 1993, 11:2050–2051.
18. Kramer JA, Curran D, Piccart M, de Haes JC, Bruning P, Klijn J, Van Hoorebeeck I, Paridaens R: Identification and interpretation of clinical and quality of life prognostic factors for survival and response to treatment in first-line chemotherapy in advanced breast cancer. Eur J Cancer 2000, 36:1498–1506.
19. Efficace F, Biganzoli L, Piccart M, Coens C, Van Steen K, Cufer T, Coleman RE, Calvert HA, Gamucci T, Twelves C, Fargeot P, Bottomley A, EORTC-BCG-IDBBC-NDDG: Baseline health-related quality of life data as prognostic factors in a phase III multicentre study of women with metastatic breast cancer. Eur J Cancer 2004, 40:1021–1030.
20. Blazeby JM, Brookes ST, Alderson D: The prognostic value of quality of life scores during treatment for oesophageal cancer. Gut 2001, 49:227–230.
21. Fang FM, Tsai WL, Chiu HC, Kuo WR, Hsiung CY: Quality of life as a survival predictor for esophageal squamous cell carcinoma treated with radiotherapy. Int J Radiat Biol Phys 2004, 58:1394–1404.
22. Chau I, Norman AR, Cunningham D, Waters JS, Oates J, Ross PJ: Multivariate prognostic factor analysis in locally advanced and metastatic esophago-gastric cancer-pooled analysis from three multicenter, randomized, controlled trials using individual patients data. J Clin Oncol 2004, 22:2395–2403.
23. Bonnetain F, Paoletti X, Collette S, Doffoel M, Bouché O, Raoul JL, Rougier P, Masskouri F, Barbare JC, Bedenne L: Quality of life as a prognostic factor of overall survival in patients with advanced hepatocellular carcinoma: results from two French clinical trials. Qual Life Res 2008, 17:831–843. 24. de Graeff A, de Leeuw JR, Ros WJ, Hordijk GJ, Blijham GH, Winnubst JA:
Sociodemographic factors and quality of life as prognostic indicators in head and neck cancer. Eur J Cancer 2001, 37:332–339.
doi:10.1186/1471-2458-12-790
Cite this article as: Li et al.: Quality of life predicts survival in patients with non-small cell lung cancer. BMC Public Health 2012 12:790.
Submit your next manuscript to BioMed Central and take full advantage of:
• Convenient online submission
• Thorough peer review
• No space constraints or color figure charges
• Immediate publication on acceptance
• Inclusion in PubMed, CAS, Scopus and Google Scholar
• Research which is freely available for redistribution
Submit your manuscript at www.biomedcentral.com/submit