The influence of temperature and surface conditions on surface
absorptivity in laser surface treatment
Jin-Tang Wang, Cheng-I Weng,a)and Jee-Gong Changb)
Department of Mechanical Engineering, National Cheng Kung University, Tainan, Taiwan, Republic of China
Chi-Chuan Hwangc)
Department of Engineering Science, National Cheng Kung University, Tainan, Taiwan, Republic of China 共Received 16 August 1999; accepted for publication 21 December 1999兲
A one-dimensional, transient, inverse heat conduction problem is implemented to investigate the influence of temperature and surface conditions on surface absorptivity in the laser surface heating process. Analysis includes the utilization of the conjugate gradient method 共CGM兲, with temperatures measured near the heated surface. To increase efficiency and accuracy of the calculation, the result retrieved from the least-square method is used as an initial guess for the CGM. Results show that absorptivity decreases when the temperature exceeds a certain value. This decrease is related to structural transformation during the temperature rise. As the surface temperature nears the melting point, the decreasing trend inverts and absorptivity increases. This final abrupt rise is caused by the phase transformation from order to disorder. Additionally, absorptivity is related to surface conditions such as absorption-enhancing coatings and surface roughness. © 2000 American Institute of Physics.关S0021-8979共00兲02307-0兴
I. INTRODUCTION
Temperature control of a material can be said to be the most important factor in the well-known technique of laser material processing. In a simple example, surface hardening, the surface temperature must be maintained above the critical transformation temperature (Ac1) but less than the melting
point. However, such control is difficult due to the surface temperature being dependent not only on input laser power but also absorptivity of the material. In reality, absorptivity is strongly dependent on surface conditions such as coatings, surface roughness, or surface films of impurities or oxide layers. Moreover, absorptivity is also a function of tempera-ture itself. As laser processing heats a material from room temperature to near melting, there is a very large and non-linear change of absorptivity. However, the working tem-perature must be maintained above Ac1 and less than the
melting point, a requirement severely complicated by the variable absorptivity. Therefore, an understanding of the re-lation of temperature, absorptivity, and the various surface conditions is very important.
Experimental studies1–3 of pure metals have demon-strated that infrared absorptivity increases rapidly between room temperature and the melting point. In a similar experi-mental study of AISI 1045 carbon steel by Harth et al.,4 it was shown that absorptivity increases rapidly when the sur-face temperature exceeds the melting point. However, Wiet-ing and Schriempt5utilized a conventional reflectometer and observed that the absorptivities of highly polished Ti–
6Al–4V alloy and AISI 304 stainless steel are almost inde-pendent of the temperature. Wieting and DeRosa6also stud-ied AISI 304 stainless steel by laser calorimetry and found that when the surface is annealed, the absorptivities of the highly polished surface and rougher surfaces are nearly the same over the range from room temperature to 100 °C. In a recently published book, Steen,7pointed out that both tem-perature and surface conditions may have a significant effect on the absorptivity from the viewpoint of fundamental phys-ics. Thus, there seem to be inconsistencies in the aforemen-tioned literature. In our related research, we used the inverse technique of direct sensitivity coefficients to solve a two-dimensional, quasistatic, moving-plate problem regarding the laser surface hardening process. Our previous results showed that coatings influence absorptivity significantly. Since a quasistatic model was used, the surface absorptivity was ob-tained by dividing the inverse estimation of the surface heat flux by the assumed input power of a Gaussian distribution. Using this technique presents surface absorptivity in the av-erage sense.8 Therefore, discussions of temperature effects on surface absorptivity could not be included in our previous work.
The reliability and accuracy of analytical or numerical solutions are dependent on the certainty of the boundary con-ditions. However, these conditions are usually unknown a
priori because such conditions are hard to measure in
prac-tical engineering problems. This is the source of much of the focus on this kind of problem, the so-called inverse prob-lems. In recent years, there has been a great deal of devel-opment and application of inverse heat conduction problems in engineering. There are two widely used methods, namely, the least-square method 共LSM兲,9 and the conjugate gradient method共CGM兲.10Comparison of both methods indicates that
a兲Author to whom correspondence should be addressed; electronic mail: [email protected]
b兲Electronic mail: [email protected] c兲Electronic mail: [email protected]
3245
each method has relative superiority for certain boundary conditions and material properties.11 Generally, the CGM is better than the LSM in treating nonlinear heat conduction equations in which the conductivity and specific heat of the material are functions of the temperature. The CGM is es-sentially an iterative regularization scheme in which an ini-tial guess for the iterations must be chosen. The iniini-tial guess is difficult to determine. If the initial guess is not properly chosen, convergence is difficult or impossible to attain.
The main object of this study is to use the inverse finite-element method to investigate the influence of temperature and surface conditions on surface absorptivity in laser sur-face treatment. The CGM is herein adopted as the inverse technique for taking into account material properties vari-ance over a wide range of working temperatures. For over-coming the CGM convergence difficulties, the LSM solution is used as a CGM initial guess, to increase the efficiency and accuracy of the calculation. Experiments are also conducted to provide the measured temperature response of a fixed point near the heating surface as input information for the inverse method. Finally, a discussion of the influence of tem-perature and surface conditions on surface absorptivity is presented.
II. THE FINITE-ELEMENT FORMULATION OF THE DIRECT PROBLEM
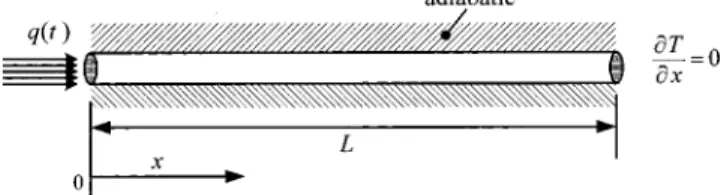
Without loss of generality, a one-dimensional laser heat-ing problem is defined to investigate the influences on sur-face absorptivity. A long rod with a small diameter is heated at one end by a laser beam and its circumference is insulated by the highly adiabatic materials, glass fiber, and asbestos. This insures that the defined one-dimensional model is close enough to the real situation. The geometry of the present idealized model is depicted in Fig. 1. The governing equation for temperature distribution T(x,t) is
c共T兲T t ⫽ x
冋
k共T兲 T x册
, 0⬍x⬍L, t⬎0, 共1兲and the initial and boundary conditions are
T共x,0兲⫽T0, 0⭐x⭐L, 共2兲
⫺k„T…Tx⫽q共t兲, x⫽0, 0⭐t⭐tm, 共3兲 T
x⫽0, x⫽L, 0⭐t⭐tm, 共4兲
where x and t are spatial and time-domain variables; k(T) is the heat conductivity; is the density; c(T) is the specific heat; q(t) is the input heat flux of the laser beam; T0 is the
initial temperature; L is the length of the rod, which is long enough to insure zero-temperature gradient at the end; and tm is the time that the laser beam application is terminated.
For finite-element formulation, let the region S be dis-cretized by a system of finite-element domain Se with
un-known temperatures. The approximate solution throughout the solution domain at time t is given by
T共x,t兲⫽
兺
i⫽1 neNiTi⫽兵N其T兵T其, 共5兲
where ne is the number of the solution domain; Ni are the
linear interpolation functions defined piecewise element by element; and 兵T其 is the column vector containing the nodal temperatures. Through the standard derivation of the finite-element method, the equations of the discretized system are assembled into one equation with global conductivity matrix 关K兴, capacitance matrix 关C兴, and force vector兵F其, as
关C兴兵T˙其⫹关K兴兵T其⫽兵F其, 共6兲 where 关C兴⫽
兺
i⫽1 ne冕
se c共T兲兵N其兵N其Tds, 共7兲 关K兴⫽兺
i⫽1 ne冕
se k共T兲兵N其,xT兵N其,xds, 共8兲 关F兴⫽兺
i⫽1 ne k共T兲兵N其,xT兵T其兩x i xi⫹1 . 共9兲To solve Eq. 共6兲, an implicit Galerkin scheme is em-ployed in this analysis and the time step (n⫹␣) of the tem-perature is approximated by
兵T其n⫹␣⫽␣兵T其n⫹1⫹共1⫺␣兲兵T其n, 共10兲 where ␣⫽2/3 for the Galerkin scheme. Therefore, the ap-proximation of the nodal temperature is calculated by
关␣关K兴⫺关C兴/⌬t兴兵T其n⫹1⫽⫺关共1⫺␣兲关K兴⫹关C兴/⌬t兴 ⫻兵T其n⫹兵F其n⫹␣. 共11兲 III. DESCRIPTION OF THE INVERSE METHOD
The heat flux q(t) is unknown, and the temperature mea-surements at a point beneath the heated surface are at all times considered to be known. The inverse method is used to predict the surface heat flux from the knowledge of these temperature measurements, and are accomplished by the use of the CGM. This method is well established, and has been proven to be stable and accurate.12 It includes the direct problem, sensitivity problem, and adjoint problem which will be described as follows.
A. Sensitivity problem
The solution of Eqs.共1兲–共4兲 with q(t) being unknown is treated as a problem that minimizes the functional defined by
J共q兲⫽
冕
0tm
关T共x1,t兲⫺Y共x1,t兲兴
2dt, 共12兲
where T(x1,t) is the estimated temperature at a specific po-sition x⫽x1 obtained from computing the solution of the direct problem by using the estimated values of q(t), while
Y (x1,t) is the measured temperature at the location x⫽x1. It is assumed when the boundary condition q(t) under-goes a perturbation ⌬q(t), the temperature T(x,t) is changed by an amount⌬T(x,t). Replacing T by T¯⫹⌬T, and
q by q¯⫹⌬q in the direct problem, the determination of ⌬T is
then obtained as t关c共T¯兲⌬T兴⫽ 2 x2关k共T¯兲⌬T兴, 0⬍x⬍L, t⬎0, 共13兲 ⌬T共x,0兲⫽0, 0⭐x⭐L, 共14兲 ⫺k共T¯兲⌬Tx ⫽⌬q共t兲, x⫽0, 0⭐t⭐tm, 共15兲 ⌬T x ⫽0, x⫽L, 0⭐t⭐tm. 共16兲 B. Adjoint problem
In order to obtain the adjoint problem, multiply Eq.共1兲 with the adjoint function (x,t), and integrate it over the space and time domains. Adding the result to Eq. 共12兲, the variation of the functional⌬J is then obtained as
⌬J共q兲⫽
冕
0 L冕
0 tm 2关T共x,t兲⫺Y共x,t兲兴⌬T共x,t兲 ⫻␦共x⫺x1兲dtdx⫹冕
0 L冕
0 tm 共x,t兲再
2 x2关k共T兲⌬T兴 ⫺t关c共T兲⌬T兴冎
dtdx, 共17兲where ␦() is the Dirac delta function. Using integration by parts and utilizing the boundary conditions, the following adjoint problem is obtained for the determination of the ad-joint function (x,t): k共T兲 2 x2⫹2共T⫺Y 兲␦共x⫺x1兲⫹c共T兲 t ⫽0, 0⬍x⬍L, t⬎0, 共18兲 共x,tm兲⫽0, 0⭐x⭐L, 共19兲 共0,t兲 x ⫽0, 0⭐t⭐tm, 共20兲 共L,t兲 x ⫽0, 0⭐t⭐tm, 共21兲 ⌬J is determined as ⌬J⫽
冕
0 tm 共0,t兲⌬qdt. 共22兲By comparing the expression of⌬J with its definition,13 we have
J
⬘
共t兲⫽共0,t兲. 共23兲C. Inverse solution by the CGM
Assuming the functions T(x,t), ⌬T(x,t), (x,t), and
J
⬘
(t) are available at the jth iteration, the heat flux q(t) at step j⫹1 is determined fromqj⫹1⫽qj⫺jPj, j⫽0,1,2, . . . , 共24兲
where j is to determine the step size in going from qj to
qj⫹1, and is determined by j⫽兰0 tm 关T共qj兲⫺Y 兴⌬T共⌬qj兲dt 兰0 tm 关⌬T共⌬qj兲兴2dt , 共25兲
and Pj is the direction of decent, determined from
Pj⫽J
⬘
j⫺␥jPj⫺1, with␥0⫽0, 共26兲 where␥j is the conjugate coefficient computed from␥j⫽兰0 L兰 0 tm 共J
⬘
j⫺J⬘
j⫺1兲J⬘
jdtdx 兰0 L兰 0 tm 共J⬘
j⫺1兲2dtdx . 共27兲 D. Condition of convergenceSince the observed temperature information contains measurement errors, the discrepancy principle14for terminat-ing the iteration process is utilized. The stoppterminat-ing criteria are obtained as J共qj⫹1共t兲兲⫽
冕
0 tm 共T⫺Y 兲2dt⬍冕
0 tm 2dt⫽⑀2, 共28兲 where is the standard deviation of the measurement error,⬵T共x1,t兲⫺Y共x1,t兲. 共29兲
E. Initial guess of the CGM
If q(t) cannot be predicted at the final time t⫽tm,
prob-lems arise. It is clear from setting(x,tm)⫽0 and␥0⫽0, Eq. 共26兲 yields Pj⫹1(t
m)⫽qj, j⫽1,2,..., which means qj⫹1(tm)
is always equal to the initial value of q0(tm). Herein, this
difficulty is avoided by first using the LSM to obtained the value for the CGM initial guess.
The LSM selects qmto achieve the closest agreement in
a least-square sense between the estimated and measured temperatures at position x⫽x1in a specific time interval, and it is to minimize the following function:
f共qm兲⫽
兺
i⫽0 mr共Tm⫹i⫺Ym⫹i兲2, 共30兲
where mr denotes the number of future temperatures that is used to insure the accuracy. By minimizing the function
f (qm) and taking a Taylor’s series expansion of Tm⫹i at a
time step of tm⫺1 for a change of the heat flux ⌬q⫽(qm ⫺qm⫺1), then the heat flux qmat the minimum of f (qm) can
be solved as
qm⫽qm⫺1⫹
1 ⌬M i
兺
⫽0mr
共Ym⫹i⫺Tm*⫹i兲 Tm⫹i
qm
, 共31兲 where
⌬M⫽
兺
i⫽0 mr冉
Tm⫹i qm冊
2 , 共32兲and the notation Tm*⫹i means the temperature evaluated by using qm⫺1 at time tm⫺1, and the termTm⫹i/qmis called the sensitivity coefficient.
IV. NUMERICAL TESTING AND ERROR ANALYSIS OF THE INVERSE METHOD
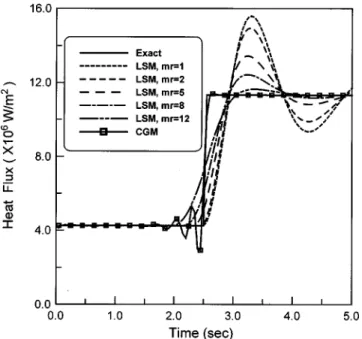
In formulating the finite-element scheme, variable mesh sizes with smaller ones near the heated surface and a three-node element with quadratic shape function are used. First, the step type of surface heat, shown as in Fig. 2, is tested to verify the accuracy of the inverse analysis. The testing ma-terial is AISI 1045 carbon steel and its heat conductivity and specific heat, based on the material’s handbook,15 are corre-lated as shown in Table I.
Temperatures calculated by the direct method at a posi-tion of 1 mm below the heated surface are taken as the mea-surement data and are put into the inverse analysis to obtain the surface heat flux. Figure 2 displays the results for the CGM and LSM with different numbers of future temperature
mr. From the comparison of these results, the LSM solution
is significantly dependent on the choice of the future tem-perature. The inverse solution approaches the true solution when the future temperature is suitably chosen. In this case, it seems that mr⫽12 is the best choice of the future tem-perature. However, the best choice is unknown in advance. The CGM inverse solution shows reasonable agreement with the real one, except for some overshoots near the left side of the jump discontinuity.
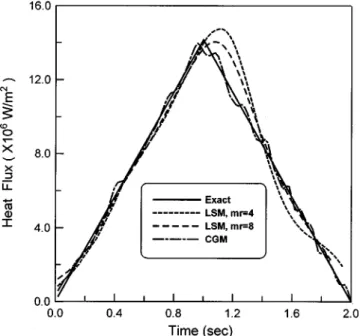
The result of a similar test of continuous types of heat flux 共e.g., sinusoidal type兲, is shown in Fig. 3. The LSM solution cannot approach the true solution in both the initial and final time intervals whatever the values of mr. As a consequence, the CGM solution is superior to the LSM in this case. However, in the authors’ experiences, the CGM computational time is much longer than the LSM, depend-ing, however, on the initial guess. The LSM solution may not be close to the true solution with a bad choice of mr; never-theless, it is excellent for use as an initial guess. Therefore, the CGM is used in this study, with the LSM result serving as an initial CGM guess.
In evaluating the influence of measurement, calibration, and truncation errors, a simulation with the combination of errors is tested. Consider the measurement to be given by
T⫽Texact⫹⫾2, 共33兲
where Texact represents the exact temperature found by the real heat flux in the direct problem; is a random number having a range between⫺2.576 and 2.576. Figure 4 depicts the results with ⫽1.5 °C, error of calibration⫽2 °C, and measurement truncated after the decimal point. It is seen that the CGM inverse estimation shows reasonable agreement with the real one.
FIG. 2. Comparison of inverse heat flux between the CGM and LSM for a step function.
TABLE I. Thermal properties of AISI 1045 and AA 1100.a
Thermal
property AISI 1045 AA 1100 Unit
0.038479T⫹56.2029, 0 °C⭐Tb⭐800 °C Thermal 222 W/m °C 0.0095T⫹17.82, T⬎800 °C Conductivity共k兲 Specific heat共c兲 0.213051T⫹442.508 904 J/kg °C Density () 7810 2710 kg/m3
aThe thermal properties of AISI 1045 and AA 1100 are from Ref. 15. bTemperature.
FIG. 3. Comparison of inverse heat flux between the CGM and LSM for a sinusoidal function.
V. EXPERIMENTS
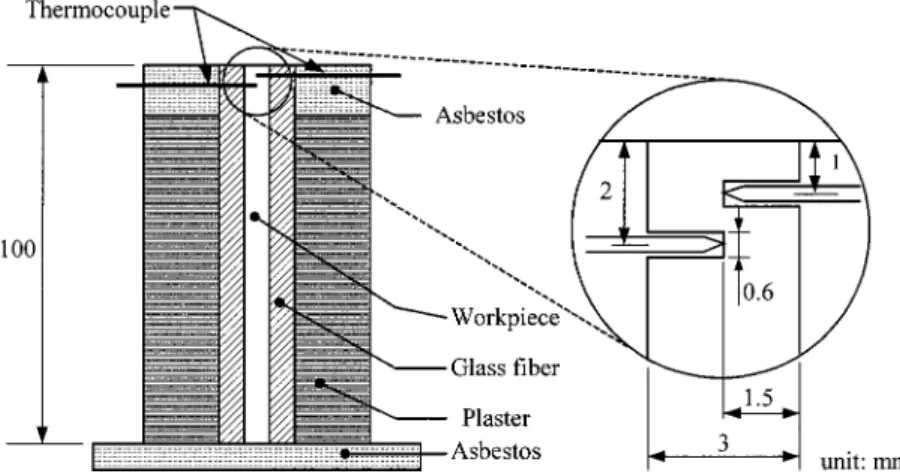
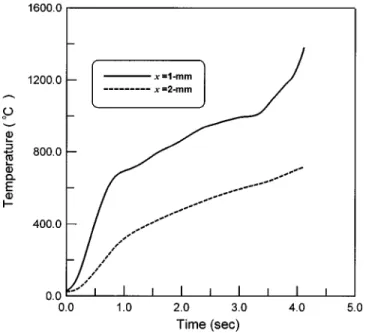
Sketches of the experimental arrangement and piece are shown in Figs. 5 and 6. The materials of the work-pieces are AISI 1045 carbon steel and AA 1100 aluminum alloy. The material properties, various surface coatings, and treatments of the workpieces are shown in Tables I and II. The laser source is a CO2continuous-wave laser共PRC laser; maximum power density, 3 KW; wavelength 10.6 m兲 and with a spot diameter of 2.8 mm. Two thermocouples共K type; diameter, 0.11 mm; measurement range;⫺200–1400 °C兲 are inserted near the heated surface and connected to an analyz-ing recorder共Yokogawa, Japan, model 3655E兲 and personal computer with GP-IB card for online downloading of data from the experiment. The measurement temperatures at a depth of 1 mm from the heated surface for different surface conditions are shown in Figs. 7 and 8. Figure 9 is the mea-surements at depths of 1 and 2 mm for the AISI 1045 sample with the surface grinding treatment.
VI. RESULTS AND DISCUSSION
The measurement data, Figs. 7–9, are taken as the known temperature in the interior of the domain. These mea-surements are substituted into the inverse analysis to obtain the surface heat flux q(t), Then, the surface temperature
T(0,t) can be determined by using the direct method. The
surface absorptivity (t), using the same definition as in Ref. 1, is obtained as a function of temperature. Before going into a detailed discussion of the observed data, a comparison of the surface temperature inversely obtained from the indi-vidual measurement of two different sensor locations, Fig. 9, is used to evaluate the feasibility of the present model. It is seen from Fig. 10 that there is a reasonable agreement be-tween two inverse solutions gained from the measurements of the two distinct locations. This implies that the present one-dimensional model, as well as the present methodology, is quite acceptable for the estimation of the surface tempera-ture and surface heat flux of the laser heating process.
The surface heat flux is inversely obtained from the mea-surements shown in Figs. 7 and 8. These are illustrated in Figs. 11 and 12 for AISI 1045 and AA 1100, respectively. These results show that the heat fluxes, except for the graph-ite coating and polishing treatment of AA 1100, suddenly increase to their highest values within the time interval of the first second, after which the peak values suddenly decrease. This abrupt negative change in the heat flux slope for the polished samples is minimal relative to the alternative sur-face treatments for both samples. Clearly, the coating layers as well as the grinding treatment increase the absorptive ca-pacity of the material. In Fig. 12, the maximum value of the FIG. 4. Test of combinations of various errors for the CGM and LSM.
FIG. 5. Schematic diagram of experi-mental arrangement.
TABLE II. Various surface treatments for AISI 1045 and AA 1100.
Surface treatment AISI 1045 AA 1100
Polishing treatment 冑a Ãb Grinding treatment 冑 à Black paint 冑 à NaOH treatment 冑 冑 Manganese phosphate 冑 à Graphite coating à 冑 a冑 done. bà undone.
heat flux for the NaOH-treated sample is approximately seven times that of the polished sample, indicative of the importance of the surface treatment on absorptivity. It is to be remembered that these coatings work only in conjunction with the inherent characteristics of the material, which, how-ever, are greatly affected by the surface conditions. As illus-trated in Fig. 12, the heat flux of the polished AA 1100 increases monotonously with time. By contrast, the heat flux of NaOH-treated AA 1100 suddenly increases to its highest value and then decreases. In this case, the thermal behavior is somewhat like the behavior of the polished AISI 1045, even though the AA 1100 thermal diffusivity is about nine times the value of the AISI 1045, on average, from 100 to 800 °C. The decreasing slope after the heat flux reaches its highest value and the final dramatic rise will be discussed later.
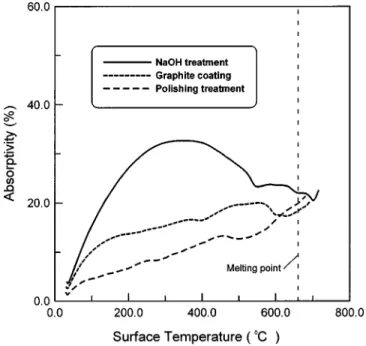
The absorptivity of both AISI 1045 and AA 1100 versus surface temperature are shown in Figs. 13 and 14, respec-tively. These results are obtained by dividing the heat flux values retrieved from the Figs. 11 and 12 by laser input power and then transformed time x axis to surface tempera-ture via the inversely obtained temperatempera-ture response of the
surface. Thus, the shapes of Figs. 11 and 13 as well as Figs. 12 and 14 are similar to each other in some sense. As shown in Fig. 13, absorptivity is maximum for ground AISI 1045, followed in decreasing order by NaOH treatment, black paint, manganese phosphate, and polishing, for the tempera-ture range 0–800 °C. Similar results for AA 1100 are drawn from Fig. 14, with maximum absorptivity being attained by NaOH, followed by graphite coating and then polishing.
In the following paragraphs, the absorptivity issue will be separated into two parts, the temperature effects and sur-face conditions effects.
A. Temperature effect
In general terms, absorptivity increases when the tem-perature of the material increases. This is due to the tempera-ture rise causing more phonon–electron energy exchanges in the phonon population rather than causing the electrons to oscillate and radiate. The curve for polished AISI 1045 in Fig. 13 shows this tendency as it builds towards its peak, but FIG. 6. Schematic illustration of arrangement of experi-mental workpiece.
FIG. 7. Measurement temperature of AISI 1045, at x⫽1 mm, for various surface conditions.
FIG. 8. Measurement temperature of AA 1100, at x⫽1 mm, for various surface conditions.
then shows a contrary tendency. A similar result is obtained for polished AA 1100 in Fig. 14, but the tendency is not so obvious. A similar result had been reported in Ref. 16, which shows absorptivity decreases when the temperature increases beyond a certain value. However, Ref. 16 does not explain clearly why this happens.
From classical electromagnetic theory, photon energy is absorbed unless its frequency is close to the resonant fre-quency of the lattice共phonon兲. Lattice vibrations are mainly driven by the formation or changes of a local dielectric po-larization of the crystal, induced by infrared photons. How-ever, phonon frequencies and linewidths, and the intensities of the peaks in the vibration spectrum, are sensitive to the detailed structural changes of the crystal, which has a strong
dependence on the temperature.17As a consequence, the de-creasing tendency of absorption reflects changes of the reso-nant frequencies of the phonons or their related intensities as affected by structural changes during the temperature rise. Obvious evidence is given by AISI 1045’s structural trans-formation from a body-centered-cubic 共bcc pearlite兲 to a face-centered-cubic 共fcc austensite兲 structure at transforma-tion temperature Ac1, approximately 750 °C.
Compared with the literature,4 slightly different results are obtained regarding the final abrupt increase of absorptiv-ity found when the temperature nears the melting point. By inspection of Fig. 13, it is concluded that the absorptivity begins its dramatic increase slightly before the surface melts. FIG. 9. Measurement temperature of AISI 1045, with grinding treatment, at
different depths, x⫽1 and and 2 mm.
FIG. 10. Inverse surface temperature from two different sensor locations,
x⫽1 and 2 mm.
FIG. 11. Prediction of surface heat flux of AISI 1045 for various surface conditions.
FIG. 12. Prediction of surface heat flux of AA 1100 for various surface conditions.
In Ref. 4, the increase is found slightly after the melting point. From a microscopic viewpoint, the estimated melting point is achieved when the atomic-mean-square displace-ment due to thermal vibrations is a significant fraction of approximately 25% of the lattice constant, known as the Lin-demann criterion. This also implies that the surface atoms disorder 共melt兲 at significantly lower temperatures than the bulk melting temperature.18As a consequence, our obtained result of a sudden increase of the absorptivity in advance of the melting point is revealed in this physical evidence. This result, in fact, is consistent with Ref. 4. It should be noted
that, as evidenced in the experiments of Harth et al., they also found that it is hard to avoid surface melting in the laser hardening process.
At a temperature sufficiently close to the melting point, between the traditional solid and liquid phases, we find it useful to consider that a semisolid subphase is occurring. This semisolid phase is assumed to be characterized by spon-taneous surface roughening, the produced rougher surface having the effect of increasing the absorptivity, as will be discussed in the next section. Further, additional energy is absorbed to break the bonding energy for the transformation from ordered to disordered phases. These two effects com-bine and cause the sudden increase of absorptivity at the final, but still solid, stage.
B. Surface conditions
Figure 13 shows, for the surface treatments used in this study as well as for increased surface roughness, a general increase in surface absorption. In addition, the negative-sloped portion of the curve is enhanced. The difference of the absorptivity between the polished and ground treatment basically arises from the effects of the surface roughness. The rougher surface has higher absorption owing to the greater probabilities of multiple reflections in the undula-tions. Note that in this experiment, grinding treatment used 600 mesh abrasive paper, particle size, 14 m, to roughen the surface. Thus, the surface was rougher than that obtained by polishing, which used an abrasive medium of water and abrasive particles, Al2O3, size 3m. As expected, grinding yielded a higher absorptivity than polishing.
Comparison of absorptive ability was made for the fol-lowing materials and coatings, the coatings being presented in order of decreasing absorptive ability: for AISI 1045, NaOH treatment, black paint, and manganese phosphate; for AA 1100, NaOH treatment and graphite coating. In addition to the differences in their general absorptive magnitudes, the specific curve detailed behavior is also influenced by the dif-ferent coatings. As a special note, NaOH treatment for AA1100 results in a rough surface, similar to corrosion. The same treatment on AISI 1045 results in a smooth black coat-ing. This may explain why the absorptivity is higher for NaOH treatment of AA 1100.
VII. CONCLUSION
In this article, an inverse numerical method accompany-ing experiments is provided to analyze the surface absorptiv-ity of AISI 1045 and AA 1100 with different coating layers and surface roughnesses. An important feature of this imple-mentation of the inverse heat conduction problem is its sim-plicity and efficiency, as opposed to the complicated conven-tional experimental method. From this study, several important conclusions are drawn.
共1兲 Surface absorptivity increases as the temperature in-creases at the beginning of the laser heating process, and then decreases when the temperature exceeds a certain value. The negatively sloped portion of the curve is due to struc-tural transformations that change the resonant frequencies and reduce the amplitudes of the resonant peaks.
FIG. 13. Surface absorptivities of AISI 1045 with the surface temperature for various surface conditions.
FIG. 14. Surface absorptivities of AA 1100 with the surface temperature for various surface conditions.
共2兲 Surface conditions like coating layers and surface roughness have a significant influence on surface absorptiv-ity. In general, the surface treatments tested, as well as in-creasing surface roughness, elevated the absorptive ability of the material.
共3兲 The surface treatments tested, as well as increasing surface roughness, enhanced the negatively sloped portion of the absorptivity curve.
The above conclusions are consistent with Steen,7 who pointed out that surface conditions, as well as temperature, have a significant influence on the absorptivity. This study found that temperature plays an important role in the surface absorptivity, presumably via the structural changes induced by temperature. Since the absorptivity of a material is essen-tially a surface phenomenon, it is difficult to further interpret the real causes of occurrence without the aid of a micro-model. The presented results regarding the various relation-ships between surface absorptivities, surface conditions, and surface temperature, however, may be useful as a reference for realistic laser material processing, and of theoretical value for further research.
ACKNOWLEDGMENTS
The authors gratefully acknowledge the support to this research by the National Science Council, Republic of
China, under Grant Nos. NSC83-0422-E006-007 and NSC89-2212-E006-024.
1T. J. Wieting, Bull. Am. Phys. Soc. 19, 339共1974兲. 2J. E. Robin and P. Nordin, Appl. Phys. Lett. 27, 493共1975兲. 3
J. A. McKay and J. A. Rayne, Phys. Rev. B 13, 673共1976兲.
4G. H. Harth, W. C. Leslie, V. G. Gregson, Jr., and B. A. Sanders, J. Met.
28, 5共1976兲.
5T. J. Wieting and J. T. Schriemph, J. Appl. Phys. 47, 4009共1976兲. 6
T. J. Wieting and J. L. DeRosa, J. Appl. Phys. 50, 1071共1979兲. 7
W. M. Steen, Laser Material Processing共Springer, London, 1991兲. 8Y. S. Sun, C. I. Weng, T. C. Chen, and W. L. Li, Jpn. J. Appl. Phys., Part
1 35, 3656共1996兲.
9J. V. Beck, Int. J. Heat Mass Transf. 13, 703共1970兲. 10
O. M. Alifanov and V. V. Mikhailov, J. Eng. Phys. 35, 1501共1978兲. 11J. V. Beck, in Inverse Problems in Engineering, edited by N. Zabaras, K.
A. Woodbury, and M. Raynaud共United Engineering Trustees, New York, 1993兲, p. 23.
12C. H. Huang, M. N. Ozisik, and B. Sawaf, Int. J. Heat Mass Transf. 35, 779共1992兲.
13O. M. Alifanov, J. Eng. Phys. 26, 471共1974兲. 14H. W. Engl, J. Optim. Theory Appl. 52, 209共1987兲.
15A. Goldsmith, T. E. Waterman, and H. J. Hirschhorn, Handbook of Ther-mophysical Properties of Solid Material共Macmillan, New York, 1961兲. 16
W. Jupner, W. Rohte, G. Sepold, and K. Teske, DVS Berichte 63, 222 共1983兲.
17M. T. Dove, Introduction to Lattice Dynamics 共Cambridge University Press, New York, 1993兲.
18
A. Zangwill, Physics at Surfaces 共Cambridge University Press, Cam-bridge, 1988兲.