Jen-Che Hsu and Kwang-Lung Lin
Department of Materials Science and Engineering, National Cheng-Kung University, Tainan, Taiwan 701, Republic of China
(Received 4 April 2003; accepted 25 June 2003)
The type and magnitude of stress in electroless Ni–Cu–P deposits on Al were manipulated by controlling the concentration of saccharin in the plating solution.
Tensile, zero, and compressive stress of the electroless Ni–Cu–P deposits was obtained with 0, 8, and 10 g/l saccharin for studying the effect of stress on the diffusion and crystallization behavior of the deposit. The effect of stress on the diffusion behavior of Cu, Ni, and Al elements during annealing was investigated. Interdiffusion between Al and Ni in an amorphous Ni–Cu–P/crystal Al diffusion couple is abated by the effects of amorphous structure, atomic affinity, and backstress. Therefore, the effect of stress on diffusion is manifested by Cu elemental diffusion. The tensile stress promotes the formation of Ni
3P and the diffusion of Cu into the substrate.
I. INTRODUCTION
The electroless nickel (Ni) deposit has been success- fully applied as a diffusion barrier in electronic packag- ing owing to its amorphous structure and the low reaction rate between Ni- and Sn-based solders.
1The electroless Ni–Cu–P deposit was found to be superior to electro- less Ni–P in properties like electrical conductivity,
2magnetism,
3thermal stability,
4corrosion resistance,
5and solderability.
6Nevertheless, the practical application of electroless Ni–Cu–P deposits still encounters the prob- lem of excess intrinsic tensile stress, 400–600 MPa /m for electroless Ni–Cu–P deposits in comparison to 10–40 MPa /m for electroless Ni–P.
7In this present work, the huge stress of the Ni–Cu–P deposit resulted from nodule coalescence during growth,
8as evidenced by the effect of stress on diffusion.
Intrinsic stress in electroless Ni–Cu–P deposits is af- fected by factors such as the substrate, the plating solu- tion, the additives, and the plating temperature. The use of additives is one of the most noticeable ways to control intrinsic stress in a deposit. In the case of electroless Ni deposits, inorganic salts such as sulfate and chloride,
9brighteners of the second class such as aldehydes, acety- lene, and dyes with radicals of C–N or N ≡ N,
10were mentioned as increasing tensile stress in deposits. In con- trast, sulfamate and brighteners of the first class were reported to retard tensile stress.
10Saccharin (C
7H
5NO
3S) also has been reported to be effective in stress relaxation of electroless Ni–Cu–P deposits.
8Intrinsic tensile stress in the deposit will cause peeling and cracking, and will accelerate stress corrosion. The effect of stress on diffusion is of interest in understanding the adhesion between a deposit and the substrate.
Diffusional creep (Naborro–Herring or Coble creep) and dislocation climb are classic examples of stress effects on diffusion.
11This present work investigates diffusion be- havior with respect to the different types of stress and attempts to determine the influence of internal stress on the elemental diffusion in Ni–Cu–P deposits on Al.
II. EXPERIMENTAL
One side of the 99.5% purity Al substrate, 50 × 25 × 0.1 mm, was deposited with 5 m of electroless Ni–
Cu–P for stress measurement. The opposite side of the Al
substrate was coated with 5 m of negative photoresist
film with a spin coater before electroless deposition. The
Al substrate was consecutively degreased in 5 wt.% so-
dium hydroxide (NaOH), deoxidized in 10 vol% nitric
acid (HNO
3), rinsed with deionized water, and zincated
in a zincating solution composed of 120 g/l NaOH, 20 g/l
zinc oxide (ZnO), 1 g/l sodium nitrate (NaNO
3), and
50 g/l sodium gluconate (CatC
4H
4KNaO
6–4H
2O). Thus
prepared, the substrate was deposited in the Ni–Cu–P
deposition solution at 90 °C with stirring for 30 min. The
plating solution consists of 15 g/l nickel sulfate (NiSO
4–
6H
2O), 0.2 g/l copper sulfate (CuSO
4–5H
2O), 15 g/l so-
dium hypophosphite (NaH
2PO
2–H
2O), 30 g/l sodium
citrate (Na
3C
6H
5O
7· 2H
2O), 40 g/l ammonium chloride
(NH
4Cl), and approximately 0–12 g/l saccharin
(C
7H
5NO
3S). Saccharin was added to control the internal
stress of the deposit. The initial pH value of the bath was
adjusted with ammonia to be 8.0. The specimens were
aged at 150 °C for up to 3000 h to investigate the effect
of internal stress on elemental diffusion across the sub-
strate deposit interface.
The magnitude of internal stress within the electroless Ni–Cu–P deposit was calculated by using the following equations:
12,13
i= E
s共h
s+ Rh
f兲
36h
sh
f共1 −
s兲 ⳯
1 r R = E
fⲐ 共1 −
f兲
E
sⲐ 共1 −
s兲 r = l
2+ 4L
28L , (1)
where E
sis the Young’s modulus of the Al substrate, R is the ratio of the Young’s modulus of the Ni–Cu–P deposit to that of the Al substrate,
sis the Poisson ratio of the Al substrate, h
sis the thickness of the Al substrate, h
fis the thickness of the Ni–Cu–P deposit, r is the radius of the curvature, l is the length of the Al substrate, and L is the net change in bow-out. The Young’s moduli of the Ni–Cu–P deposit and the Al substrate are 60 GPa
7and 68.3 GPa,
14respectively. The Poisson ratios of the Ni–
Cu–P deposit and the Al substrate are 0.3 and 0.34, re- spectively.
15The influence of negative photoresist film on stress was ignored.
Scanning electron microscopy (SEM), atomic force microscopy (AFM), and a glancing incident x-ray dif- fractometry were applied for investigating the surface morphology and microstructure of the electroless Ni–
Cu–P deposits. The composition variation of nickel, cop- per, and phosphorus elements in the coatings was investigated by electron probe x-ray microanalysis (EPMA) and energy-dispersive spectrometry.
III. RESULTS A. Before aging
1. Microstructure of the deposit
The results of energy-dispersive spectrometer analysis show that the composition of the deposit is 82(wt.%)Ni–
6.2(wt.%)Cu–11.8(wt.%)P for the SEM investigation, as shown in Fig. 1. The deposit exhibits nodular surface morphology, as seen in Fig. 1. The thickness of the de- posit is approximately 10 m. The deposits obtained with saccharin addition from 0 to 10 g/l are amorphous, as characterized by x-ray diffraction (XRD). Examples of the amorphous characteristics are to be presented in Sec. III. B. 4.
2. Properties of the deposit
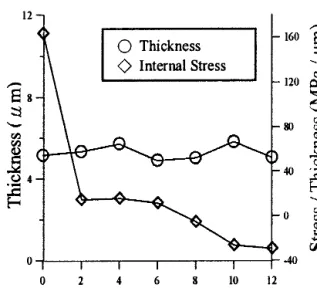
Figure 2 shows the stress and microhardness of elec- troless Ni–Cu–P deposits with respect to saccharin concentration before aging. The deposit thickness is in the range of 4.9–5.8 m after 30 min of deposition. The addition of saccharin does not show an evident effect on the thickness value. Yet, the tensile stress per unit of
deposit thickness decreases sharply when adding 2 g/l saccharin in solution. The deposit reaches zero stress at the addition of 8 g/l saccharin. The addition of saccharin at amounts above 8 g/l (i.e., 10 and 12 g/l) resulted in compressive stress.
B. After aging
1. Microstructure of the deposit
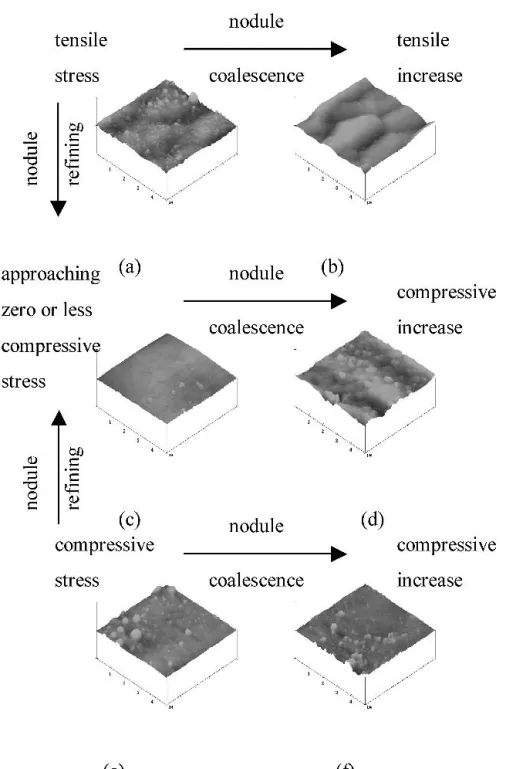
Figure 3 shows the AFM morphologies of the Ni–
Cu–P deposits obtained with 0, 8, and 10 g/l saccharin before and after aging for 1000 h. A comparison between Figs. 3(a) and 3(b) of tensile specimens indicates that tiny nodules at the outermost surface merge with the underlying
FIG. 1. SEM micrograph of Ni–Cu–P deposit obtained with 0 g/l saccharin.
FIG. 2. Stress, microhardness, and thickness of the as-deposited Ni–
Cu–P deposit with respect to saccharin concentration.
large nodules after 1000 h of aging. On the contrary, as seen in Figs. 3(c)–3(f), flat and compressive specimens seem to form some tiny bumps on the surface after annealing.
2. Stress in the deposit
Figure 4 shows the stress variation on aging of Ni–
Cu–P deposits obtained with various saccharin concen- trations. Evidently, tensile stress in tensile specimens varies slightly up and down after annealing at 150 °C and approaches to 150 MPa/m. Yet, the specimen
with initial compressive stress develops greater compres- sive stress upon aging. The magnitude of compressive stress increases sharply from 10 to 80 MPa/ m in the first 100 h of aging. Afterward, the compressive stress slightly increases up to 100 MPa/m for 1000 h of aging.
3. Diffusion analyses
The Ni–Cu–P/Al specimen consists of four ele- ments. The deposit thickness is <10 m. It is difficult to accurately measure the absolute composition of these
FIG. 3. AFM morphology of Ni–Cu–P deposits obtained with 0 g/l saccharin (a) before aging and (b) after 1000 h of aging; with 8 g/l saccharin (c) before aging and (d) after 1000 h of aging; and with 10 g/l saccharin (e) before aging and (f) after 1000 h of aging.
elements. Accordingly, the diffusion behaviors of the constituent elements were investigated by EPMA el- emental profile analysis to reveal the relative variation behavior of these elements. The metal elemental pro- files were examined to reveal the diffusion behaviors.
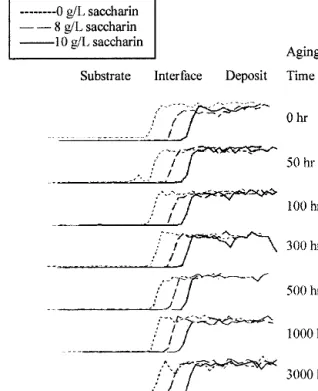
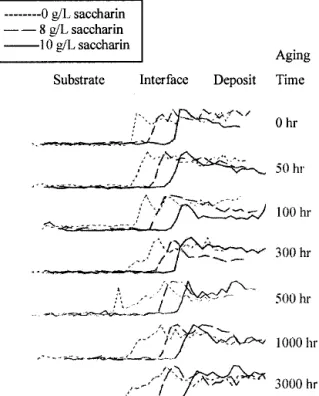
Figures 5–7 are, respectively, the EPMA cross-sectional elemental profiles of Ni, Al, and Cu for heat-aged electroless Ni–Cu–P deposits on Al. The electroless Ni–Cu–P deposits were obtained with 0, 8, and 10 g/l saccharin. The aging time varies from 0 to 3000 h. The slope of the elemental profile at the interface reveals the variation in the diffusion flux.
The elemental profiles of Ni (Fig. 5) and Al (Fig. 6) at the interfacial region remain generally unchanged upon heat treatment up to 3000 h, regardless of the amount of saccharin added. Whereas the interfacial elemental pro- file of Cu undergoes noticeable changes in only the ten- sile specimens (0 g/l saccharin), as shown in Fig. 7. The slope of the Cu profile tends to level off at the interface for the tensile specimen, indicating the inward diffusion of Cu into the Al substrate. This behavior becomes prominent especially after 300 h of aging.
4. Crystallization behavior
The XRD patterns of Ni–Cu–P deposits before and after aging are shown in Figs. 8–10. The crystallization of all specimens occurs after 100 h of annealing. The Ni
3P and Cu–Ni peaks gradually appear. It is noticed that the relative intensity of Ni
3P in the tensile specimen (Fig. 8) is stronger than in the compressive specimen (Figs. 9 and
10). In addition, the tensile specimen and the compres- sive specimens also form different compounds upon ag- ing. Al
2Cu is observed in the tensile specimen, while
FIG. 4. Stress variation upon aging at 150 °C of the Ni–Cu–P deposits obtained with various saccharin concentrations.
FIG. 5. EPMA cross-sectional profile of Ni in an electroless Ni–Cu–P deposit obtained with 0, 8, and 10 g/l saccharin after aging.
FIG. 6. EPMA cross-sectional profile of Al in an electroless Ni–Cu–P deposit obtained with 0, 8, and 10 g/l saccharin after aging.
AlNi
3is detected in the compressive specimen. The peak of Al
2Cu appears after 100 h of annealing of the tensile specimen (Fig. 8), while it disappears after 1000 h of annealing. AlNi
3shows up at approximately 100–300 h of annealing and gradually disappears after long-term annealing, as seen in Figs. 9 and 10.
IV. DISCUSSION
The XRD results (Figs. 8–10) indicate that saccharin does not change the amorphous character of the as- deposited Ni–Cu–P. The deposition rate was not changed by saccharin either, as the thickness remains roughly constant after 30 min, regardless of saccharin concentra- tion (Fig. 2). These observations eliminate the concerns on growth behavior, crystallinity, and deposit thickness when discussing diffusion behavior.
FIG. 7. EPMA cross-sectional profile of Cu in an electroless Ni–Cu–P deposit obtained with 0, 8, and 10 g/l saccharin after aging.
FIG. 8. XRD patterns of Ni–Cu–P deposits on Al substrates, obtained without saccharin.
FIG. 9. XRD patterns of Ni–Cu–P deposits on Al substrates, obtained with 8 g/l saccharin.
FIG. 10. XRD patterns of Ni–Cu–P deposits on Al substrates, ob- tained with 10 g/l saccharin.
A. Stress variation
The residual stress in electroless nickel plating was studied as early as 1971.
16The existence of compressive stress in nickel-plated Al was attributed to the difference in the thermal coefficient of expansion between the sub- strate and the plating. The same reason may explain the compressive stress observed in Ni–Cu–P/Al for deposits obtained in the presence of 8–10 g/l saccharin. Never- theless, the Ni–Cu–P deposit also may exhibit tensile stress in the absence of saccharin (Fig. 4). Thus, the difference in the thermal coefficient of expansion may not be the only factor that determines the stress of the deposit.
A previous investigation
8further ascribed the stress variation to the nodular structure (size) of the deposit. In the as-deposited plating, the change from tensile stress [Fig. 3(a)] or compressive stress [Fig. 3(e)] to near-zero stress [Fig. 3(c)] is accompanied by nodule refining.
Aging results in nodule coalescence [Figs. 3(b), 3(d), and 3(f )] and the release of boundary energy. The nodule dimension of plating aged for 1000 h is generally greater than that of as-deposited plating. The boundary energy was converted to stress energy of the deposit and thus caused an increase in the magnitude of the stress. But the effect of coalescence mainly contributes to the magni- tude of stress, while not changing the type of stress. It is unclear at present what factors govern the type of stress.
However, it is likely that coalescence behavior occurs to a certain extent. It may not approach the unlimited coa- lescence of the nodule. Thus, a maximum stress was achieved upon aging for both the tensile and the com- pressive specimen.
B. Effect of stress on elemental diffusion
The elemental profiles presented in Figs. 5–7 are in- tended to show the effect of the initial stress of the de- posited specimen on elemental diffusion behavior. The stress creates anisotropy in the material and increases the jump frequency of atoms. The elemental concentra- tion profile, c, of a deposit after annealing is given by Fick’s second law.
17C 共x,t兲 = N
公
D共P,T兲t exp 冉 4D −x 共P,T兲t
2冊 , (2)
where x is the distance from the surface, P and T are pressure and temperature, respectively, t is time, and N is the number of tracer atoms. This expression denotes that the diffusion coefficient will be affected by pres- sure, the stress in a deposit. Thus, a stress field may affect the coefficient of diffusion, the diffusion flux, and the boundary condition of diffusion.
18The effect of stress on diffusion has been reported for several
elements, for example, for the diffusion of Ge in Al.
17A phenomenological mechanism
19proposed that the inter- stitial element tends to move toward expanded lattice sites, as induced by tensile stress. The stress even results in an “uphill diffusion effect” of hydrogen in palladium alloys.
19Thus, it is of interest to investigate the effect of stress, induced in a deposited specimen, on the interdiffusion of the constituent elements of the specimen. The different diffusion behaviors have been found in the three coex- isting elements, Al, Ni, and Cu.
20Cu was found to dif- fuse more than Ni from the Ni-sublattice to the opposite site of the Al-sublattice.
20This was attributed to the difference in affinity of Cu for Al and Ni. It is not easy to measure accurately the absolute concentration of the elements across the deposit–substrate interface. How- ever, variation in the elemental profile, presented by EPMA line profiles, upon thermal aging can semi- quantitatively delineate the diffusion behavior of the ele- ments. The profiles of Ni (Fig. 5) and Al (Fig. 6) show that the concentration gradient profiles at the interface of the as-deposited specimen and the specimen aged for 3000 h have approximately the same slope. The variation of ini- tial stress in the deposit, manipulated by 0 g/l (tensile stress), 8 g/l (zero stress), and 10 g/l (compressive stress) saccharin addition, generally does not induce an observ- able change in the gradient slope of the Ni and Al pro- files. These observations indicate that Ni does not penetrate into the Al substrate, and that Al does not pen- etrate into the deposit upon aging at 150°C. D
Al-in-Niis greater than D
Ni-in-Alin a Ni–Al diffusion couple.
21As a result, Ni diffusion from the Ni–Cu–P deposit into the Al substrate does not occur during heat aging, as shown in Fig. 5.
On the other hand, the Cu profile prominently changes upon aging at 150 °C, as shown in Fig. 7. The slope of the interfacial gradient does not show prominent change for the zero stress specimen (8 g/l saccharin) or for the compressive stress specimen (10 g/l saccharin). The pen- etration of Cu into the substrate became observable at 300 h of aging, and an extensive penetration took place after 3000 h of aging for the tensile stress specimen (0 g/l saccharin). It is evident that tensile stress enhances the diffusion flux better than does compressive stress.
This result is ascribed to the earlier proposed mecha- nism
19that expanded lattice sites promote the interstitial diffusion.
It has been reported
17that stress does not impose in- fluence on the diffusion behavior of amorphous metal–
metalloid alloys. The as-deposited Ni–Cu–P is an
amorphous structure (Fig. 8). However, long-term heat
treatment, after 100 h, converts the deposit into a crys-
talline system. The diffusion mechanism may thus
change from the stated “cooperation diffusion mecha-
nism”
17to the “vacancy mechanism.” Therefore, the
effect of stress on the diffusion of Cu becomes quite prominent after 100 h, as seen in Fig. 7 for the tensile deposit specimen (0 g/l saccharin).
C. Effect of stress on compound formation A comparison of the XRD curves of specimens aged for 100 and 300 h indicates differences in crystallization behavior and compound formation with regard to stress variation. The tensile stress, which favors the diffusion of elements, accelerates crystallization and compound formation. The tensile stress specimen shows a well- crystallized curve at 100 h (Fig. 8), whereas the com- pressive stress specimen just starts to crystallize at 100 h (Fig. 10). The tensile stress specimen also exhibits greater intensity of Ni
3P than does the zero stress speci- men (Fig. 9) and the compressive stress specimen (Fig. 10).
These observations delineate the fact that the tensile stress could partially fulfill the activation energy needed for crystallization, and thus accelerate the crystallization and formation of Ni
3P.
In addition to its effect on the crystallization of the de- posit, tensile stress also enhances the formation of the Al
2Cu compound, as revealed in Fig. 8. This compound was not detected in the zero stress specimen (Fig. 9) and the compressive stress specimen (Fig. 10). This result can be ascribed to the faster diffusion of Cu in the tensile stress specimen, as observed in Fig. 7. The diffusion of Cu into Al promotes the formation of the Al
2Cu com- pound upon heat treatment for between 100 and 500 h.
V. CONCLUSION
Cu is the predominant metallic diffusion element in the electroless Ni–Cu–P/Al specimen upon aging at 150 °C.
The diffusion flux of Cu across the interface into the substrate is greatly enhanced by tensile stress in the de- posit. The deposit with zero stress exhibits essentially no diffusion flux upon aging. The tensile stress of the deposit also enhances the crystallization of the amor- phous deposit and the formation of Ni
3P and Al
2Cu in the deposit upon aging.
ACKNOWLEDGMENT
The authors acknowledge the National Science Coun- cil of the Republic of China for the financial support of this study under Grant No. NSC89-2216-E-006-088.
REFERENCES
1. G.O. Mallory and J.B. Hajdu, Electroless Plating: Fundamentals and Applications (American Electroplaters and Surface Finishers Society, Orlando, FL, 1990), pp. 229, 260.
2. O. Takano and K. Aoki, J. Met. Finish. Soc. Jpn. 34, 316 (1983).
3. K.H. Hur, J.H. Jeong, and D.N. Lee, J. Mater. Sci. 26, 2037 (1991).
4. N. Krasteva, V. Fotty, and S. Armyanov, J. Electrochem. Soc.
141,2864 (1994).
5. Y.W. Wang, C.G. Xiao, and Z.G. Deng, Plat. Surf. Finish. 79, 57 (1992).
6. C.Y. Lee and K.L. Lin, Jpn. J. Appl. Phys. 33, 4708 (1994).
7. G.O. Mallory and J.B. Hajdu, Electroless Plating: Fundamentals and Applications (American Electroplaters and Surface Finishers Society, Orlando, FL, 1990), pp. 111, 138.
8. C.J. Chen and K.L. Lin, Thin Solid Films 370, 106 (2000).
9. J.W. Dini, Electrodeposition (Noyes Publications, Park Ridge, NJ, 1993), pp. 279, 303.
10. J.K. Dennis and T.E. Such, Nickel and Chromium Plating, Third ed. (American Society for Metals, Materials Park, OH, 1993), pp. 96, 131.
11. R.E. Reed-Hill and R. Abbaschian, Physical Metallurgy Prin- ciples, 3rd ed. (Wadsworth, Belmont, CA, 1992), pp. 836, 899.
12. A. Brenner and S. Senderoff, J. Res. NBS 42, 105 (1949).
13. R. Weil, Plating 57, 1231 (1970).
14. R.B. Ross, Metallic Materials Specification Handbook, Third ed.
(E. & F.N. Spon, London, 1980), p. 1.
15. C.R. Barrett, W.D. Nix, and A.S. Tetelman, The Principles of Engineering Materials (Prentice Hall, Englewood Cliffs, NJ, 1973), p. 134.
16. K. Parker and H. Shah, Plating 58, 230 (1971).
17. H. Mehrer, Defect Diffusion Forum 129–130, 57 (1996).
18. J. Philibert, Defect Diffusion Forum 129–130, 3 (1996).
19. F.A Lewis, K. Kandasamy, and X.Q. Tong, Int. J. Hydrogen En- ergy 27, 687 (2002).
20. A.H. Cottrell, Intermetallics 4, 1 (1996).
21. S. Shankar and L.L. Seigle, Metall. Mater. Trans. A 9, 1467 (1978).