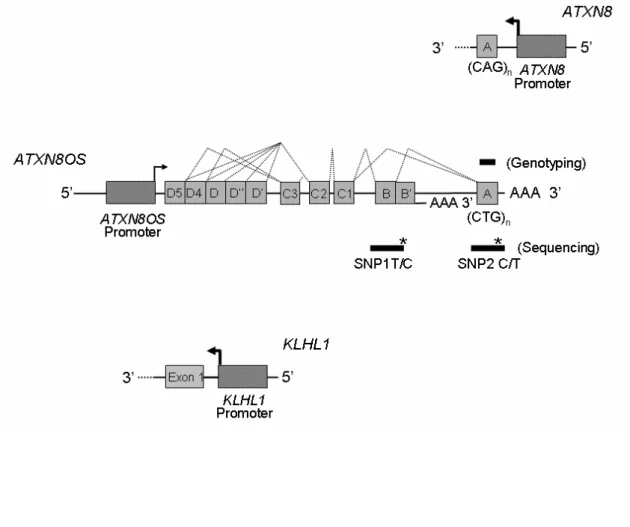
humans. Comparison of the genomic organization of the overlapping
23
0
0
全文
(2)
(3)
(4)
(5)
(6)
(7)
(8)
(9)
(10)
(11)
(12)
(13)
(14)
(15)
(16)
(17)
(18)
(19)
(20)
(21)
(22)
(23)
數據
+7


相關文件
Consistent with the negative price of systematic volatility risk found by the option pricing studies, we see lower average raw returns, CAPM alphas, and FF-3 alphas with higher
As discussed in the example (Figure 3.3), the goal of the min-sum algorithm is to find a valid configuration such that the sum of the local costs (over all sites and check sets) is
The ontology induction and knowledge graph construction enable systems to automatically acquire open domain knowledge. The MF technique for SLU modeling provides a principle model
• The ArrayList class is an example of a collection class. • Starting with version 5.0, Java has added a new kind of for loop called a for each
• To enhance teachers’ knowledge and understanding about the learning and teaching of grammar in context through the use of various e-learning resources in the primary
vs Functional grammar (i.e. organising grammar items according to the communicative functions) at the discourse level2. “…a bridge between
Wang, Solving pseudomonotone variational inequalities and pseudocon- vex optimization problems using the projection neural network, IEEE Transactions on Neural Networks 17
mathematical statistics, statistical methods, regression, survival data analysis, categorical data analysis, multivariate statistical methods, experimental design.
