行政院國家科學委員會專題研究計畫 期末報告
建築節水策略與 CO2 排放評估模式之研究
計 畫 類 別 : 個別型
計 畫 編 號 : NSC 101-2221-E-011-156-
執 行 期 間 : 101 年 08 月 01 日至 102 年 07 月 31 日 執 行 單 位 : 國立臺灣科技大學建築系
計 畫 主 持 人 : 鄭政利
計畫參與人員: 碩士班研究生-兼任助理人員:陳虹竹 碩士班研究生-兼任助理人員:陳妍君 博士班研究生-兼任助理人員:鐘順臻
報 告 附 件 : 出席國際會議研究心得報告及發表論文
公 開 資 訊 : 本計畫可公開查詢
中 華 民 國 102 年 09 月 14 日
中 文 摘 要 : 氣候變遷地球暖化與能資源的枯竭,已經成為世界各國必須 面對的迫切環境課題,節能減碳策略是必要行動與未來趨 勢。「節水」不僅是為了有效利用水資源,還關係到二氧化 碳排放量的削減,相對於能源及其他資源項目具有多元的替 代可能性,而水不但沒有可替代物,水資源還會因地域的不 同與季節變化而具有不穩定的特性。因此,對於潔淨淡水資 源的有效利用,以及建築物給水設備系統的節水設計與管理 控制就顯得更為重要。近年來建築節水設備發展十分迅速,
以日本為例,節水型衛生器具對於削減住宅二氧化碳排放有 顯著效果。一般家庭日常生活中使用的給排水相關設備,CO2 排放量約佔日本的 CO2 總排放量的 5%。根據模擬研究推估 結果顯示,由於節水器具的普及及各種節水措施的推展,預 測至 2020 年,日本的二氧化碳排放量與 1990 年相比,來自 與給排水相關的住宅設備 CO2 排放量將具有削減 25%的潛 力,使日本 CO2 排放總量達到消減 1%的目標,由此可知推 動節水型社會的重要性。台灣各部門能源消耗的排放 CO2 貢 獻度,若由部門分攤電力消費加以計算,於 1990~2009 年 間,以服務業部門之成長率較高,其次分別為住宅、工業、
運輸與能源轉換部門。住宅部門仍居 CO2 排放高比例位置,
因此國內日常生活用水採用「開源」、「節流」技術及策略 有其必要性。本研究之主要目的,首先根據家庭生活用水及 相關耗能比重,透過訪談與問卷調查方式,掌握大型都會地 區之節水設備與衛生器具之使用概況。其次,衛生間及浴室 等用水相關住宅設備,除了消耗水資源與相關電力能源外,
同時還會產生環境負荷及 CO2 排放,本研究建立住宅用水設 備產生 CO2 總排碳量之推移及預測模式,發展透過節水來削 減 CO2 排放之可行技術與策略,以協助國人建構一個節能減 碳之節水型社會。本計畫成果預期能提昇目前國內整體給水 設備品質和節水設計技術,並協助落實節能減碳政策。
中文關鍵詞: 建築給排水系統、節水設備、CO2 排放、給水壓力、配管工 程
英 文 摘 要 : This research executed a saving water investigation and proposed a CO2 emission estimation model for water consumption. Through investigation of the domestic water usage in people's livelihood, the structure of water consumption can be schematically understood and the water saving strategy can be concluded. The calculation model had been built to estimate the energy consumption and CO2 emission from water demand and to evaluate the potential of water
saving strategy. The quantitative potential reveals the motivation of saving water strategy and
practicability of society based on saving water concept. This achievement can be referenced by Asian countries with similar environment and precipitation.
On the other hand, this study can make various organizations both in public and private sectors aware of the importance of building a society based on water saving concept. As a result, various policy- making processes are anticipated to be initiated. In addition, this validation can link to the intention of green building policy. Finally, this research is anticipated to enhance the effective use of water resources, and to create a sustainable water-saving and low carbon emission society.
英文關鍵詞: water supply and drainage system, water saving equipment, CO2 emission, water supply pressure, plumbing engineering
Evaluation model of CO
2emission for saving water strategy in buildings
1. Introduction
Climate change and global warming had become crucial challenge to the whole world in this century. Evidences of environmental problem were comprehensively validated by academia and practical world for many years. Nowadays, CO2 emission had been seen as the core issue which is high response to the climate change and global warming.
Kyoto Protocol clearly target on the reduction of CO2 emission to all countries of the world. Although the common consensus had not yet been reached by political sections of all countries in the world, the importance and urgency of this issue definitely cannot be ignored.
Generally, CO2 emission was seen as the sequence of energy consumption. The request of CO2 reduction is always emphasized on the energy section from industry, transportation and people’s livelihood necessaries. On the other hand, water resource is well known to be the non-fungible element on this plant. Water resource demands have grown steadily according with the society development. Ensuring the stable supply of water is becoming the fundamental policy in many countries. However, people usually forget to see the energy consumption from the process of water supply and drainage. In fact, the water usage consumes energy from all process of water supply and drainage.
Previous researches and relevant documents reported the reciprocal relationship between water usage from people’s livelihood and electricity consumption1). That is water usage of one degree (m3) approximately equal to one unit electricity consumption (kWh). There are 23 million population and daily water consumption with around 300 liter per day in Taiwan. It is a huge energy consumption item as the accumulation of population is considered2). That is to say, the reduction of CO2 emission should not ignore the contribution of water saving strategy.
The potential of water saving contribution to reduction of CO2 emission is noticed and its quantitative evaluation is necessary to be clarified. Firstly, this research investigated the domestic water use in people’s livelihood in Taiwan and clarified the schematic structure of water consumption. An estimating model was proposed to evaluate the quantitative potential of the energy consumption and CO2 emission from water usage.
Eventually, this paper aims on the promotion of saving water society and offers an evaluation method for this target.
2. Reviews and Methodology
Water-saving apparatuses have been seen some remarkable advancement in recent years.
In addition to sanitary fixture such as faucet and shower valves, other home appliances-washing machines, dishwashers with advanced water saving capabilities are now appearing on the market3). Water saving can also be the effective strategy to reduce CO2 emission. In a simulation study4), it has been postulated that by 2020 the total CO2
emission in Japan can be reduced to 1 % of 1990 level which is equivalent to 25% of all CO2 emission from kitchen, bathroom and toilet, if emission from residential homes is controlled through popularization of water-saving apparatuses. This study made various organizations both in public and private sectors aware of the importance of society based on water saving concept. Policy-making processes following with this result have started recently in Japan and response to Green Building orientation5). Under the policy of sustainable development by the Taiwan Government, an evaluation of Green Building system, which emphasizes energy conservation, resource protection, low waste, low environmental impact, was developed to improve the ecological living environment from 1999.
In order to improve the work of CO2 emission reduction and clarify the potential of water resource preservation, it is necessary to share the estimation techniques and information to academic researchers, policy makers and relevant people who are involved in the field of water, environment and sustainable construction6). Due to this common consensus, Asia Water saving Council was founded in 2012 Tokyo to promote the importance of water preservation and society based on water saving concept. Indeed, the water issues are different from countries of vary climate and precipitation. Regional and seasonal limitation is inherent in natural water resource. Culture customs and social behaviors also dominate the water consumption in different countries. Therefore, investigation and survey are needed to validate the relevant issues for each country.
3. Estimation model
The bench mark of evaluation between water consumption and CO2 emission would be set as yearly calculation for each item. Thus, the result can compare to the capital CO2 emission for whole country. Calculation from water consumption to CO2
emission is an accumulation by individual process energy consumption. Herein, the yearly CO2 emission from water consumption Tn can be calculated by 2 parameters, and the function is as shown as equation (1).
on pn
n
C p
T ………
(1)T
n:The total CO2 emission in year(n) (kg-CO2/ year)C
pn:The capital CO2 emission per person in year(n)(kg-CO2/person‧year)
p
on:Population (persons)The population is constant for a country in above equation. The crucial parameter is the average CO2 emission per person in year (n) (kg-CO2/ person‧year) Cpn and this parameter is from 2 directions including tap water demand and hot water usage. So, this calculation can be expressed as equation (2) as the following.
C
pn C
pwn C
phn………(2)C
pn:The capital CO2 emission per person in year(n) (kg-CO2/person‧year)C
pwn:The factor of CO2 emission per person in year(n) from tap water (kg-CO2/person‧year)C
phn:The factor of CO2 emission per person in year(n) from hot water (kg-CO2/person‧year)The calculation of CO2 emission from tap water usage is conducted by the coefficient of tap water CO2 emission kcwn and average yearly tap water consumption volume per person Qpwn. The function is as shown as equation (3).
C
p w n k
c w n Q
p w n………(3)k
cwn:the factor of tap water CO2 emission (kg- CO2/m3)Q
pwn:the average yearly tap water consumption volume per person (m3/ person‧year)The factor of tap water CO2 emission is from 3 sources including energy consumption from clean process of water supply plant, water supply in housing unit and sewage treatment. Meanwhile, the coefficient of electricity energy transfer to CO2 emission is necessary factor to this calculation. The function can be expressed as equation (4) as the following.
k
cwn
(E
swn E
uwn E
twn) C
en………(4)k
cwn:the factor of tap water CO2 emission (kg- CO2/m3)E
swn:the electricity energy consumption from clean process of water supply plant (kWh/m3)Euwn:the electricity energy consumption from housing unit water supply equipment (kWh/m3)
E
twn:the electricity energy consumption from urban sewage treatment (kWh/m3)C
en:the factor of electricity energy consumption transfer to CO2emission in year(n) (kg- CO2/kWh)
On the other hand, hot water usage in housing daily life consumes more energy and cause more CO2 emission. The energy consumption is directly caused by heating process but more complex due to its heating source. Firstly, the calculation can be expressed as equation (5). The average CO2 emission per person in year(n) from hot water Cphn is dominated by the coefficient of hot water CO2 emission (kg- CO2/m3) and the average yearly hot water usage volume per person.
C
phn k
hwn Q
phn………()k
hwn:the factor of hot water CO2 emission (kg- CO2/m3)Q
phn:the average yearly hot water usage volume per person(m3/ person‧year)
The factor of hot water CO2 emission is more complex as above mentioned due to its heating sources. According to investigation, the heating sources have 3 types of energy including gas (LPG), electric heater and solar heating system in Taiwan. The practical usage proportion is approximate 70%, 25% and 5%. Therefore, the coefficient of hot water CO2 emission can be expressed as equation (6) as the following.
k
hwn C
g 0.7 C
e 0.25 C
s 0.05
………(6)k
hwn:the factor of hot water CO2 emission (kg- CO2/m3)C :the hot water CO
g 2 emission from gas energy heating source 70%*1(kg-CO2/m3)
Ce:the hot water CO2 emission from electric energy heating source 25% *1 (kg-CO2/m3)
Cs: the hot water CO2 emission from solar energy heating source 5% *1 (kg-CO2/m3)
*1:The practical usage proportion of energy including gas (LPG), electric heater and solar heating system in Taiwan.
4.Evaluation and validation
4.1 Factors of CO
2emission
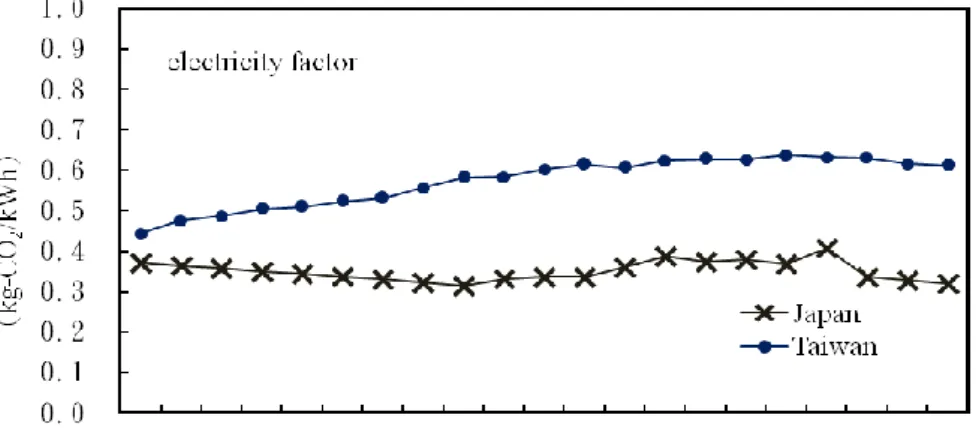
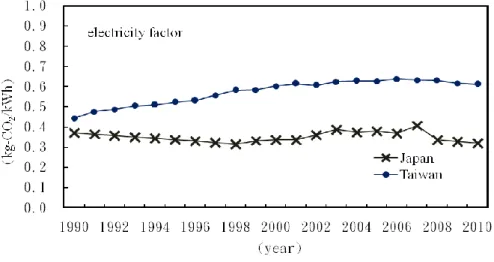
According to the composition rate of electric power production sources such as oil, coal, nuclear and hydraulic power, the CO2 emission factors for electricity is shifting for each year. Consequently, the factors are not only changing yearly but also different from countries. Fig. 1 show the factors from 1990 to 2010. There is an increasing tendency from 1990 to 2000 in Taiwan, and be stable after 2001 with approximate 0.62
(kg-CO2/kWh). On the other hand, it is stable with around 0.37 (kg-CO2/kWh) except the data of 2007 in Japan.
Fig.1 the electricity factors for CO2 emission from 1990 to 2010
The water usage factors including tap water and hot water are evaluated from 1990 to 2010. A slight increasing tendency is shown in this evaluation for decades in Taiwan. It reveals that the potential of reduction for CO2 emission is existed. Table 1 show the data details during these years.
Table 1 the factors for CO2 emission from 1990 to 2010
Electricity (kg-CO2/kWh)
-Japan
Electricity (kg-CO2/kWh)
-Taiwan
Tap water (kg-CO2/m3)
-Taiwan
Hot water (kg-CO2/m3)
-Taiwan
1990 0.371 0.443 0.344 5.32
1991 0.364 0.475 0.369 5.54
1992 0.357 0.487 0.378 5.62
1993 0.350 0.504 0.391 5.73
1994 0.344 0.509 0.395 5.77
1995 0.337 0.523 0.406 5.86
1996 0.330 0.531 0.412 5.91
1997 0.323 0.556 0.431 6.08
1998 0.314 0.582 0.452 6.25
1999 0.332 0.583 0.452 6.26
2000 0.335 0.602 0.467 6.39
2001 0.336 0.614 0.476 6.47
2002 0.360 0.606 0.470 6.41
2003 0.387 0.624 0.484 6.53
2004 0.374 0.628 0.487 6.56
2005 0.379 0.626 0.486 6.55
2006 0.368 0.637 0.494 6.62
2007 0.407 0.632 0.490 6.59
2008 0.335 0.631 0.490 6.58
2009 0.328 0.616 0.478 6.48
2010 0.320 0.612 0.475 6.45
4.2 CO
2emission of water usage
According to Kyoto Protocol, 1990 is a bench mark year for each country to target the reduction of CO2 emission. It was seen as a very challenge to reach the goal for many countries. In the case of Taiwan, the capital CO2 emission is almost double from 1990 to 2006 as shown as Fig.2. Although it is a difficult mission to fit the Kyoto Protocol bench mark, the government targets the 2000 to be bench mark year and the initial strategy. Due to the carbon credits and exchange mechanism movement, eventually, government policy need to improve and reach the 1990 bench mark.
Fig.2 the capital CO2 emission of Taiwan (ton-CO2/person-year)
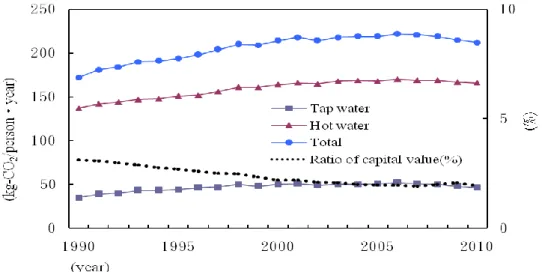
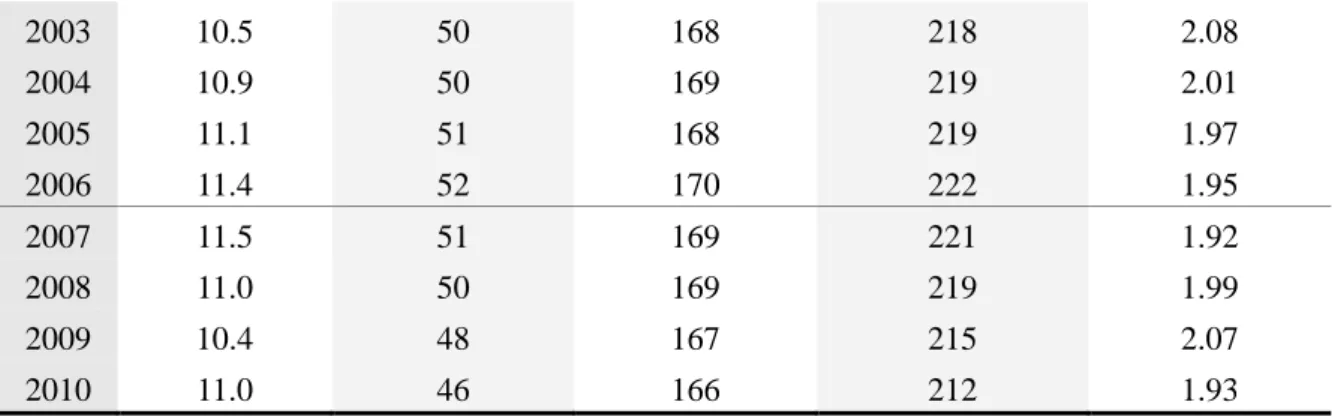
The CO2 emission which is caused by water usage has a similar shifting feature with the capital value of all country in Taiwan. The total water factor of CO2 emission is composed by tap water and hot water usage. However, the increasing rate is less than the capital value and it keeps stable situation after 2000. Fig.3 shows the factors shifting situations of tap water, hot water and total value. The hot water factor has larger value and contribution to the ratio of water factor to capital value. Herein, it also shows that the ratio of water factor to capital value is decreasing from around 3.0% to 2.0%. Table 2 shows the details of these data.
Fig. 3 the factors shifting diagram of water usage.
Table 2 the factors of CO2 emission shifting data of water usage
Capital factor (ton-CO2/p.y)
Tap Water
factor (kg-CO2/p.y)
Hot water
factor (kg-CO2/p.y)
Total water factor (kg-CO2/p.y)
Ratio of capital value
(%)
1990 5.5 35 137 172 3.13
1991 5.9 39 142 181 3.07
1992 6.2 40 144 184 2.97
1993 6.6 43 147 190 2.88
1994 6.9 43 148 191 2.77
1995 7.2 44 151 194 2.70
1996 7.6 46 152 198 2.61
1997 8.1 47 156 204 2.51
1998 8.5 50 161 210 2.47
1999 8.9 48 161 209 2.35
2000 9.7 50 164 214 2.21
2001 9.9 51 166 218 2.20
2002 10.2 49 165 214 2.09
2003 10.5 50 168 218 2.08
2004 10.9 50 169 219 2.01
2005 11.1 51 168 219 1.97
2006 11.4 52 170 222 1.95
2007 11.5 51 169 221 1.92
2008 11.0 50 169 219 1.99
2009 10.4 48 167 215 2.07
2010 11.0 46 166 212 1.93
4.3 Potential of saving water
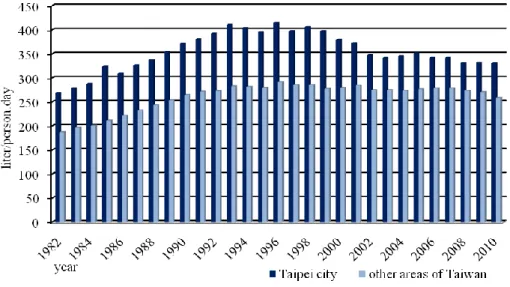
The water factor of CO2 emission is high related to the water consumption. Fig. 4 shows the shifting volume of daily water consumption per person in Taipei city and other areas of Taiwan. It is obvious that the metropolitan area such as Taipei city has greater water consumption of around 30% up in the other areas of Taiwan. It also shows that water consumption is increasing during 1980s and with peak value in 1990s. The tendency is approximately stable after year of 2000 with Taipei city of around 350 liter per day and the other areas of Taiwan of around 270 liter per day.
Fig. 4 the shifting volume of daily water consumption in Taiwan
According to this stable situation of water consumption, it needs more motivation to improve the water saving strategy and inovate reduction techniques to carry out the goal of saving water society. Therefore, a quantitative evaluation is necessary to validate the possibility of improvement in water saving activities. The proposed calculation model in this paper can estimate the value of CO2 emission from water usage and evaluate the potential of saving water strategy.
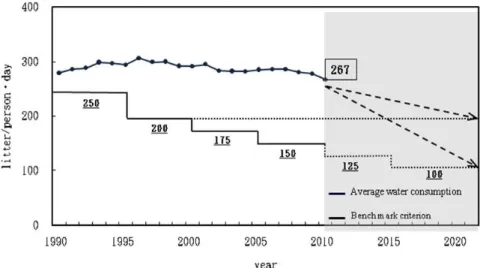
In order to estimate the potential of saving water strategy, the bench mark of saving water society has to be set as target. The saving water facilities such as low flush water closet shower are the practicable step to reduce water consumption. The water use behavior is also a influence factor to reduction stetragy. Due to the facilities performance and water use behaviors is changing, the bench mark should be set as stage target. This paper concludes the stage with 5 years and bench mark target as 250, 200, 175 and 150 liter per day during 1990~2010 in Taiwan.
Eventually, the bench mark of saving water society target on 150 liter per day as the criterion of potential estimation. Fig. 5 shows the diagram of saving water protential and bench mark of saving water society. The potential can be calculated by the diffenence between practical water consumption and criterion of saving water society. That is to say, the quantitative potential of water saving is around 45% and contribution of CO2
emission to capital ration is 0.87% in 2010. It is equivalent to around 2.3 millions ton of CO2 emission for carbon credit. The bench mark of saving water society can be shifted to higher criterion due to improvement of facility performance and innovation of techniques such as rainwater havesting and water recycling system. Therefore, the bench mark criterion of saving water society can shift from 150 to 100 liter per day per person before 2020. The posibility needs more innovation and validation to prove its practicability in the future.
Fig. 5 the diagram of saving water protential and bench mark of saving water society.
5. Conclusion
Sustainability and reduction of CO2 emission is the global consensus in recent years.
This research aims on the practicability of society based on saving water concept and links to the reduction of CO2 emission policy. A calculation model is proposed in this paper to estimate the CO2 emission from water consumption. Through investigation of the domestic water use in people’s livelihood, the structure of water consumption can be schematically understood and the water saving strategy can be concluded. The calculation model had been built to estimate the energy consumption and CO2 emission from water demand and to evaluate the potential of water saving strategy.
Eventually, this research conducted estimation model of CO2 emission from water consumption and validate the potential of water saving strategy in Taiwan. The quantitative potential reveals the motivation of saving water strategy and practicability of society based on saving water concept. This achievement can be referenced by Asian countries with similar environment and precipitation. However, more innovation and validation about low carbon society are necessary to be concerned. In order to carry out the society of saving water and low carbon, the practicability of carbon credit mechanism needs more innovations and further validation in the future.
Acknowledgements
The authors would like to thank the National Science Council of the Republic of China (NSC100- 2221-E-011-119)for financially supporting this research.
Reference
[1] C.L. Cheng, ‘Study of the Interrelationship between Water Use and Energy Conservation for a Building’, Energy and Buildings, UK, Vol 34 Iss 3, pp261-266, 2002.
[2] C.L. Cheng, W.J. Liao, 2011, ‘Current situation and sustainability of water resource in Taiwan’, 2011Asian Water Saving Council, Japan
[3] Yasutoshi Shimizu,2011, ‘ CO2 Reduction Potential in Japan through Saving Water’, 2011Asian Water Saving Council, Japan
[4] Kanako Toyosada,2011,A study on Environmental Prediction in Japan , 2011Asian Water Saving Council, Japan
[5] Ling-Tim Wong,2011, ‘Significance of water circumstances and the saving water in Hong Kong’, 2011Asian Water Saving Council, Japan
[6] K.C. He, Y. K. Juan, C.L. Cheng, G. M. Lin, 2011,‘ The research and application for green water system’, CIB-W62 International Symposium, September, Portugal.
[7] W.J. Liao, C.L. Cheng, K.C. He, C.H. Hsieh, Y.C. Liu , 2011,‘Research of Public Toilet Equipment Quantity in MRT Station’, CIB-W62 International Symposium, September, Portugal.
計畫成果自評:
本研究計畫之內容已經於計畫期限內執行完畢,研究成果也已經發表於 CIBW62 建築國際研討會,研究之部分成果並彙整投稿於 SCI 國際學術期刊,目 前正投稿中。自評計畫執行順利圓滿,研究成果良好,對國內建築專業學術領域 及建築實務有具體之貢獻。
國科會補助專題研究計畫項下出席國際學術會議 心得報告
日期: 101 年 10 月 10 日 計畫編號 NSC 101-2221-E-011-156
計畫名稱 建築節水策略與 CO2 排放評估模式之研究
出國人員姓名
服務機關及職稱 鄭政利 /國立台灣科技大學建築系/教授
會議時間地點 自 2012 年 8 月 27 日至 2011 年 8 月 30 日/ Edinburg, Scotland, UK
會議名稱 (中文) 第 38 屆國際建築研究發展暨建築給排水國際研討會
(英文) 38th International Symposium of CIB-W62, Water Supply and Drainage for Building
發表論文題目 1. Evaluation model of CO2 emission for saving water strategy
一、 參加會議經過
CIB (International Council for Research and Innovation in Building and Construction)建築國 際研討會,最初係由法國發起之國際性建築學術研究交流組織,成立於 1953 年,以促進國際 間最先進之建築科學新知交流與應用技術發展為宗旨,至今已有超過七十個國家及六十個國 際學術機構或研究組織正式參與。由於建築領域之各部門研究學門相當龐大,舉辦統一之國 際研討會或由單一組織來經營實際上已有困難,目前係有四十二個常設領域工作委員會
(Working Commissions)及十三個非常設專題工作小組(Task Group),各自營運並定期舉辦研 討會,再將成果納入 CIB 總會之資訊情報交流體系。每年研討會由不同之會員國輪流舉辦,
建築給排水(Water Supply and Drainage for Buildings)研討會就是在此架構下之常設領域工作 委員會(CIB-W62),成立於 1971 年,每年定期召開學術會議,至今第三十六屆會議未曾中 斷。國內現在有三個研究機構,包括國立台灣科技大學、國立成功大學以及內政部建築研究 所,是目前 CIB 正式之團體會員,筆者為代表台灣科技大學之聯絡人,也是該組織 W62 之技 術委員會委員。今年會議係由英國 (UK) Herriot-Watt University 承辦,於蘇格蘭的愛丁堡市 (Edinburg City)舉行一天之各會員國代表會議,以及為期三天之國際學術研討會。筆者自 1996 年起於瑞士洛桑受邀發表論文之後,每年分別於日本橫濱、荷蘭鹿特丹市、英國愛丁堡、巴 西、斯洛維尼亞、羅馬尼亞、土耳其、法國、比利時、台灣、捷克等國主辦,並受邀發表
論文及擔任分科會議主持人,今年乃第十六次受邀擔任會議主持人與發表論文。筆者研究團 隊也於 2006 年,爭取到了承辦當年度年會的主辦權,順利成功地在台北舉行了第三十二屆之 國際學術研討會以及年度會員國會議。
本次大會於八月二十七日下午各國代表開始報到,並於當天下午五點舉行年度會員國代 表大會,傳達 CIB 總會的重要訊息與一般議程會員國事務討論,同時也慎重討論了明年度 2013 年大會,主辦國日本(Japan)的籌辦情況與會議地點。學術研討會於二十八日上午正式開幕,
展開為期二天之學術研討會及一天之技術參訪活動。本次會期共接受口頭發表論文五十篇,
與會人數約百人,有許多國家代表與會,並踴躍發表與參與討論。筆者今年仍然受邀擔任議 程的分科會主持人(Chairman),主持有關建築給排水與能源效率相關議題之技術論文發表。本 次的研討會主要分四個大議程進行論文發表與討論,議程首先就在主辦單位官方代表的開幕 演 講 後 展 開 。 第 一 個 議 題 是 有 關 建 築 永 續 、 雨 水 與 再 生 水 利 用 系 統 議 題 (ASession:
Sustainability, Rainwater and Reuse of Waste-water)之相關研究論文發表,共有 12 篇論文,提出 相關研究論文之專家學者,主要為斯洛伐克、葡萄牙與巴西之專家學者,也包括一篇來自台 灣之發表,歐洲各國代表與日本學者都紛紛表達看法。有關永續發展之相關議題,最近幾年 一直都是受到各國高度關注,會中討論也相當踴躍。第二個議題是有關建築排水衛生設備系 統之議題(B Session: Drainage, Sanitation, JOHN SWAFFIELD SESSION) ,共有 13 篇論文。依 循前年慣例,這個議程特別為了紀念與表彰剛去世不久的英國學者 Professor J Swaffield,多 年來對於這個研討會及專業領域投入貢獻,經會員大會一致決議,將本議程同時命名為 JOHN SWAFFIELD SESSION。有關排水系統之議題,在本研討會中一向都受到高度的關注,也是 多年來會期中討論最多最踴躍之議程,筆者研究團隊也在此議題上有一篇論文發表,由於發 表論文議題受到各國專家代表的關注與興趣,討論相當踴躍熱烈,讓台灣在本議題上之研究 成果獲得不少肯定與重視。第一天的議程就在各國與會代表熱烈發言,以及會議綜合討論中 結束。
第二天之議程,上午首先是第三個議題,是有關建築給水需求相關議題(C Session : Water Demand and Supply, LAWRENCE GALOWIN SESSION),共有 13 篇論文發表。今年這個議程 特別為了紀念與表彰剛去世不久的美國學者 Professor L Galowin,多年來對於這個研討會及專 業領域投入貢獻,經會員大會一致決議,將本議程同時命名為 LAWRENCE GALOWIN SESSION。第四個議題是有關建築給水與能源效率之相關議題(D Session: Water and Energy Effiency),是本次研討會最後的議程,共有 12 篇論文發表,筆者受邀主持了下午的第一場次 發表,討論也相當熱烈,特別是有關節水與節能減碳之關連議題,更是受到與會代表的關心 與注意,基本上也延續了永續環境與氣候變遷之議題討論。兩天議程在各國與會代表高度關
心與熱烈討論中結束,最後在本會主席 Mr. K. Cuyper 總括結論中圓滿結束本次學術研討會。
會後主辦單位特別準備了蘇格蘭傳統慶祝活動,並設宴款待各國與會代表,並讓與會之各國 代表自由親善交流與交換意見。
二、 與會心得
英國(UK)是世界上具影響力的歐洲大國之一,具有豐富的歷史遺產與深厚的文化底 蘊,今年由英國蘇格蘭 Heriot Watt University 主辦本年度會議,會議大致順利圓滿,也讓所 有與會者深刻體驗蘇格蘭的人文與歷史。筆者參與之後,也深刻體會到該國的社會環境的確 有許多值得我們台灣學習的地方。多年以前,會中經常有與會學者及國際友人輕鬆地詢問,
是否也有機會由台灣來爭取舉辦,讓大家在台北見面。筆者的研究團隊作為台灣代表,終於 在 2006 年成功地主辦了一次國際年會,也獲得多方的好評,也等於幫台灣完成一次成功的 國民外交。這也是筆者研究團隊多年來努力成果的肯定,未來我們也將繼續努力,為台灣爭 取更多表現與權益,以及創造台灣正面形象之機會。
CIB 建築國際研討會的召開目的,除了研究成果的發表討論之外,最重要的功能就在 於國際間重要建築資訊情報的交換與研發技術成果的交流。今年的主要研討議題中,有關環 境永續與氣候變遷之議題,仍然受到與會各國專家學者的注目與熱烈討論,同時也積極運作 國際工作小組,針對全球性問題進行有意義的跨國研究與資訊交流。另外,與去年類似情況,
有關雨水利用與再生水利用系統議題,在本次議程中有不少發表論文,不過大致上可以看出 正在發展中之國家明顯有高度的興趣,尤其是東歐國家近年來也特別關注此議題之發展。就 台灣而言,大約在十年前也是國內高度關注與重視的議題,目前台灣在建築雨水利用及再生 水系統課題上,已經建立了法制化的規範,並納入建築技術規則管制。另一方面,日本更早 對於雨水利用議題已經落實在建築與都市實務層面,這也顯示國際上各國在建築技術發展的 進程狀況,台灣近幾年的建築給排水技術發展,已經逐漸跟上先進國家的腳步。整體而言,
在新技術的研發成果上,確實有不少重要之發現與成果持續被提出,特別是有關節能減碳,
以及節水效益與技術的議題,在今年的會期上有相當熱烈的討論。因此,同步地保持與世界 各先進國家研究發展趨勢的聯繫交流,以及掌握國際間建築給排水研究領域未來的動向,並 將此訊息帶回國內乃是本次會議最大的收穫。
三、 考察參觀活動
第四天的行程,主辦國安排參訪蘇格蘭高地,運河轉運系統與營運中心 Falkirk Wheel。
詳細參觀介紹蘇格蘭高地上之運河系統,以及運河上船運的轉運技術與機構,在 Falkirk Wheel 轉運中心,利用高度工程技數與巧妙機械原理,將兩條垂直高差超過 50 公尺的運河,有效率 地連結在一起。此外,主辦單位也為我們準備了蘇格蘭高原上的城市發展與建設導覽,介紹 了幾個歷史古蹟與古堡的維護與保存,的確令人印象深刻。參訪過程讓各國與會學者專家,
深刻地見識到英國豐富的歷史遺產與技術成就,確實收穫良多。
四、 建議
希望我們的政府機關今後能夠給予更多的鼓勵與支持,讓更多的國內有心之學者專家,
走出國外參加各專業重要國際會議,除了吸收新知與重要國際訊息,更重要的是讓國際社會 知道我們台灣中華民國的存在,並肯定我們的努力與成就。記得筆者第一次參與此會議時,
有許多與會之各國代表學者並不知道台灣在那裡,甚至不知道有台灣的存在。如今,大部分 的與會學者已經瞭解台灣的情況,同時大多也逐漸關心台灣的處境,更重要的是逐漸接受並 肯定我們的努力與成果,這是值得欣慰的,也是我們的國家必須努力走向國際舞台的重要意 義。最後也要感謝國科會此次參與研討會之經費輔助,使筆者得以不虛此行,收穫豐碩。
五、 攜回資料名稱及內容
1. Proceeding of 38
thInternational Symposium of CIB-W62, Water Supply and Drainage for Building
2. Minutes of the 37
thPlenary Meeting of CIB W062-Members and their Invitees 3. Invitation and announcement for 2013CIBW62 , Water Supply and Drainage for
Building, Nagano, Japan
4. Some catalogs of products of buildings water supply and drainage
六、 其他(本人發表論文)
Evaluation model of CO
2emission for saving water strategy
(1) C.L. Cheng, Dr. (2)W.J.Liao, Dr. (3) Y.C.Liu, Mr.(4) Y.C.Tseng,Mr (5)H.J. Chen, Ms (1)CCL@mail.ntust.edu.tw
(2)D9613011@mail.ntust.edu.tw (3)aa3907@ms.tpc.gov.tw (4)m9913008@mail.ntust.edu.tw (5)s310063@gmail.com
National Taiwan University of Science and Technology, Department of Architecture, 43 Keelung Road Sec.4, Taipei, Taiwan, R.O.C.
This research executed a saving water investigation and proposed a CO2 emission estimation model for water consumption. Through investigation of the domestic water usage in people’s livelihood, the structure of water consumption can be schematically understood and the water saving strategy can be concluded. The calculation model had been built to estimate the energy consumption and CO2 emission from water demand and to evaluate the potential of water saving strategy. The quantitative potential reveals the motivation of saving water strategy and practicability of society based on saving water concept. This achievement can be referenced by Asian countries with similar environment and precipitation. On the other hand, this study can make various organizations both in public and private sectors aware of the importance of building a society based on water saving concept. As a result, various policy-making processes are anticipated to be initiated. In addition, this validation can link to the intention of green building policy. Finally, this research is anticipated to enhance the effective use of water resources, and to create a sustainable water-saving and low carbon emission society.
Keywords: water supply and drainage, water saving, CO
2 emission, green building, low carbon, sustainability1. Introduction
Climate change and global warming had become crucial challenge to the whole world in this century. Evidences of environmental problem were comprehensively validated by academia and practical world for many years. Nowadays, CO2 emission had been seen as the core issue which is high response to the climate change and global warming. Kyoto Protocol clearly target on the reduction of CO2 emission to all countries of the world. Although the common consensus had not yet been reached by political sections of all countries in the world, the importance and urgency of this issue definitely cannot be ignored.
Generally, CO2 emission was seen as the sequence of energy consumption. The request of CO2 reduction is always emphasized on the energy section from industry, transportation and people’s livelihood necessaries. On the other hand, water resource is well known to be the non-fungible element on this plant. Water resource demands have grown steadily according with the society development. Ensuring the stable supply of water is becoming the fundamental policy in many countries. However, people usually forget to see the energy consumption from the process of water supply and drainage. In fact, the water usage consumes energy from all process of water supply and drainage.
Previous researches and relevant documents reported the reciprocal relationship between water usage from people’s livelihood and electricity consumption1). That is water usage of one degree (m3) approximately equal to one unit electricity consumption (kWh). There are 23 million population and daily water consumption with around 300 liter per day in Taiwan. It is a huge energy consumption item as the accumulation of population is considered2). That is to say, the reduction of CO2 emission should not ignore the contribution of water saving strategy.
The potential of water saving contribution to reduction of CO2 emission is noticed and its quantitative evaluation is necessary to be clarified. Firstly, this research investigated the domestic water use in people’s livelihood in Taiwan and clarified the schematic structure of water consumption. An estimating model was proposed to evaluate the quantitative potential of the energy consumption and CO2 emission from water usage. Eventually, this paper aims on the promotion of saving water society and offers an evaluation method for this target.
2. Reviews and Methodology
Water-saving apparatuses have been seen some remarkable advancement in recent years. In addition to sanitary fixture such as faucet and shower valves, other home appliances-washing machines, dishwashers with advanced water saving capabilities are now appearing on the market3). Water saving can also be the effective strategy to reduce CO2 emission. In a simulation study4), it has been postulated that by 2020 the total CO2 emission in Japan can be reduced to 1 % of 1990 level which is equivalent to 25% of all CO2 emission from kitchen, bathroom and toilet, if emission from residential homes is controlled through popularization of water-saving apparatuses. This study made various organizations both in public and private sectors aware of the importance of society based on water saving concept. Policy-making processes following with this result have started recently in Japan and response to Green Building orientation5). Under the policy of sustainable development by the Taiwan Government, an evaluation of Green Building system, which emphasizes energy conservation, resource protection, low waste, low environmental impact, was developed to improve the ecological living environment from 1999.
In order to improve the work of CO2 emission reduction and clarify the potential of water resource preservation, it is necessary to share the estimation techniques and information to academic researchers, policy makers and relevant people who are involved in the field of water, environment and sustainable construction6). Due to this common consensus, Asia Water saving Council was founded in 2012 Tokyo to promote the importance of water preservation and society based on water saving concept. Indeed, the water issues are different from countries of vary climate and precipitation. Regional and seasonal limitation is inherent in natural water resource. Culture customs and social behaviors also dominate the water consumption in different countries. Therefore, investigation and survey are needed to validate the relevant issues for each country.
3. Estimation model
The bench mark of evaluation between water consumption and CO2 emission would be set as yearly calculation for each item. Thus, the result can compare to the capital CO2 emission for whole country. Calculation from water consumption to CO2 emission is an accumulation by individual process energy consumption. Herein, the yearly CO2 emission from water consumption Tn can be calculated by 2 parameters, and the function is as shown as equation (1).
on pn
n
C p
T ………
(1)T
n:The total CO2 emission in year(n) (kg-CO2/ year)C
pn:The capital CO2 emission per person in year(n) (kg-CO2/person‧year)p
on:Population (persons)The population is constant for a country in above equation. The crucial parameter is the average
CO2 emission per person in year (n) (kg-CO2/ person‧year) Cpn and this parameter is from 2 directions including tap water demand and hot water usage. So, this calculation can be expressed as equation (2) as the following.
C
pn C
pwn C
phn………(2)C
pn:The capital CO2 emission per person in year(n) (kg-CO2/person‧year)C
pwn:The factor of CO2 emission per person in year(n) from tap water(kg-CO2/person‧year)
C
phn:The factor of CO2 emission per person in year(n) from hot water (kg-CO2/person‧year)The calculation of CO2 emission from tap water usage is conducted by the coefficient of tap water CO2 emission kcwn and average yearly tap water consumption volume per person Qpwn. The function is as shown as equation (3).
C
p w n k
c w n Q
p w n………(3)k
cwn:the factor of tap water CO2 emission (kg- CO2/m3)Q
pwn:the average yearly tap water consumption volume per person (m3/ person‧year)The factor of tap water CO2 emission is from 3 sources including energy consumption from clean process of water supply plant, water supply in housing unit and sewage treatment. Meanwhile, the coefficient of electricity energy transfer to CO2 emission is necessary factor to this calculation.
The function can be expressed as equation (4) as the following.
k
cwn ( E
swn E
uwn E
twn) C
en………(4)k
cwn:the factor of tap water CO2 emission (kg- CO2/m3)E
swn:the electricity energy consumption from clean process of water supply plant (kWh/m3)Euwn:the electricity energy consumption from housing unit water supply equipment
(kWh/m3)
E
twn:the electricity energy consumption from urban sewage treatment (kWh/m3)C
en:the factor of electricity energy consumption transfer to CO2 emission in year(n)(kg- CO2/kWh)
On the other hand, hot water usage in housing daily life consumes more energy and cause more CO2 emission. The energy consumption is directly caused by heating process but more complex due to its heating source. Firstly, the calculation can be expressed as equation (5). The average CO2
emission per person in year(n) from hot water Cphn is dominated by the coefficient of hot water CO2
emission (kg- CO2/m3) and the average yearly hot water usage volume per person.
C
phn k
hwn Q
phn………()k
hwn:the factor of hot water CO2 emission (kg- CO2/m3)Q
phn:the average yearly hot water usage volume per person(m3/ person‧year)
The factor of hot water CO2 emission is more complex as above mentioned due to its heating sources. According to investigation, the heating sources have 3 types of energy including gas (LPG), electric heater and solar heating system in Taiwan. The practical usage proportion is approximate 70%, 25% and 5%. Therefore, the coefficient of hot water CO2 emission can be expressed as equation (6) as the following.
k
hwn C
g 0.7 C
e 0.25 C
s 0.05
………(6)k
hwn:the factor of hot water CO2 emission (kg- CO2/m3)Cg:the hot water CO2 emission from gas energy heating source 70% *1(kg-CO2/m3)
C :the hot water CO
e 2 emission from electric energy heating source 25% *1(kg-CO2/m3)
C : the hot water CO
s 2 emission from solar energy heating source 5% *1 (kg-CO2/m3)*1:The practical usage proportion of energy including gas (LPG), electric heater and solar heating system in Taiwan.
4.Evaluation and validation
4.1 Factors of CO
2emission
According to the composition rate of electric power production sources such as oil, coal, nuclear and hydraulic power, the CO2 emission factors for electricity is shifting for each year. Consequently, the factors are not only changing yearly but also different from countries. Fig. 1 show the factors from 1990 to 2010. There is an increasing tendency from 1990 to 2000 in Taiwan, and be stable after 2001 with approximate 0.62 (kg-CO2/kWh). On the other hand, it is stable with around 0.37 (kg-CO2/kWh) except the data of 2007 in Japan.
Fig.1 the electricity factors for CO2 emission from 1990 to 2010
The water usage factors including tap water and hot water are evaluated from 1990 to 2010. A slight increasing tendency is shown in this evaluation for decades in Taiwan. It reveals that the potential of reduction for CO2 emission is existed. Table 1 show the data details during these years.
Table 1 the factors for CO2 emission from 1990 to 2010 Electricity
(kg-CO2/kWh) -Japan
Electricity (kg-CO2/kWh)
-Taiwan
Tap water (kg-CO2/m3)
-Taiwan
Hot water (kg-CO2/m3)
-Taiwan
1990 0.371 0.443 0.344 5.32
1991 0.364 0.475 0.369 5.54
1992 0.357 0.487 0.378 5.62
1993 0.350 0.504 0.391 5.73
1994 0.344 0.509 0.395 5.77
1995 0.337 0.523 0.406 5.86
1996 0.330 0.531 0.412 5.91
1997 0.323 0.556 0.431 6.08
1998 0.314 0.582 0.452 6.25
1999 0.332 0.583 0.452 6.26
2000 0.335 0.602 0.467 6.39
2001 0.336 0.614 0.476 6.47
2002 0.360 0.606 0.470 6.41
2003 0.387 0.624 0.484 6.53
2004 0.374 0.628 0.487 6.56
2005 0.379 0.626 0.486 6.55
2006 0.368 0.637 0.494 6.62
2007 0.407 0.632 0.490 6.59
2008 0.335 0.631 0.490 6.58
2009 0.328 0.616 0.478 6.48
2010 0.320 0.612 0.475 6.45
4.2 CO
2emission of water usage
According to Kyoto Protocol, 1990 is a bench mark year for each country to target the reduction of CO2 emission. It was seen as a very challenge to reach the goal for many countries. In the case of Taiwan, the capital CO2 emission is almost double from 1990 to 2006 as shown as Fig.2. Although it is a difficult mission to fit the Kyoto Protocol bench mark, the government targets the 2000 to be bench mark year and the initial strategy. Due to the carbon credits and exchange mechanism movement, eventually, government policy need to improve and reach the 1990 bench mark.
Fig.2 the capital CO2 emission of Taiwan (ton-CO2/person-year)
The CO2 emission which is caused by water usage has a similar shifting feature with the capital
value of all country in Taiwan. The total water factor of CO2 emission is composed by tap water and hot water usage. However, the increasing rate is less than the capital value and it keeps stable situation after 2000. Fig.3 shows the factors shifting situations of tap water, hot water and total value. The hot water factor has larger value and contribution to the ratio of water factor to capital value. Herein, it also shows that the ratio of water factor to capital value is decreasing from around 3.0% to 2.0%. Table 2 shows the details of these data.
Fig. 3 the factors shifting diagram of water usage.
Table 2 the factors of CO2 emission shifting data of water usage Capital factor
(ton-CO2/p.y)
Tap Water
factor (kg-CO2/p.y)
Hot water
factor (kg-CO2/p.y)
Total water factor (kg-CO2/p.y)
Ratio of capital value
(%)
1990 5.5 35 137 172 3.13
1991 5.9 39 142 181 3.07
1992 6.2 40 144 184 2.97
1993 6.6 43 147 190 2.88
1994 6.9 43 148 191 2.77
1995 7.2 44 151 194 2.70
1996 7.6 46 152 198 2.61
1997 8.1 47 156 204 2.51
1998 8.5 50 161 210 2.47
1999 8.9 48 161 209 2.35
2000 9.7 50 164 214 2.21
2001 9.9 51 166 218 2.20
2002 10.2 49 165 214 2.09
2003 10.5 50 168 218 2.08
2004 10.9 50 169 219 2.01
2005 11.1 51 168 219 1.97
2006 11.4 52 170 222 1.95
2007 11.5 51 169 221 1.92
2008 11.0 50 169 219 1.99
2009 10.4 48 167 215 2.07
2010 11.0 46 166 212 1.93
4.3 Potential of saving water
The water factor of CO2 emission is high related to the water consumption. Fig. 4 shows the shifting volume of daily water consumption per person in Taipei city and other areas of Taiwan. It is obvious that the metropolitan area such as Taipei city has greater water consumption of around 30% up in the other areas of Taiwan. It also shows that water consumption is increasing during 1980s and with peak value in 1990s. The tendency is approximately stable after year of 2000 with Taipei city of around 350 liter per day and the other areas of Taiwan of around 270 liter per day.
Fig. 4 the shifting volume of daily water consumption in Taiwan
According to this stable situation of water consumption, it needs more motivation to improve the water saving strategy and inovate reduction techniques to carry out the goal of saving water society.
Therefore, a quantitative evaluation is necessary to validate the possibility of improvement in water saving activities. The proposed calculation model in this paper can estimate the value of CO2 emission from water usage and evaluate the potential of saving water strategy.
In order to estimate the potential of saving water strategy, the bench mark of saving water society has to be set as target. The saving water facilities such as low flush water closet shower are the practicable step to reduce water consumption. The water use behavior is also a influence factor to reduction stetragy. Due to the facilities performance and water use behaviors is changing, the bench mark should be set as stage target. This paper concludes the stage with 5 years and bench mark target as 250, 200, 175 and 150 liter per day during 1990~2010 in Taiwan.
Eventually, the bench mark of saving water society target on 150 liter per day as the criterion of potential estimation. Fig. 5 shows the diagram of saving water protential and bench mark of saving water society. The potential can be calculated by the diffenence between practical water consumption and criterion of saving water society. That is to say, the quantitative potential of water saving is around 45% and contribution of CO2 emission to capital ration is 0.87% in 2010. It is equivalent to around 2.3 millions ton of CO2 emission for carbon credit. The bench mark of saving water society can be shifted to higher criterion due to improvement of facility performance and innovation of techniques such as rainwater havesting and water recycling system. Therefore, the bench mark criterion of saving water society can shift from 150 to 100 liter per day per person before 2020. The posibility needs more innovation and validation to prove its practicability in the future.
Fig. 5 the diagram of saving water protential and bench mark of saving water society.
5. Conclusion
Sustainability and reduction of CO2 emission is the global consensus in recent years. This research aims on the practicability of society based on saving water concept and links to the reduction of CO2 emission policy. A calculation model is proposed in this paper to estimate the CO2 emission from water consumption. Through investigation of the domestic water use in people’s livelihood,
the structure of water consumption can be schematically understood and the water saving strategy can be concluded. The calculation model had been built to estimate the energy consumption and CO2 emission from water demand and to evaluate the potential of water saving strategy.
Eventually, this research conducted estimation model of CO2 emission from water consumption and validate the potential of water saving strategy in Taiwan. The quantitative potential reveals the motivation of saving water strategy and practicability of society based on saving water concept.
This achievement can be referenced by Asian countries with similar environment and precipitation.
However, more innovation and validation about low carbon society are necessary to be concerned.
In order to carry out the society of saving water and low carbon, the practicability of carbon credit mechanism needs more innovations and further validation in the future.
Acknowledgements
The authors would like to thank the National Science Council of the Republic of China (NSC100- 2221-E-011-119)for financially supporting this research.
Reference
[1] C.L. Cheng, ‘Study of the Interrelationship between Water Use and Energy Conservation for a Building’, Energy and Buildings, UK, Vol 34 Iss 3, pp261-266, 2002.
[2] C.L. Cheng, W.J. Liao, 2011, ‘Current situation and sustainability of water resource in Taiwan’, 2011Asian Water Saving Council, Japan
[3] Yasutoshi Shimizu,2011, ‘ CO2 Reduction Potential in Japan through Saving Water’, 2011Asian Water Saving Council, Japan
[4] Kanako Toyosada,2011,A study on Environmental Prediction in Japan , 2011Asian Water Saving Council, Japan
[5] Ling-Tim Wong,2011, ‘Significance of water circumstances and the saving water in Hong Kong’, 2011Asian Water Saving Council, Japan
[6] K.C. He, Y. K. Juan, C.L. Cheng, G. M. Lin, 2011,‘ The research and application for green water system’, CIB-W62 International Symposium, September, Portugal.
[7] W.J. Liao, C.L. Cheng, K.C. He, C.H. Hsieh, Y.C. Liu , 2011,‘Research of Public Toilet Equipment Quantity in MRT Station’, CIB-W62 International Symposium, September, Portugal.
國科會補助計畫衍生研發成果推廣資料表
日期:2013/09/10
國科會補助計畫
計畫名稱: 建築節水策略與CO2排放評估模式之研究 計畫主持人: 鄭政利
計畫編號: 101-2221-E-011-156- 學門領域: 建築都巿
無研發成果推廣資料
101 年度專題研究計畫研究成果彙整表
計畫主持人:鄭政利 計畫編號:101-2221-E-011-156- 計畫名稱:建築節水策略與 CO2 排放評估模式之研究
量化
成果項目 實際已達成
數(被接受 或已發表)
預期總達成 數(含實際已
達成數)
本計畫實 際貢獻百
分比
單位
備 註 ( 質 化 說 明:如 數 個 計 畫 共 同 成 果、成 果 列 為 該 期 刊 之 封 面 故 事 ...
等)
期刊論文 0 0 100%
研究報告/技術報告 0 0 100%
研討會論文 3 3 100%
論文著作 篇
專書 0 0 100%
申請中件數 0 0 100%
專利 已獲得件數 0 0 100% 件
件數 0 0 100% 件
技術移轉
權利金 0 0 100% 千元
碩士生 2 2 100%
博士生 1 1 100%
博士後研究員 0 0 100%
國內
參與計畫人力
(本國籍)
專任助理 0 0 100%
人次
期刊論文 0 0 100%
研究報告/技術報告 0 0 100%
研討會論文 0 0 100%
論文著作 篇
專書 0 0 100% 章/本
申請中件數 0 0 100%
專利 已獲得件數 0 0 100% 件
件數 0 0 100% 件
技術移轉
權利金 0 0 100% 千元
碩士生 0 0 100%
博士生 0 0 100%
博士後研究員 0 0 100%
國外
參與計畫人力
(外國籍)
專任助理 0 0 100%
人次
其他成果
(無法以量化表達之成
果如辦理學術活動、獲 得獎項、重要國際合 作、研究成果國際影響 力及其他協助產業技 術發展之具體效益事 項等,請以文字敘述填 列。)
無
成果項目 量化 名稱或內容性質簡述
測驗工具(含質性與量性) 0
課程/模組 0
電腦及網路系統或工具 0
教材 0
舉辦之活動/競賽 0
研討會/工作坊 0
電子報、網站 0
科 教 處 計 畫 加 填 項
目 計畫成果推廣之參與(閱聽)人數 0
國科會補助專題研究計畫成果報告自評表
請就研究內容與原計畫相符程度、達成預期目標情況、研究成果之學術或應用價 值(簡要敘述成果所代表之意義、價值、影響或進一步發展之可能性)、是否適 合在學術期刊發表或申請專利、主要發現或其他有關價值等,作一綜合評估。
1. 請就研究內容與原計畫相符程度、達成預期目標情況作一綜合評估
■達成目標
□未達成目標(請說明,以 100 字為限)
□實驗失敗
□因故實驗中斷
□其他原因 說明:
2. 研究成果在學術期刊發表或申請專利等情形:
論文:■已發表 □未發表之文稿 □撰寫中 □無 專利:□已獲得 □申請中 ■無
技轉:□已技轉 □洽談中 ■無 其他:(以 100 字為限)
3. 請依學術成就、技術創新、社會影響等方面,評估研究成果之學術或應用價 值(簡要敘述成果所代表之意義、價值、影響或進一步發展之可能性)(以 500 字為限)
本研究計畫之內容已經於計畫期限內執行完畢,研究成果也已經發表於 CIBW62 建築國際
研討會,研究之部分成果並彙整投稿於 SCI 國際學術期刊,目前正投稿中。「節水」不僅
是為了有效利用水資源,還關係到二氧化碳排放量的削減,相對於能源及其他資源項目具 有多元的替代可能性,而水不但沒有可替代物,水資源還會因地域的不同與季節變化而具 有不穩定的特性。因此,對於潔淨淡水資源的有效利用,以及建築物給水設備系統的節水 設計與管理控制就顯得更為重要。近年來建築節水設備發展十分迅速,以日本為例,節水 型衛生器具對於削減住宅二氧化碳排放有顯著效果。一般家庭日常生活中使用的給排水相 關設備,CO2 排放量約佔日本的 CO2 總排放量的 5%。根據模擬研究推估結果顯示,由於 節水器具的普及及各種節水措施的推展,預測至 2020 年,日本的二氧化碳排放量與 1990 年相比,來自與給排水相關的住宅設備 CO2 排放量將具有削減 25%的潛力,使日本 CO2 排放總量達到消減 1%的目標,由此可知推動節水型社會的重要性。台灣各部門能源消耗 的排放 CO2 貢獻度,若由部門分攤電力消費加以計算,於 1990~2009 年間,以服務業部門 之成長率較高,其次分別為住宅、工業、運輸與能源轉換部門。住宅部門仍居 CO2 排放高
比例位置,因此國內日常生活用水採用「開源」、「節流」技術及策略有其必要性。本研究
之主要目的,首先將根據家庭生活用水及相關耗能比重,透過訪談與問卷調查方式,掌握 大型都會地區之節水設備與衛生器具之使用概況。其次,衛生間及浴室等用水相關住宅設 備,除了消耗水資源與相關電力能源外,同時還會產生環境負荷及 CO2 排放,本研究將建 立住宅用水設備產生 CO2 總排碳量之推移及預測模式,發展透過節水來削減 CO2 排放之可
行技術與策略,以協助國人建構一個節能減碳之節水型社會。自評計畫執行順利圓滿,研 究成果良好,對國內建築專業學術領域及建築實務有具體之貢獻。