行政院國家科學委員會專題研究計畫 成果報告
建立蛋白質免疫沉澱資料庫並改善預測轉錄調控因子的準 確度(第 2 年)
研究成果報告(完整版)
計 畫 類 別 : 個別型
計 畫 編 號 : NSC 98-2221-E-468-018-MY2
執 行 期 間 : 99 年 08 月 01 日至 100 年 07 月 31 日 執 行 單 位 : 亞洲大學生物資訊學系
計 畫 主 持 人 : 洪炯宗
計畫參與人員: 碩士班研究生-兼任助理人員:喻崇驊 碩士班研究生-兼任助理人員:蕭惠璘 碩士班研究生-兼任助理人員:林佩君
處 理 方 式 : 本計畫可公開查詢
中 華 民 國 100 年 10 月 17 日
行政院國家科學委員會補助專題研究計畫 ■成果報告
□期中進度報告
建立蛋白質免疫沉澱資料庫並改善預測轉錄調控因子的準確度
計畫類別:■個別型計畫 □整合型計畫 計畫編號:NSC 98-2221-E-468-018-MY2
執行期間: 2009 年 8 月 01 日至 2011 年 7 月 31 日 執行機構及系所:
計畫主持人:洪炯宗 共同主持人:
計畫參與人員:
成果報告類型(依經費核定清單規定繳交):□精簡報告 ■完整報告
本計畫除繳交成果報告外,另須繳交以下出國心得報告:
□赴國外出差或研習心得報告
□赴大陸地區出差或研習心得報告
□出席國際學術會議心得報告
□國際合作研究計畫國外研究報告
處理方式:除列管計畫及下列情形者外,得立即公開查詢
□涉及專利或其他智慧財產權,□一年□二年後可公開查詢
中 華 民 國 100 年 9 月 30 日
目錄
前言……… 1
目的……… 2
背景……… 3
研究方法……… 5
結果與討論……… 13
結論……… 23
參考文獻……… 24
計劃成果自評……… 28
中文摘要 :
研究基因表現的調控機制需要對於調控過程與參與其中的元素有完整的認識, 其中一 個主要的挑戰是辦識轉錄調控因子的接合位置。傳統的以計算方式辨識特定基因群的調控因 子的系統。此系統仍存在一些缺點如過高的假陽性(false positive)預測結果,以致在實用 上仍有所限制與不便。為了克服此一缺點,我們收集己發表的蛋白質免疫沈澱(ChIP)實驗結 果來建立一個蛋白質與 DNA 接合點資料庫,並應用近來被發現的一些新的知識來開發新的 方法以整合我們己有的系統與新的實驗技術所產出的數據用以提昇預測基因調控因子與其 接合點的準確度。此資料庫將搜集各種不同類別的 ChIP 實驗結果並整合用以分析或展示此 類資料特性的工具,並提供完善好用的介面給此資料庫的使用者。建立此一 ChIP 資料庫系 統在提供一個經實驗驗証的轉錄調控知識上將有顯著的供獻,有助於建立一個更精確的預測 模型。隨後,我們將會運用此資料庫裡的龐大且真實的轉錄因子接合位置的知識並整合新的 計算技術來開發新的轉錄因子接合位置預測方法。在輸入特定的如表現一致的基因群後將能 利用我們新開發的計算方法來進行更精確的基因分群,然後用來找出它們上游調控區上共同 保留的特徵。DNA 上結構相關的資訊如演化保守區域與 CpG islands 等,將被用來提昇預 測結果的精確度。最後,調控因子目標基因群的生物功能分析將能提供預測出來的調控因子 在生物功能上的意義。建構此 ChIP 資料庫系統與開發上述的方法預期能提昇預測轉錄調控 因子的準確度。此外,一個準確的接合點模型會被開發出來讓我們更清楚的了解真實的細胞 調控機制。
中文關鍵字: 基因調控,調控因子,接合點,蛋白質免疫沈澱
英文摘要:
Identification of transcription factor binding sites is a major challenge to the understanding of gene expression regulation. Understanding the regulation of gene expression requires a complete knowledge of the regulation process and all related elements. One of the drawbacks of previous approaches is the high false positive rate of prediction. To overcome this problem, this project created a ChIP database and develop methods that integrate our system with new experimental techniques and related knowledge to improve accuracy of transcription factor binding site prediction. The proposed database collects various types of ChIP experimental results, integrates the tools used in analysis or representation of the ChIP data and will provide a useful interface for the database users. The creation of a ChIP database will be a significant contribution to experimental verified knowledge on transcription factor binding. The database knowledge is helpful for construction of a more accurate prediction model. We will then use the database to develop methods to predict transcription factor binding sites using real binding profiles from the ChIP database and an integration of new computational approaches. Inputted co-expressed genes will be clustered by the new approach and then used to discover conserved features in their upstream regions. Structural information such as phylogenetic conservation and the presence of CpG-islands will be used to improve the precision of prediction. Finally, biological functional analysis display of target genes will provide information on the biological regulation of gene function by transcription binding factors.
The construction of the ChIP database system and the development of the proposed approach are expected to improve the accuracy of transcription factor binding site prediction. In addition, an accurate binding model should be developed that will reveal the real basis of cellular regulation mechanisms.
英文關鍵字: ChIP database, transcription regulation, binding site, phylogenetic footprinting.
前言
The challenge in this study is to identify transcription factors of co-expressed gene group. We developed an approach based on phylogenetic footprinting [1] and use this approach to implement a web system to evaluate conservation tendency of evolutionally conserved binding sites in upstream sequences of a co-expressed gene group. We use 7 known TFs and their targets to test the proposed system. The results show that the system is able to help biologists identify possible transcription factor regulated gene groups that have co-regulated gene expression.
Comparative sequence analysis is effective at identifying and characterizing genomic regulatory regions with a functional role [2-4]. “Phylogenetic footprinting” can be used to predict regulatory elements. Phylogenetic footprinting was introduced by Tagle et al. [1]. The assumption of phylogenetic footprinting is that regulatory elements with a function are evolutionarily conserved, and that there are fewer alterations in their sequence compared to the DNA that they are embedded in. It has been shown that conserved non-coding DNA between genomes is more likely to be functional [5-7], so it is possible that functional and nonfunctional transcription factor binding sites (TFBSs) may be distinguished by comparative sequence analysis.
Cliften et al. [8] was able to find sequence motifs that may be the targets of transcriptional regulatory proteins in six Saccharomyces species by phylogenetic footprinting. Kellis et al. [9]
was able to identify genes and regulatory motifs in three Saccharomyces cerevisiae related species by comparative analysis. Doniger, Huh, and Fay [10] calculated the probability of binding site conservation between S.Cerevisiae and its two closest relatives under a neutral model of evolution.
Loots et al. [11] combine the clustering of predicted TFBSs and the analysis of interspecies sequence conservation in order to identify functional sites. ConSite[12, 13] reports putative TFBSs that are both situated in conserved regions and located in the same positions in the alignment results for two orthologous sequences. ConSite uses phylogenetic footprinting to identify potential TFBSs and yields greater specificity than the approaches based on profiles searches of single genomic sequences. Corcoran et al. [14, 15] compare pairs of putative binding sites in two species and assign two probability scores based on the relative position of the sites in the promoter.
A system for analyzing the motifs found in upstream conserved regions of the human and mouse genome was designed and implemented. The analytical results are stored in the database.
Users can input a motif and the system returns motif distributions for all orthologous gene pairs.
After that, users can input a gene group and the system returns the gene group and the whole genome statistics.
目的
The specific aims are the creation of a database of chromatin immunoprecipitation experimental results and the use of this database to improve the accuracy transcription factor prediction.
In the first step, we will focus on the creation of a chromatin immunoprecipitation (ChIP) database. High throughput chromatin immunoprecipitation methods such as ChIP-on-chip, ChIP- PET and SABE are reliable methods for the identification of genomic targets and have been widely used recently to study transcription regulation. There is no public databases designed specifically for ChIP assays that integrate the various types of ChIP assay; hence, there is a need to create such a ChIP database. We will collect ChIP data from existing databases such as NCBI GEO and TransFAC as well as the published literature. Our collaborator is responsible for the production of ChIP data using SABE. The results produced by this approach will need to be integrated and stored in a standard format before being applied at a later stage during large scale genome comparisons. Tools will be developed and integrated in the database for target identification and binding model construction. The creation of the ChIP database will be a significant contribution to gene regulation analysis.
After the development of the database, we will focus on the construction of the prediction model. A two-stage clustering method will be applied to obtain gene expression clustering. Next, we will use phylogenetic footprinting to reduce the false positive rate for binding site identification and cis-module construction. Real binding sites in our proposed ChIP database will next be used to construct cis-modules. Some promoters in particular regions, specifically inactive regions, that show a richness of binding sites but a lack of binding/expression, will be identified.
These inactive regions have not been considered in previous studies but will be included in this project. We believe that the identification of such inactive areas will help us to reduce the noise during cis-module identification. Through the use of real binding data from the ChIP database, we expect to tune the prediction model such that there will be a significant improvement in the accuracy of transcription factor binding site prediction.
Finally we will test our system by applying it and comparing it with chromatin immunoprecipitation experiments produced by our group. The experimental verification will be
背景
Transcription factor binding sites
The success of these methods depended on the accurate identification of the TF binding sites.
A traditional way to identify TF binding sites is by searching for sequences containing known TF motifs in the upstream region. The motif is usually defined using a PWM (position weight matrix) and this is constructed by counting the nucleotide presentation rate at each position in the binding site sequences. A measurement of similarity between a motif and a nucleotide sequence then becomes the score. A site is identified as a TF binding site if the score exceed a threshold and the threshold is the cutoff. Therefore, the choice of cutoff determines the accuracy of the TF binding site identification and this directly influences the reliability of module identification. However, sampling conditions, including tissue, timing and environmental factors when constructing a gene group for such studies, are not always same. As a result it may not be possible to define a globally suitable cutoff. This will result in a high false positive discovery rate when PWM is used to identify TF binding sites. Recently, chromatin immunoprecipitation (ChIP) has been used widely to accurately identify the real binding sites of a TF [16-18]. Although ChIP improves the reliability of binding site identification, there are still limited to the application of this approach. One of the restrictions is that an appropriate antibody for the target TF is necessary in order to carry out a ChIP experiment and these are not necessarily available for every TF. Another restriction is that the conditions under which a ChIP experiment is carried out are not identical to those used during the gene expression experiment that constructs the gene group. Moreover, the wide application of ChIP in order to monitor many TFs at the same time is difficult to put into practice. In these circumstances, it would be useful to improve the accuracy of PWM and reduce the system noise when identifying TF binding sites, which will, in turn, reduce the number of ChIP experiments required for verification.
Transcription regulation modules
Several previous studies, aimed at identifying TF cooperation or pinpointing so-called TF modules, have been based on co-occurrence of TF binding sites in a set of promoters [17, 19, 20].
Initially, the region that is upstream of a gene group was scanned for certain cis-elements; these include known motifs or over-represented oligo-nucleotides. The site combinations of such elements are next estimated for the co-occurrence in the gene group.
One approach to reducing the bias associated with the clustering of a gene group is to avoid using a gene group at all. This can be done by the direct mapping of motifs in the target promoter together with the expression level of the target gene. For example, Hermsen et al. treated each motif or module as a logic gate in a regulation circuit in order to model the regulatory relationship between TF gene expression level as the input signal and target gene expression as the circuit
output [21].
Alternatively, Faith et al. adopted a machine learning approach to map TF expression to expression targets directly [22]. In addition, the matching score of a motif can be considerate during the mapping because the stability of TF binding may affect the ability of the regulation module to regulate. In this context, Das et al. uses a linear spline approach to model the relationship between TFs and the targets’ expression levels using the PWM scores to optimize an appropriate cutoff for the various different motifs under different conditions [23]. As stated earlier, sampling conditions are usually vary too much to allow the definition of global modules. As a result of this, some studies have focused on a specific module under specific conditions; these include tissue specific modules [16, 23-25] or temporal specific modules [17, 25].
Phylogenetic footprinting
Phylogenetic footprinting is wildly used in recent analysis of transcription regulation to advantage the prediction accuracy. ConSite [26, 27] is a web-based tool for discovering cis-regulatory elements. It uses known transcription factor binding profile to discover putative binding site. The putative binding sites are compared with conservation region of globally aligned orthologous upstreams to filter the conserved binding site. CNBs are calculated by 50 bps sliding window. rVista [28] uses known site PSSM to scan the positions of putative transcription factor binding site. A 21 bps sliding window is used to evaluate the binding sites conservation.
CONREAL [29, 30] analyzes the order and the sequence of transcription factor binding matrix in human and mouse orthologous promoter. Three different alignment algorithms used to find conserved transcription factor binding site. Footer [31, 32] is also based on phylogenetic footprinting algorithm. It combines two probability scoring function to scores putative binding sites based on the relative position of sites in the promoter. Algorisms are described in before that needs prior information of transcription factor binding site. An enumerative method combines phylogenetic footprinting for transcription factor binding site prediction [33, 34]. The occurrence of all possible binding sequences is scanned and then filter by gene function annotation and gene expression profile. The method finds not only known transcription factor binding site but also novel binding sites.
研究方法
This system is designed to record information about motif location within human and mouse upstream sequences, the presence of conserved regions between orthologous gene pairs and the number of motifs within each orthologous gene pair. The system searches for motifs within the upstream regions of the human and mouse genes. The gene group to be used may be constructed based on the cluster analysis of gene expression or formed from genes considered potentially to be regulated under specific transcriptional regulation mechanisms (for example, the RgSMiner [35]).
Graphical web interfaces are used to show the motifs within the upstream region. The database also stores user profiles and analytical histories.
The human and mouse upstream sequences are retrieved from the Ensembl Core database.
Ensembl [36] is a joint project between EMBL-European Bioinformatics Institute (EBI) and the Wellcome Trust Sanger Institute (WTSI) to develop a software system that produces and maintains automatic annotation of selected eukaryotic genomes. The Ensembl Core databases store genome sequences and most of the annotation information. The annotation information contains the genes, transcript and protein models annotated by the Ensembl automated genome analysis and annotation pipeline. In addition, Ensembl Core databases include assembly information, cDNA and protein alignments, external references, markers and repetitive regions.
Ensembl provides a comprehensive set of Application Programme Interfaces (APIs). The APIs serve as a middle layer between underlying database schemes and more specific application programs to ease the complexity of using Ensembl databases. The APIs encapsulate the database schemes and this provides efficient highlevel access to data tables and these are separate applications from any data schemes changes. Thus, API users can upgrade their database without modifying the code when accessing Ensembl databases. Both Perl and Java APIs are provided by Ensembl.
We used Ensembl database v36 for the implementation of the Mootprinting system. The data of Ensembl human database is based on the NCBI 35 assemble (June 2004). The data of Ensembl mouse database is based on the NCBI m34 mouse assembly (May 2005). The data entries used in the Mootprinting databases currently are shown in Table 1. We only use the protein-coding genes to find orthologous gene pairs.
Table 1. Source of genes in Mootprinting database
Category Ensembl source All entries Protein coding Homo sapiens genes homo_sapiens_core_36_35i 34255 22209
Mus musculus genes mus_musculus_core_36_34d 27640 24754
The Ensembl Compara databases store the results of genomewide species comparisons. The comparative genomic dataset contains pairwise whole genome alignment results, ortholog predictions and protein family clusters. We used the ortholog predictions from the Ensembl Compara databases. The orthologous genes in Ensembl Compara databases represent the best reciprocal BLAST hits for the two species. The pairs are obtained by a combination of BLAST and location information for more closely related species. This is because the orthologous genes identified are necessarily the only potential ortholougs and one gene may map to more than two genes in the Ensembl Compara databases. The orthologous gene pairs we use in the Mootprinting database are gene pairs that come from related chromosomes. The number of orthologous gene pairs present in the Mootprinting database is 19075.
We used the BLAST 2 Sequence program [17] rom the NCBI BLAST software package to find local alignments between two sequences. Blast 2 Sequence program is a tool based on BLAST for aligning two protein or nucleotide sequences. BLAST 2 uses the BLAST algorithm for pairwise DNA–DNA or protein–protein sequence comparisons and evaluates the statistical significance of matches. BLAST 2 Sequence program allows user to postulate evolutionary and functional relationships between sequences.
The BLAST 2 Sequence program version 2.2.12 aligned the human and mouse gene upstream nucleotide sequences using the standard parameters of ‘-p blastn’ and the default matrix BLOSUM62. There are 19,073 human and mouse orthologous gene pairs in the analyzed Ensembl Core databases. After alignment, we obtained the following information. If the alignment started from exon 1 upstream, there are 19,050 orthologous genes that have conserved regions. The average number of conserved regions per gene pair is 8.62 and the average length of the conserved regions is 25.12 bp. If the alignment starts from the translation start site upstream, there are 19,056 orthologous genes that have conserved regions. The average number of conserved regions per gene pair is 9.39 and the average length of the conserved regions is 26.71bp.
The system flow
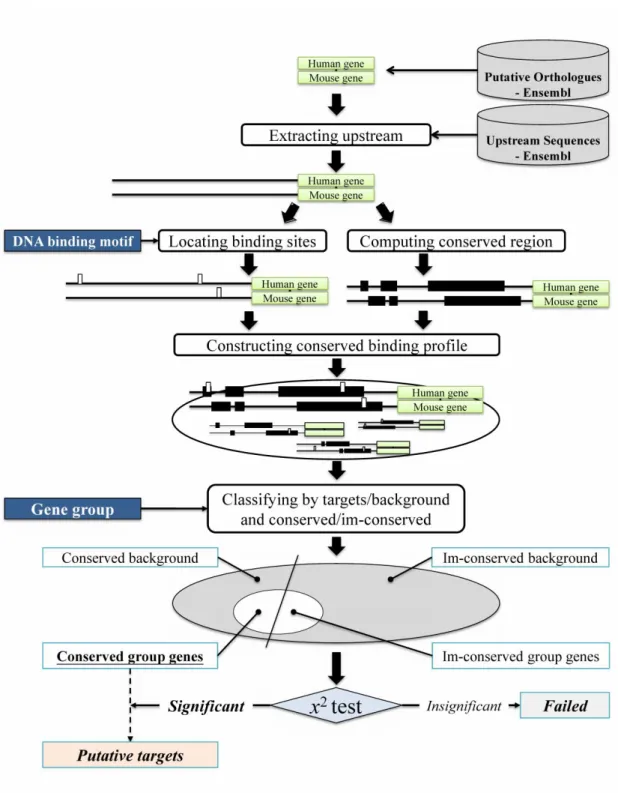
Figure shows the system flow for analyzing the motifs within the upstream sequences.
Figure 3. System flow to analyze the motifs within the upstream sequences Data preprocessing
Searching motifs within the upstream sequence of all orthologous gene pair is time-consuming. Therefore, the system uses a suffix array to shorten the search time. The upstream sequence is retrieved using an Ensembl Perl API from the species-specific Ensembl Core databases. The length of the upstream sequence is restricted to 3000 bp before the gene start position or exon 1 start position. The system builds a suffix array for each upstream sequence, and stores the suffix array results into binary files in order. When user motif is inputted, the system
looks up locations of the motif quickly by searching the suffix array files.
For checking whether the motif is in a conserved region, the first step is to obtain all orthologous gene pair using an Ensembl Perl API from the Ensembl Compara database. Next the upstream sequences of orthologous gene pairs are retrieved by Ensembl Perl API from the species-specific Ensembl Core databases. The upstream sequences are aligned by BLAST. To speed up checking conserved region process, the alignment results are stored in Mootprinting database. The conserved regions are then mapped to the binary file. The binary file first is filled with ‘\0’, and the conserved regions are converted into binary file locations. The conserved region part of the binary file is filled by ASCII code except for ‘\0’. When we want to check whether the motif location is in the conserved region, we can convert the motif location to a file location and check the file location character. When the file location character is not ‘\0’, we can know that the motif is in the conserved region. We can use binary file indexing to reduce the time needed to search the conserved regions in database.
Identification of transcription factors
At first, users submit a DNA binding motif, which can be based on the transcription regulatory sites or analysis of sequences that could be a TFBS. The system searches all locations of the motif within human and mouse upstream sequences, and estimates whether the location is in a conserved region or not. The system then calculates the numbers of locations in conserved regions that are conserved for each orthologous gene pair. The location information and the location summations for the orthologous gene pairs are stored into Mootprinting database. After completing the above steps, the users can now input a set of genes, which may be based on gene expression analysis. The system retrieves the submitted genes data from the pre-calculated motif database. The system integrates the motif location for the whole genome relative to the submitted gene group and then the system displays the statistics for the gene group compared to the whole genomes.
The statistics use the χ2 test. The χ2 test [37] is used to test the significance of deviation from an expected value. The closer the observed frequencies are to the expected frequencies, the greater the weight of evidence in favor of independence. When the χ2 test values exceed the threshold
The observed value of gene group with the conserved motif is calculated as follows:
(5 + 541) × (5 + 253)
5 + 253 + 541 + 18275= 7.3571 Following the equation, we can get all the expected values in Table . Table 2. χ2 test example
The expected value With conserved motif w/o conserved motif
Gene group expected value 5 252
Genome background expected value 541 18,275
Implementation
A web-based system are developed called “Mootprinting” that can be accessed by any users from the World Wide Web. This system is implemented using the MySQL relational database management system version 5.08 under the Linux operation system (Fedora Core 5, Linux kernel-2.6) and uses an Apache as web server, PHP4 as the server-side script and HTML and JavaScript as homepage languages. We also used in some places Perl and Perl modules (Ensembl Perl API library) to obtain sequence data from the Ensembl databases.
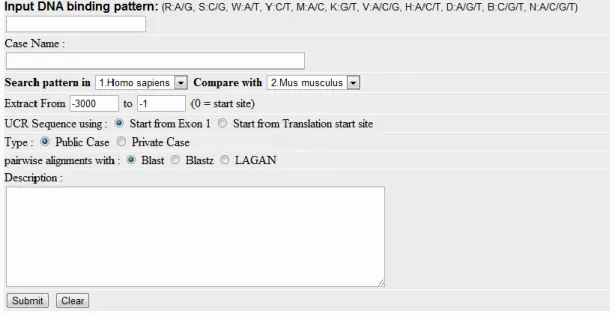
Figure 2. Input page of Mootprinting
Figure shows the data input page. The first step when using the system is the inputting of a motif. Using this page, users can input DNA binding patterns by extended IUPAC code (A, T, C, G, R:A/G, S:C/G, W:A/T, Y:C/T, M:A/C, K:G/T, V:A/C/G, H:A/C/ T, D:A/G/T, B:C/G/T, N:A/C/G/T). Users can then input a case name, choose the initial species and the species to be compared with, the start position for the gene coding regions, the end position for the coding regions, whether the case is a public case or a private case, and a description of the case. When motif searching is finished, the completed case can be found on the case page. We can then input a gene group to the summary page. The gene group data can be Ensembl Gene IDs, UniGene IDs, Gene Symbols or Locus IDs. We suggest that the use of the Ensembl Gene ID is better because these Ids, except for Ensembl Gene Ids, may map genes to more than two sites per species or may not map to the gene at all in the current Ensembl database.
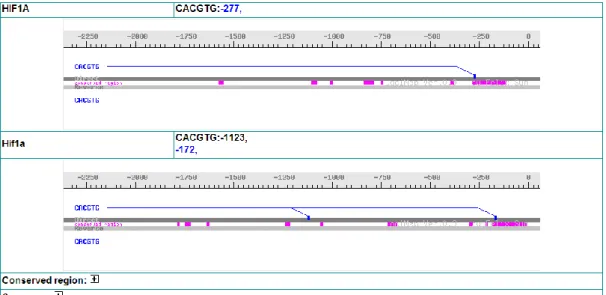
Figure 3. LociMap
Loci Map is a graphical display shows transcription factor binding site location and conserved regions in promoter sequence of two homologous genes.
After the system has finished the motif searching step, the system provides a detailed summary of the finished case. The summary page contains information about the number of genes, the number of orthologous gene pairs and the motif statistics for the two species. The details of the various genes’ motif statistics can be accessed from the gene list page by clicking the link. In gene list page, the system provides Ensembl Gene ID, Gene Symbol, Orthologous gene, and LociMAP.
On the LociMAP page (Figure ), the system provides motif location, conserved regions and gene upstream sequences for the two species.
The result of binding site distribution profile can’t be finished immediately because of the huge amount of computation in whole human and mouse promoters. The analysis case would put in a queue of unfinished cases. When the case was finished, it would show in cases list. The page of case view shows basic information of the case (Figure ), the binding site conservation and distribution in Human and Mouse promoters. Use can submit gene group in this page to test significance of regulation possibility by statistical method. Every testing gene group will store and list in a groups list. Moreover, user can assign a specific background by submit a group of genes to customize background in statistical testing.
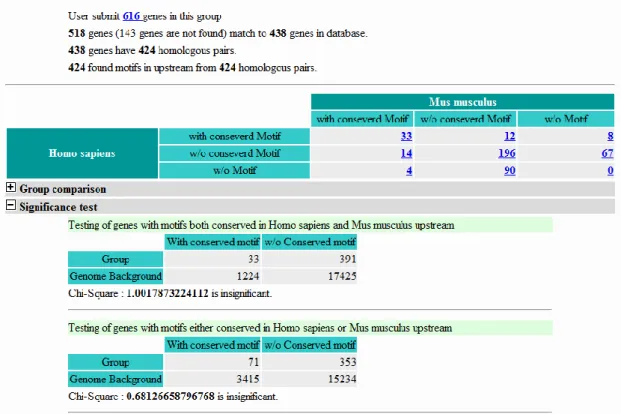
After submitting the gene group, the system shows information about query data (Figure ), the genes making up the query data mapping, the orthologous genes pair, the x2 tests of the query genes and the x2 tests of the whole genome. The first x2 test compares the orthologous gene pairs that have the motifs in the conserved upstream sequences of the two species. The second v2 test compares one of the orthologous gene pair having a motif in a conserved upstream region with the one that has a motif anywhere in the upstream sequence. The third v2 test compares orthologous gene pairs that have the motif in the species upstream sequences. The fourth v2 test compares the Figure 4. Case summary view
situation when only orthologous gene pair has a motif in the upstream sequence. The fifth v2 test compares an orthologous gene pair when both have the motifs in the conserved upstream sequences. The background is genes that have the motif in the upstream sequence and the threshold of v is set to 3.84.
Figure 5. Group test view
結果與討論
We tested six testing cases that listed in Table . A DNA consensus 5’–CTA(A/T)4TAG/A–3’ is bound by MEF2 (myocyte enhancer factor 2) in adult mouse skeletal muscle [38]. The binding consensus of myogenin 5’–CASCTG–3’ is from six similar mouse binding sequences R00019, R00850, R04158, R00242, R14857 and R14858 of mouse myogenin data T00528 found in TransFAC[39, 40] version 8.3. 93 genes are targets of transcription factor E2F4 that reported in an analysis of cell cycle arrest network module, based on ChIP-on-chip data [41]. A ChIP-CpG microarray analysis shows that E2F4 binding E2F site 5’–TTTSSCGC–3’ [42]. NF-Y is a histone fold trimmer and binds the CCAAT box. 91 canonical and complex transcriptional units are identified and classified by Testa et al. using ChIP-on-chip experiments on liver HepG2 cell line [43]. ERα (estrogen receptor α) binds EREs (estrogen response elements) on promoters of target genes to regulate gene expression. 70 putative ERα target genes identified by ChIP-on-chip experiment and ERE half-site (5’–GGTCA–3’) is occurred in all of promoters of target genes [44].
As show in Table , real binding profiles have significant conservation tendency. Show that our method was suit for targets identification.
Table 3. Conservation tendency in transcription factor binding profiles based on previously published data sets
Transcription factor
Binding motif Start site
Targets Background
x
2C# NC# C# NC#
MyoD (E-box) [45, 46]
CANNTG
TSS 60 42 6710 12261 24.374
ORF 60 42 7453 11518 16.220
Myogenin [47] CASCTG
TSS 44 78 2409 16542 58.992
ORF 54 68 2746 16205 85.784
MEF2 [38] CTAWWWWTAR
TSS 3 26 154 18890 32.254
ORF 4 25 168 18876 54.010
E2F4 [41] TTTSSCGC
TSS 4 78 104 18887 27.193
ORF 3 79 128 18863 10.661
NF-Y [43] CCAAT
TSS 10 38 1673 17352 8.626
ORF 11 37 1642 17383 12.344
ERα [44] GGTCA
TSS 12 48 1785 17228 7.892
ORF 14 46 1935 17078 11.283
“Start site”: Genomic fragments of 3000 bp from either the transcription start site (TSS) or from the translation start sites (ORF) of the human-mouse orthologous gene pairs were submitted for analysis. “Targets” is the distribution of human-mouse conservation in targets of the transcription factor. “Background” is the distribution in background genes. “C” is the number of orthologue pairs which have at less one transcription factor binding site located in
both human and mouse CNBs. “NC” is the number of orthologue pairs which have no binding site located in both human and mouse CNBs.
Random data set testing
Myc is a transcription factor of the basic-helix-loop-helix-leucine zipper (bHLH-LZ) family that can influence the activation or repression of genes. Myc activates gene expression through another bHLH-LZ protein, Max, and binds to the DNA sequence CACGTG, which is called the E-box. Myc represses gene expression via transcription factor binding, for example, Miz-1, by binding to various different DNA sequences. Fernandez et al. [48] studied Myc target genes by chromatin immunoprecipitation (ChIP). Chromatin immunoprecipitation assay is used to identify the binding of transcription factors. We used the Myc-target genes as a case study. We submitted the CACGTG motif, starting from exon 1 with an upstream range from -2000 to -1 into the system.
Table shows the location distribution of the E-box in human and mouse upstream regions. There are 546 orthologous gene pairs that both have this motif in a conserved region across 19,073 orthologous gene pairs. In total, there are 7793 orthologous gene pairs that have the CACGTG motif in their gene upstream sequences.
Table 4. The location distribution of the E-box in human and mouse upstream regions Mus musculus
with conserved
motif w/o
conserved motif w/o motif
Homo sapiens
With conserved
motif 546 31 138
w/o conserved
motif 21 1224 2931
w/o motif 86 2816 11280
"With conserved Motif" means that there is a motif located in upstream conserved region. "w/o conserved Motif" means that there is a motif but it is not located in upstream conserved region. "w/o Motif" means that there is no motif located in upstream sequence. For example, there are 546 orthologous gene pairs having motifs in the conserved region of human and mouse upstream regions.
There are 138 orthologous gene pairs that have motif in the conserved region of human but do not
Perfor mance
in predict ion of regulat
ion targets
C onserv ation tendency allow us to test whether a group of genes are targets of the binding site or not. Further, we want to know which gene is the binding target. A testing of target identification is shown is Table 6.
We tested five cases from Table that have targets more than 30. A part of targets are selected randomly and combine with half, equivalent and double of random choice non-target genes for a testing target set. Each case of specific condition generates 10 testing target set randomly. Just confirm with our assumption, x2 test became lower when noise ratio from half to double but the sensitivity are same because of number of true targets keep the same. The specificity is dropped when the noise ratio became higher. But the specificity is high then 60% in our testing cases when the noise ratio less than 50%. The results of target identification show a highly probably of that the gene is the target of a transcription factor if the gene have conserved binding site in both of human and mouse promoters.
Table 5. The random test for Myc targets and random gene groups Gene
group #genes #Mapped genes
#Orthologous pairs
#motif in human
Have H-M conserved
x
2Myc-targets 255 241 262 156 35 105.2456
Random 1 255 259 255 61 8 0.048278
Random 2 255 255 259 76 8 0.048278
Random 3 255 255 258 73 6 0.271326
Random 4 255 255 258 71 9 0.368204
Random 5 255 255 257 59 5 0.788053
"#genes" is the genes number that user submits into the system. "#Mapped genes " is the number of genes that can be found by gene symbol in Ensembl Core databases. The genes that cannot be found in Ensembl databases maybe using an alias name that is not in the Ensembl Core database. "#Orthologous pair" means the number of orthologous pairs. One gene may have multiple orthologous pairs. Therefore, "#Map genes" is not equal to
"#Orthologous pairs". "Motif in human" means the genes that the E-box motif is found in the human upstream region. The Human-mouse conserved x2 test compares the orthologous gene pairs that have motifs conserved in both human and mouse upstream sequences.
Table 6. Testing of regulation target prediction using Mootprinting
Factor Binding site
Original targets
Testing targets Sensitivity Accuracy
#genes x2#noise #target x2 #TP % #positive %
MyoD (E-box)
CANNCT 102 24.374 25
50
10.527 29.9 0.598 39.3 0.760
50 9.066 30.5 0.610 49.5 0.616
100 7.537 31.1 0.622 68.6 0.453
Myogenin CASCTG 122 59.992 25
50
22.177 18.9 0.378 28.7 0.658
50 21.201 20.8 0.416 27.7 0.750
100 9.018 17.7 0.354 31.2 0.567
E2F4 TTTSSCGC 82 27.193 25
50
16.61 2.9 0.058 3 0.975
50 17.43 3.2 0.064 3.6 0.910
100 10.8 2.9 0.058 3.7 0.815
NF-Y CCAAT 48 8.626
18 36
4.502 7.3 0.202 8.9 0.828
36 3.331 7.4 0.205 10.5 0.724
72 4.963 7.3 0.202 15.4 0.498
ERα GGTCA 60 7.892
25 50
6.846 9.5 0.190 13.3 0.72
50 4.829 9.9 0.198 1 .5 0.646
100 4.407 9.4 0.188 20.5 0.474
Brief of source target set is shown in “Original targets”. The brief of testing set is described in “Testing targets”. #noise is the number of non-targets mixed in testing set. #target is number of true target mixed in testing set. x2 is average of testing score of 10 mixed sets.
#TP is average number of true targets mixed in testing set. % of sensitivity is #TP / #target.
#positive is average number of genes detected with the binding site both conserved in human and mouse. % of accurracy is #TP / #positive. x2>3.84 is significant.
The analysis of gene expression is able to identify many possible transcription factor regulated gene groups. It has been proven that the phylogenetic footprinting method can help to identify transcription factor binding sites. Our work develops an expert system that combines
Verification
A comprehensive microarray analysis of hepatocellular carcinoma (HCC) revealed distinct synexpression patterns during intrahepatic metastasis [49]. Our collaborator compared the expression profiles of six HCCs undergoing intraheptic metastasis and four primary HCCs. To explore the genes contributing to intrahepatic metastasis, a global transcriptome analysis was conducted using microarray with RNA samples from four primary HCC (T1), six intra-hepatic metastatic HCC (T3) and two normal liver samples (HNL). We focused on a set of 600 genes that were highly expressed in T3 tissues. This gene group was noted as T3>T1. Fourteen genes with 6 fold higher expression in the T3 tissues were identified and these are transcription factors (FOXQ1, CDCA7L, MYBL2 and SOX4); thus, these genes are candidate genes for direct involvement in tumor metastasis. SOX4 is known as an oncogene in bladder carcinoma [50], adenoid cystic carcinoma [51] and prostate cancer [52]. This suggests that the SOX4 related with molecular activity during caracinogenesis. Among the identified highly up-regulated genes in intra-hepatic liver tumors, SOX4 was an attractive candidate for further investigation. We create an analysis case of SOX4 footprinting using our transcription factor identification system “Mootprinting” with SOX4 binding site motif, WWCAAWG [53] and we test genes in group of T3>T1. As shown in Table , the hypothesis is reject that SOX4 is transcription factor of most genes of T3>T1 in HCC.
In comparison of the other published tissue specific targets groups of SOX4, 2 accurate targets set identified by ChIP assay are both passed the testing and co-expressed gene sets in prostate cancer collected by gene expression profiles as same as T3<T1 are both failed in the test. In further survey of various target groups, highly expressed genes in prostate cancer with SOX4 binding motifs trend to be located in human-mouse conserved region. This survey suggest that whole T3<T1 genes is too noisy for SOX4 targets. In other words, it is may be only a few real SOX4 targets in T3<T1 genes.
To substantiate the significance of SOX4 overexpression,further validation using a larger set of HCC samples was performed [49]. The expression of SOX4 in T3 tumors was significantly higher than adjacent normal tissues and T1 tumors. No statistically significant difference was found between T3 tumors and T2 tumors suggesting that elevated expression of SOX4 correlates with tumor progression (Figure ).
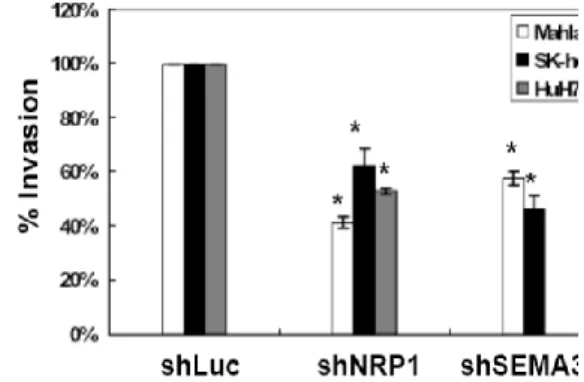
For confirm that SOX4 is key transcription factor in HCC [49], we test the response in suppression of SOX4 expression of HCC cells in vitro. The effect of shSOX4 on in vitro migration/invasion was examined and a 30% to 65% reduction in both migration and invasion activity was found in SOX4-knocked-down cells as shown in Figure (a),(b). Mahlavu showed the greatest response to the SOX4 RNA interference. We also test the effect of SOX4 knockdown in situ. Knockdown of SOX4 significantly reduced Mahlavu tumor growth as shown in Figure (c).
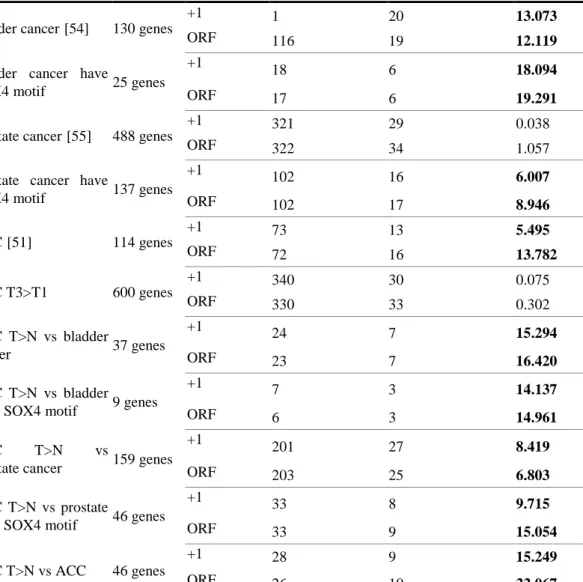
Table 7. χ2 test of SOX4 binding target on published papers and our putative target set
Cases # Input Type * # binding # conservation x2
bladder cancer[54] 130 genes
+1 1 20 13.073
ORF 116 19 12.119
bladder cancer have
SOX4 motif 25 genes
+1 18 6 18.094
ORF 17 6 19.291
prostate cancer[55] 488 genes
+1 321 29 0.038
ORF 322 34 1.057
prostate cancer have
SOX4 motif 137 genes
+1 102 16 6.007
ORF 102 17 8.946
ACC[51] 114 genes
+1 73 13 5.495
ORF 72 16 13.782
HCC T3>T1 600 genes
+1 340 30 0.075
ORF 330 33 0.302
HCC T>N vs bladder
cancer 37 genes
+1 24 7 15.294
ORF 23 7 16.420
HCC T>N vs bladder have SOX4 motif 9 genes
+1 7 3 14.137
ORF 6 3 14.961
HCC T>N vs
prostate cancer 159 genes
+1 201 27 8.419
ORF 203 25 6.803
HCC T>N vs prostate
have SOX4 motif 46 genes
+1 33 8 9.715
ORF 33 9 15.054
HCC T>N vs ACC 46 genes
+1 28 9 15.249
ORF 26 10 22.067
Cases: To describe gene group source of this case. #Input: Number of genes used in this case. Type: To describe base of transcription start site used in this case to extract upstream sequence. #binding: Number of SOX4 binding site in human promoters. #conservation:
Number of Human-Mouse conserved SOX4 binding sites. x2: Score of x2 test. Significant results show in bold font.
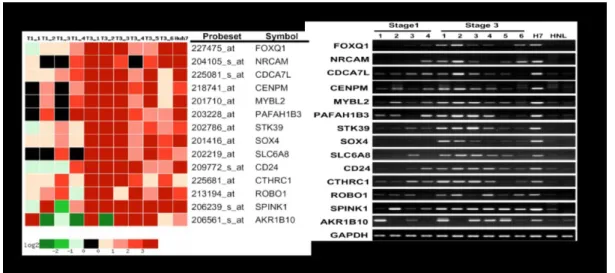
Figure 6. Microarray and RT-PCR analysis of SOX4
Microarray analysis identified SOX4 as upregulated in intra-hepatic metastastic liver tumors.
Candidate genes associated with intra-hepatic metastases. Fourteen candidate genes with 6 fold higher expression in T3 tissues were identified in the microarray analysis and their expression levels were verified by RT-PCR [49].
Figure 7. SOX4 knock-down result
(a)Migration and (b)invasion rate of Mahlavu cell in knock-down of SOX4 and (c)effects of SOX4 knockdown in subcutaneous tumors of shLuc infected Mahlavu cells [49].
A transcription factor exerts its actions via regulation of downstream target genes. To fully understand the roles of SOX4 in HCC progression, a comprehensive knowledge of its targets is needed. Our assumption was that the genes regulated by SOX4 are likely to be present in the SOX4 (a) (b)
(c)
synexpression group, namely, the T3>T1 gene group. The binding motifs of the evolutionarily conserved transcription factors tend to reside in human-mouse conserved non-coding blocks (CNBs) within the promoter regions of the putative target genes [41, 56] To unravel the SOX4 targets, we use our Mootprinting system based on phylogenetic footprinting to identify SOX4 binding motifs in the T3>T1 gene group. A degenerate consensus motif, WWCAAWG ((A/T)(A/T)CAA(A/T)G), which accommodates the known SOX4 binding motifs, AACAA(A/T)G was used.
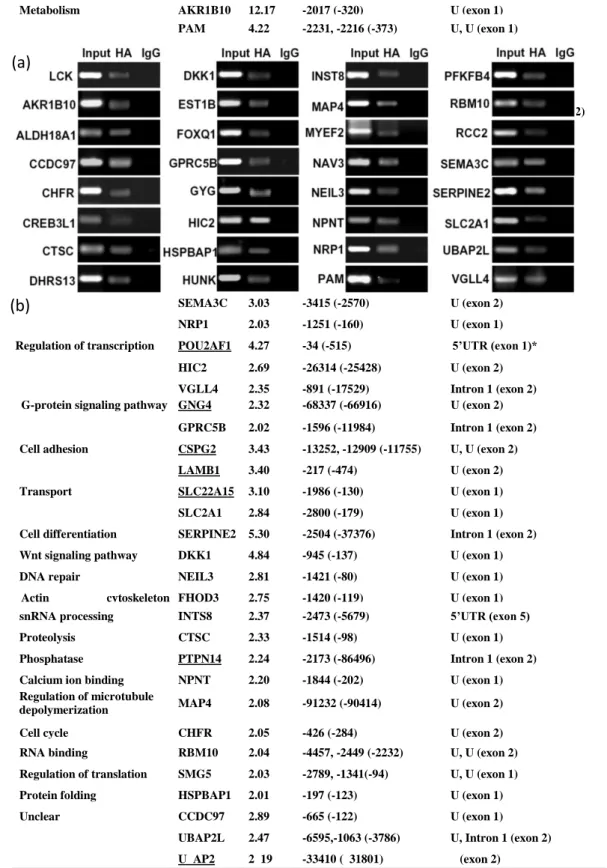
A group of 41 genes containing at least one binding motif in their CNBs was retrieved from the T3>T1 gene group(Table ). Forty-seven binding motifs in the CNBs were identified. The motifs demonstrated a broad distribution of spatial locations. Sixteen motifs were located >1 Kb upstream from the TSS, six sites were in intron 1 and three sites were in the 5’UTR regions. ChIP assays were performed to discover if these motifs are functional binding sites for SOX4 as show in Table .
ChIP is a powerful technique for analyzing transcription factor binding sites in living cells.
We performed ChIP assays with Mahlavu cells to detect sites binding the SOX4 fusion protein. As shown in Figure (a), SOX4 protein formed complexes with the predicted motifs of 31 genes but failed to bind to the predicted motifs of 10 genes. These results indicated a 76% positive prediction rate. The specificity of the ChIP assay was further confirmed using HCC cells transfected with an unrelated HA-FOXQ1 gene construct. To clarify the SOX4 transcriptional Table 8. Number of targets predicted by Mootprinting
Mus musculus Motifs in CNBs
Motifs not in
CNBs No motif
Homo sapiens
Motifs in CNBs 341(130, 233) 16(16,12) 10,8 (9) Motifs not in CNBs 34(32,14) 188(189,196) 55(63,67)
No motif 6(9,4) 71(85,90) 37(23,33)
1: Targets predicted of condition of “TSS” (3000 bp from the transcription start site). 2: Targets predicted of “ATG” (3000 bp from the translation start site). 3: number of total non-overlapping genes.
Table 9. Putative SOX4 regulation targets
Gene function Gene
Symbol
a T3/T1 ratio
c Positions of binding motif from ATG (dTSS)
e Locations of motifs relative to location of ATG
Metabolism AKR1B10 12.17 -2017 (-320) U (exon 1)
PAM 4.22 -2231, -2216 (-373) U, U (exon 1)
GYG 2.94 -2282 (-89) U (exon 1)
RCC2 2.92 -2782 (-1210) U (exon 2)
DHRS13 2.69 -2837 (-393) U (exon 2)
ALDH18A1 2.35 -2149, -1362 (-3248) Intron 1, Intron 1 (exon 2)
Kinase HUNK 3.56 -1517 (-360) U (exon 1)
PFKFB4 2.20 -1370 (-17) U (exon 1)
CKMT1 2.18 -954 (-163) U (exon 1)
Transcription factor FOXQ1 9.22 -1897 (-265) U (exon 1) TEAD2 3.65 -2369 (-2382) 5’UTR (exon 2) CREB3L1 2.31 -2556 (-103) U (exon 1)
MYEF2 2.01 -2565 (-56) U (exon 1)
Axon guidance NAV3 3.39 -918 (-45) U (exon 1)
SEMA3C 3.03 -3415 (-2570) U (exon 2)
NRP1 2.03 -1251 (-160) U (exon 1)
Regulation of transcription POU2AF1 4.27 -34 (-515) 5’UTR (exon 1)*
HIC2 2.69 -26314 (-25428) U (exon 2) VGLL4 2.35 -891 (-17529) Intron 1 (exon 2) G-protein signaling pathway GNG4 2.32 -68337 (-66916) U (exon 2)
GPRC5B 2.02 -1596 (-11984) Intron 1 (exon 2) Cell adhesion CSPG2 3.43 -13252, -12909 (-11755) U, U (exon 2)
LAMB1 3.40 -217 (-474) U (exon 2)
Transport SLC22A15 3.10 -1986 (-130) U (exon 1)
SLC2A1 2.84 -2800 (-179) U (exon 1) Cell differentiation SERPINE2 5.30 -2504 (-37376) Intron 1 (exon 2)
Wnt signaling pathway DKK1 4.84 -945 (-137) U (exon 1)
DNA repair NEIL3 2.81 -1421 (-80) U (exon 1)
Actin cytoskeleton organization
FHOD3 2.75 -1420 (-119) U (exon 1)
snRNA processing INTS8 2.37 -2473 (-5679) 5’UTR (exon 5)
Proteolysis CTSC 2.33 -1514 (-98) U (exon 1)
Phosphatase PTPN14 2.24 -2173 (-86496) Intron 1 (exon 2)
Calcium ion binding NPNT 2.20 -1844 (-202) U (exon 1)
Regulation of microtubule
depolymerization MAP4 2.08 -91232 (-90414) U (exon 2)
Cell cycle CHFR 2.05 -426 (-284) U (exon 2)
RNA binding RBM10 2.04 -4457, -2449 (-2232) U, U (exon 2) Regulation of translation SMG5 2.03 -2789, -1341(-94) U, U (exon 1)
Protein folding HSPBAP1 2.01 -197 (-123) U (exon 1)
Unclear CCDC97 2.89 -665 (-122) U (exon 1)
UBAP2L 2.47 -6595,-1063 (-3786) U, Intron 1 (exon 2) U AP2 2 19 -33410 ( 31801) (exon 2)
a: T3/T1 ratio: Relative gene expression levels between T3 and T1 patient groups revealed by the microarray experiments. b: Predicted SOX4 binding motifs identified in the conserved non-coding blocks. c: Positions of the motifs from the translation start site (ATG), in bp. d: Position of TSS from the translation start site in bp.
e: location of motifs (U: Upstream from TSS; intron or 5’UTR) and location of translation start site in the gene (exon no.). Underlined: Genes are failed to show SOX4 binding by ChIP analysis.
(a)
(b)
We use Mootprinting system as a regulation targets identification tool based on phylogenetic footprinting. 41 putative targets was identified form 616 genes of T3>T1 highly expressed genes.
A multifaceted approach integrating gene profiling, binding site computation and empirical verification by chromatin immunoprecipitation and gene ablation refined the consensus SOX4 binding motif and identified 32 binding loci in 31 genes with high confidence. RNAi-knockdown reduced cell migration activity in HCC cell lines suggesting that SOX4 exerts some of its action via regulation of these two downstream targets. The discovery of 31 previously unidentified targets expands our knowledge of how SOX4 modulates HCC progression and implies a range of novel SOX4 functions. Over 75% putative targets were confirmed by biological experiments. It shows that our approach is efficient and accurate in identification of regulation targets.
Figure 8. Verification of SOX4 targets
(a) Verification of targets by ChIP assay and (b) expression suppression effect (b) [49].
結論
In the study of transcription factor identification, the motif CACGTG and the Myc-target genes were analyzed using the Mootprinting approach described here and the results show the system can help biologists to identify candidates for the transcription factor related genes. The system provides users with a different view to their gene group of interest. Although the results for this analysis are quite good, there are several problems to overcome. The first problem is that possible transcription factor binding site motifs are difficult to find; however, there are currently several transcription factor databases like TRANSFAC [40] and JASPAR [57]. The transcription factor binding sites provided by TRANSFAC or JASPAR databases are in matrices. Matrices can convert to matrix position weight matrix (PWM) format. The PWM format is more flexible than a motif. A PWM can be used to find more transcription factor binding sites than a motif format, but using the PWM format in our system is difficult. This is because we use a suffix array to speed up the searching time. If we directly changed the motif to PWM, the time for searching the putative transcription factor binding sites will be too long. Converting PWM format to motif format loses some possible binding site information. This leaves the question of how to achieve a better balance between the PWM format and the motif format in the future. An integration of the PWM into our system would be very useful and would significantly reduce the binding sites lost by using the simpler approach to motif description.
In terms of selecting a motif, we suggest that the motif length needs to be between 5 bps and 12 bps. If the motif length is below 5 bps, there are too many motif locations present in the upstream sequences. If motif length is over 12 bps, there are too few motif locations in the upstream sequences. Our system currently provides data for humans and mice. In the future, we hope to expand the range of available species. If we are able to overcome the problem with the PWM conversion, then the transcription factor databases like TRANSFAC or JASPAR could be directly integrated into our system. Users can then choose a confirmed transcription factor motif and test the gene group statistics. In the future, we hope to integrate pathway information databases like GO [58] and KEGG [59] into our system because when submitted genes are classified by pathway, the system will be able to provide more information on the gene clusters directly to user.
參考文獻
1. Tagle DA, Koop BF, Goodman M, Slightom JL, Hess DL, Jones RT: Embryonic epsilon and gamma globin genes of a prosimian primate (Galago crassicaudatus). Nucleotide and amino acid sequences, developmental regulation and phylogenetic footprints. Journal of molecular biology 1988, 203:439-455.
2. Bulyk ML: Computational prediction of transcription-factor binding site locations. Genome biology 2003, 5:201.
3. Cooper GM, Sidow A: Genomic regulatory regions: insights from comparative sequence analysis. Current opinion in genetics & development 2003, 13:604-610.
4. Frazer KA, Elnitski L, Church DM, Dubchak I, Hardison RC: Cross-species sequence comparisons: a review of methods and available resources. Genome research 2003, 13:1-12.
5. Bergman CM, Kreitman M: Analysis of conserved noncoding DNA in Drosophila reveals similar constraints in intergenic and intronic sequences. Genome research 2001, 11:1335-1345.
6. Boffelli D, McAuliffe J, Ovcharenko D, Lewis KD, Ovcharenko I, Pachter L, Rubin EM:
Phylogenetic shadowing of primate sequences to find functional regions of the human genome.
Science 2003, 299:1391-1394.
7. Loots GG, Locksley RM, Blankespoor CM, Wang ZE, Miller W, Rubin EM, Frazer KA:
Identification of a coordinate regulator of interleukins 4, 13, and 5 by cross-species sequence comparisons. Science 2000, 288:136-140.
8. Cliften P, Sudarsanam P, Desikan A, Fulton L, Fulton B, Majors J, Waterston R, Cohen BA, Johnston M: Finding functional features in Saccharomyces genomes by phylogenetic footprinting. Science 2003, 301:71-76.
9. Kellis M, Patterson N, Endrizzi M, Birren B, Lander ES: Sequencing and comparison of yeast species to identify genes and regulatory elements. Nature 2003, 423:241-254.
10. Doniger SW, Huh J, Fay JC: Identification of functional transcription factor binding sites using closely related Saccharomyces species. Genome research 2005, 15:701-709.
11. Loots GG, Ovcharenko I, Pachter L, Dubchak I, Rubin EM: rVista for comparative sequence-based discovery of functional transcription factor binding sites. Genome research 2002, 12:832-839.
12. Lenhard B, Sandelin A, Mendoza L, Engstrom P, Jareborg N, Wasserman WW: Identification of