Determinants of computed tomography and magnetic
resonance imaging utilization in Taiwan
Pei-Tseng Kung
Taichung Healthcare and Management University
Wen-Chen Tsai
China Medical University
Chih-Liang Yaung
Taichung Healthcare and Management University
Kai-Ping Liao
China Medical University
Objectives: Magnetic resonance imaging (MRI) and computerized tomography (CT) scanners are high-tech equipment with the highest utilizations and expenditures in Taiwan. This study investigates the factors that affect MRI and CT utilization, such as whether supply-side factors have more impact than demand-side factors, and the effect of utilization control policies.
Methods: This study used the nationwide CT and MRI claim data for the years 1998 to 2001 from the Bureau of National Health Insurance (BNHI) in Taiwan. Multiple regression analysis was the statistical method used to determine the relative factors that influence CT and MRI utilization.
Results: CT : population ratio, hospital-based physician : population ratio, female ratio, pediatric (≤14 years) : population ratio, and family income significantly influenced CT utilization. MRI : population ratio and hospital-based physician : population ratio, female ratio, and family income significantly influenced MRI utilization. However, the proportion of the aged (≥65 years of age) did not significantly influence CT or MRI utilization after controlling for other factors. The rates of CT and MRI utilization for the outpatient and inpatient settings and the repeated uses of CT or MRI have decreased significantly after a utilization review was implemented by BNHI, which suggests that CT and MRI have been overused.
Conclusions: Increases in supply-side factors significantly increase CT/MRI utilization, and supply-side factors impact CT/MRI utilization more than demand-side factors. The results show that the utilization instant report policy effectively decreases repeated uses of CT/MRI.
Keywords: Computerized tomography, Magnetic resonance imaging, High-tech medical utilization, CT, MRI
The escalation of health-care expenditures has caused many countries to address this problem. Previous studies have in-
We are grateful for the financial support of the Department of Health of Taiwan for this research grant (DOH91-HS-1001) and also deeply appreciate the use of National Health Insurance medical claim data for our analyses.
dicated that population, population structure, medical-care price, medical utilization rate, and high-tech medical uti- lization influence the growth of health-care expenses (6).
Of these influencing factors, high-tech utilization is one of the most important factors affecting health-care spending
(10;17;20;22). Taiwan implemented National Health Insur- ance (NHI) in 1995, a universal and comprehensive health insurance with a low copayment for outpatient and inpatient services. Taiwan’s health system is a closed system, which means all hospital-based physicians are staff physicians.
Currently, Taiwan’s health delivery system does not have a mandated physician referral system and offers extremely free choices of physicians or health-care organizations. This means patients can directly visit hospital-based physicians for primary care without a physician referral. Since 1995, the implementation of NHI has resulted in a large increase in health-care utilization. For example, in 2001 Taiwanese had, on average, fifteen outpatient services visits per capita as compared with eleven outpatient services visits in 1995 (26).
Because Taiwan’s NHI covers computerized tomogra- phy scanning (CT) and magnetic resonance imaging (MRI), Taiwan has experienced rapid growth of health-care spend- ing for high-tech medical devices. According to the Annual Statistical Report of the Bureau of National Health Insurance (BNHI), medical claims for CT and MRI utilization increased 14.18 percent compared with the previous year and spend- ing increased 17.71 percent in 1999, which was higher than NHI’s annual growth rate of 8.45 percent (5).
Taiwan began importing CTs in 1978 and MRIs in 1988, and currently the ratios of population to the number of CTs or MRIs are similar to those of other developed countries. Ac- cording to Health and Vital Statistics of Department of Health (DOH), the cumulative number of CTs reached 435 units from 1992 to 2001 and the average annual growth rate was 10.6 percent. There are ninety-four MRI units, with an aver- age annual growth rate of 16.9 percent for the same period, which represents a doubling of the number in 4 years (26).
In a highly competitive health-care market, hospitals have more incentives to purchase expensive high-tech equipment to increase their competitive advantages, because hospitals with high-tech equipment can provide higher quality images (28). When the health-care market is more competitive, hos- pitals will face a more intense “arms race.” In addition, be- cause health-care providers attempt to quickly pay back their high-tech equipment investments and reduce the probabil- ity of medical malpractice, they may have supplier-induced demand situations that increase utilization of expensive high- tech devices.
The factors that influence an area’s health-care expenses include health-care supply factors and health-care demand factors. Health-care supply-side factors include physicians, hospital beds, medical equipment, and medical technology;
demand-side factors include population, age distribution of population, sex ratio, family income, and so on. In general, older people consume more health-care resources, and the relation curve between age and health-care spending is a “U”
curve (19;29). Females have higher health expenses on av- erage than males (19;29). Previous studies have shown that income elasticity of demand for medical care was between 1 and 0, meaning that medical care is referred to as the
normal goods, because any increase in real income leads to an increase in medical-care demanded (16;18). In addition, consumers are sensitive to the price of medical care, but they are likely to become less sensitive to price changes due to lower out-of-pocket payments (16). When the out-of-pocket price is zero, the income elasticity of demand for medical care is close to zero (9). Taiwan’s NHI completely reim- burses, without any out-of-pocket payment, for the utilization of CT and MRI. Consequently, patients are not concerned about the price of CT and MRI. Whether demand factors im- pact the utilization of CT and MRI, that is, expensive services that only hospital-based physicians can request, and whether these demands are similar to the demand for general medical care, requires our study.
Regarding the health-care supply, increases in health- care resources will increase health-care utilization. When the number of physicians increases, significantly more health- care resources are used (3;27). Conversely, a logical question is, Will the growth of hospital-based physicians increase the utilization of CT and MRI? Since 1996, Taiwan NHI has not changed its reimbursement and the level of insurance coverage for CT and MRI procedures. The reimbursements or the level of insurance coverage would influence the escalation of high-tech medical utilization (14;21).
CT and MRI have the highest utilization among all high- tech medical devices in Taiwan, and their use has been con- tinuously growing. In this study, we explore the rates of CT and MRI utilization in inpatient and outpatient services and the relative factors that influenced the growth of CT or MRI utilization after 1995, when Taiwan implemented the NHI.
To control CT and MRI utilizations, Taiwan BNHI applied the principle of managed care and a gatekeeper system to instantly review hospitals’ CT and MRI utilizations after 1999, by requesting hospital-based physicians to report their CT and MRI utilizations to BNHI within 24 hours. How would an instant report policy affect CT and MRI utiliza- tions? Namely, we address the following aspects : whether health-care supply-side factors impact utilization more than health-care demand-side factors; the degree of repeated use of CT or MRI procedures; the effect of policy management on reducing utilization after Taiwan’s BNHI executed the instant report policy.
MATERIALS AND METHODS Population Studied
This study used Taiwan’s NHI nationwide medical claim data, which comprised the medical-care services for 97 per- cent of Taiwan’s population (approximately 23 million peo- ple), for the years 1998 to 2001, to determine CT and MRI utilizations. We also used health-care regions (HCRs) as the observation unit for further analyses. The HCRs are the living areas mapped out by the DOH in which the health-care needs of residents can be conveniently met. This national health- care net encompasses all twenty-one cities and counties and
consists of seventeen HCRs, with each HCR containing one or two cities or counties in Taiwan, much like the metropoli- tan statistical area (MSA) in the United States.
Data Sources
We used secondary data for this study. The utilizations and expenditures of CT and MRI were from the NHI medical claim dataset from 1998 to 2001. The number of CTs and MRIs was derived from the survey data published by the DOH. Because only hospital-based physicians place orders for these procedures, we used NHI-contracted hospital-based physicians rather than all practicing physicians to accurately reflect the number of medical-care providers. The NHI- contracted hospital-based physicians were obtained from NHI physician profiles published by National Health Re- search Institute (NHRI). The number of hospital beds was obtained from Health and Vital Statistics, published by the DOH.
The data related to other relative variables, such as aged (≥65 years) population, pediatric (≤14 years) population, and gender, were obtained from the Taiwan Demographic Fact Book, published by the Ministry of the Interior. Average family income values were obtained from the Taiwan Family Annual Incomes and Expenditures Report, published by the Department of Auditing.
Statistical Methods
This study applied descriptive statistics and a multiple re- gression analysis to analyze the utilization of CT and MRI for the period of 1998 to 2001 in Taiwan. The HCR was the observation unit. Because three HCRs did not have any MRIs before 2001, we omitted these HCRs from the analysis for MRI utilization.
Descriptive statistics were used to describe the trend of CT and MRI utilization and the average growth rates. Be- cause the multiple regression analysis could examine the strength of the relationship between a continuous dependent variable and several independent variables, we used a multi- ple regression analysis to examine the factors that were asso- ciated with CT and MRI utilization. The dependent variable is the average uses of CT or MRI per 1,000 people per year
and the independent variables consist of an area’s health- care resources (e.g., hospital-based physicians per 10,000 people, hospital beds per 10,000 people, units of CT or MRI per million people), demographic indicators (e.g., ratio of gender, percentage of the aged or pediatric population), and economic factors (e.g., average family income).
To examine the relationship between any two variables, we first used Pearson’s correlation Coefficient to analyze the variables and also examined the normal distribution of variables. Second, to reduce the collinearity relationship among independent variables, we tested the presence of mul- ticollinearity and used the variance inflation factor (VIF) to measure collinearity in the multiple regression analysis. Fi- nally, to meet the regression assumptions, the residual analy- sis was used to examine the fitness of the regression models.
Thus, we tried to transform the variables to gain the best fit of the regression model.
In the regression model, because the number of hospi- tal beds and the number of hospital-based physicians had a higher multicollinearity relationship (VIF > 10), we only kept the variable of hospital-based physicians in the final re- gression model to reduce bias due to multicollinearity. All variables in the final multiple regression models have lower values (<10) of VIF. Furthermore, because of the variation of population of HCRs, we applied the least square regression method with a weight of an HCR’s population to reduce the variation of an HCR’s population.
RESULTS
Descriptive Analysis
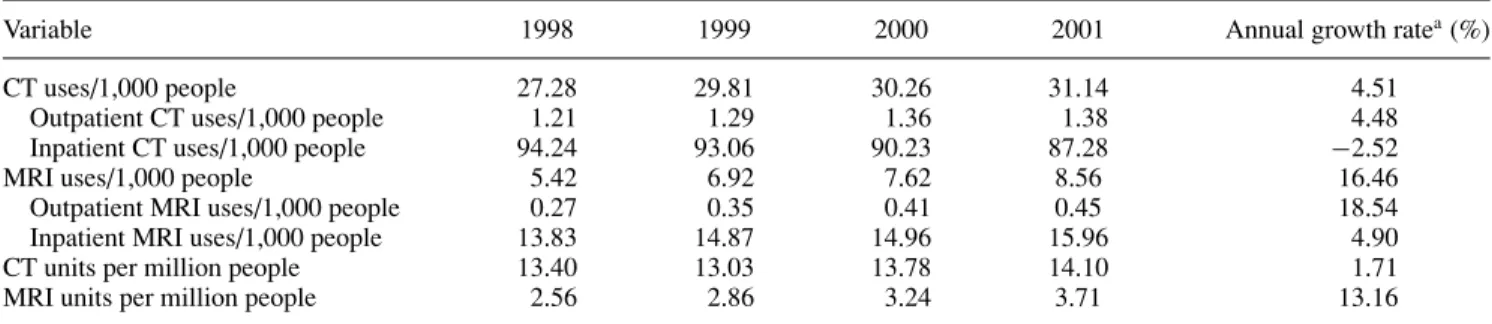
In 1998, Taiwan reported an average 27.28 uses of CT/1,000 persons compared with 31.14/1,000 persons in 2001, an aver- age annual growth rate of 4.51 percent (Table 1). MRI had an average utilization of 5.42/1,000 persons in 1998 compared with 8.56/1,000 persons in 2001, an annual growth rate of 16.46 percent during these 4 years.
When the rates of CT and MRI utilization at outpatient and inpatient services were analyzed separately, we found average use in 2001 was 1.38 CTs/1,000 patients in outpa- tient services versus an average 87.28 CTs/1,000 patients
Table 1. Annual Rate of CT or MRI Utilization for Outpatient and Inpatient, 1998–2001
Variable 1998 1999 2000 2001 Annual growth ratea(%)
CT uses/1,000 people 27.28 29.81 30.26 31.14 4.51
Outpatient CT uses/1,000 people 1.21 1.29 1.36 1.38 4.48
Inpatient CT uses/1,000 people 94.24 93.06 90.23 87.28 −2.52
MRI uses/1,000 people 5.42 6.92 7.62 8.56 16.46
Outpatient MRI uses/1,000 people 0.27 0.35 0.41 0.45 18.54
Inpatient MRI uses/1,000 people 13.83 14.87 14.96 15.96 4.90
CT units per million people 13.40 13.03 13.78 14.10 1.71
MRI units per million people 2.56 2.86 3.24 3.71 13.16
aAnnual growth rate= [(2001-year data/1998-year data)1/3]− 1.
CT, computed tomography; MRI, magnetic resonance imaging.
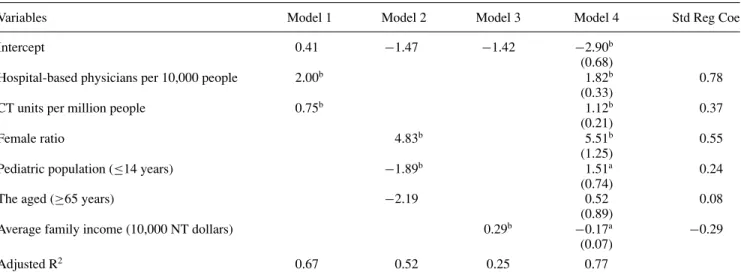
Table 2. Results of Multiple Regression Analysis for CT Utilization, 1998–2001
Variables Model 1 Model 2 Model 3 Model 4 Std Reg Coe
Intercept 0.41 −1.47 −1.42 −2.90b
(0.68)
Hospital-based physicians per 10,000 people 2.00b 1.82b 0.78
(0.33)
CT units per million people 0.75b 1.12b 0.37
(0.21)
Female ratio 4.83b 5.51b 0.55
(1.25)
Pediatric population (≤14 years) −1.89b 1.51a 0.24
(0.74)
The aged (≥65 years) −2.19 0.52 0.08
(0.89)
Average family income (10,000 NT dollars) 0.29b −0.17a −0.29
(0.07)
Adjusted R2 0.67 0.52 0.25 0.77
Average uses of computed tomography (CT) per 1,000 people as the dependent variable in the multiple regression models. Values in parentheses are standard errors.
ap <0.05;bp <0.01.
Std Reg Coe, standardized regression coefficients.
in inpatient services (Table 1). From 1998 to 2001, hospi- tals reported a small increase (4.48 percent) in the rate of outpatient CT use and a decline (−2.52 percent) in the average annual growth rate of CT uses in inpatient set- tings. In 2001, Taiwanese hospitals’ outpatient services re- ported an average 0.45 MRIs/1,000 patients, for an annual growth rate of 18.54 percent from 1998 to 2001; inpatient services reported an average 15.96 MRIs/1,000 in 2001 and a 4.90 percent growth rate during these 4 years. Until 2001, Taiwan’s hospitals had a slow rate of growth in CT utilization, but the rate of MRI use continued to further escalate.
As for spending for CT or MRI services, Taiwan had an annual growth rate 3.71 percent for the CT scan per capita and 16.48 percent for the MRI scan per capita from 1998 to 2001. Compared with MRI, the rate of CT utilization and its average spending were higher than those for MRI. In 2001, the average number of CT scans/1,000 people was 3.6 times higher than that of MRI. However, the annual rate of growth for MRI was 4.24 times higher than that of CT from 1998 to 2001.
As for the density of health-care high-tech devices, there were an average of 14.10 CT units per 1 million persons in 2001 versus 13.40 in 1998 (Table 1). The number of MRI units increased from 2.56 units to 3.71 units per 1 million persons between 1998 and 2001. The annual growth rate of the ratio of CT and MRI to population was 1.71 percent and 13.6 percent, respectively. The increase in the MRI : population ratio was 7.7 times higher than that of CT, possibly because the number of CT units was near market saturation, whereas the more expensive MRI might not have reached market saturation.
Results of Multiple Regression Analysis for CT/MRI Utilization
To investigate the major factors affecting the utilization of CT and MRI, we used the average uses of CT or MRI per 1,000 people as the dependent variable in the multiple regression models. The independent variables in the regression models (model 4) could explain 77 percent and 90 percent (adjusted R2) of CT and MRI total utilization variability, respectively (Tables 2 and 3). Among the independent variables (Tables 2 and 3), health-care resources (i.e., hospital-based physicians per 10,000 people and the number of CT/MRI units per 1 million population) could largely predict the variability of CT/MRI utilization (adjusted R2is 0.67 for CT and 0.78 for MRI in model 1). The demand factors–population demo- graphic variables (adjusted R2 is 0.52 for CT and 0.61 for MRI in model 2) and the income factor (model 3) have the least power to predict CT or MRI utilization variability.
After controlling for other variables (model 4 in Table 2), the factors that significantly influenced CT utilization in- cluded the number of hospital-based physicians per 10,000 population, CT units per 1 million population, percentage of female patients, percentage of pediatric patients, and aver- age family income, but the percentage of aged patients did not significantly influence the CT utilization (Table 2). Ex- cept for average family income, other relative factors have a positive correlation with CT utilization. When other factors are fixed, increasing 1 unit of CT per 1 million population would increase average CT uses to 1.12 per 1,000 people. In- creasing 1 hospital-based physician per 10,000 people would cause an increase of 1.82 CT uses per 1,000 people. When the population’s female makeup increased by 1 percent, CT utilization increased an averaged 5.51 uses per 1,000 people.
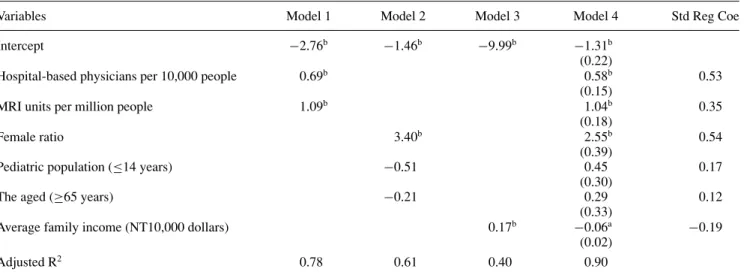
Table 3. Results of Multiple Regression Analysis for MRI Utilization, 1998–2001
Variables Model 1 Model 2 Model 3 Model 4 Std Reg Coe
Intercept −2.76b −1.46b −9.99b −1.31b
(0.22)
Hospital-based physicians per 10,000 people 0.69b 0.58b 0.53
(0.15)
MRI units per million people 1.09b 1.04b 0.35
(0.18)
Female ratio 3.40b 2.55b 0.54
(0.39)
Pediatric population (≤14 years) −0.51 0.45 0.17
(0.30)
The aged (≥65 years) −0.21 0.29 0.12
(0.33)
Average family income (NT10,000 dollars) 0.17b −0.06a −0.19
(0.02)
Adjusted R2 0.78 0.61 0.40 0.90
Average uses of magnetic resonance imaging (MRI) per 1,000 people as the dependent variable in the multiple regression models. Values in parentheses are standard errors.
ap <0.05;bp <0.01.
Std Reg Coe, standardized regression coefficients.
An increase of 1 percent in the number of pediatric patients would result in an increase of 1.51 CT uses per 1,000 people, whereas an increase of 10,000 New Taiwan (NT) dollars in average family income would result in a decrease 0.17 CT uses per 1000 people after controlling for other factors.
As for the factors influencing MRI utilization, all other factors significantly influenced MRI utilization, except for the percentage of pediatric population and of the aged. All significantly relative factors had a positive relationship with MRI uses, except for average family income. After control- ling for other variables, adding 1 MRI unit per 1 million population would result in an average increase of 1.04 MRI uses per 1,000 people; an increase of one hospital-based physician would result in an increase of 0.58 MRI uses per 1,000 people; an increase of 1 percent in the ratio of female patients would increase MRI uses an average of 2.55 per 1,000 people. However, an increase of 10,000 NT dollars in average family income would significantly decrease MRI uses by 0.06 per 1000 people.
Based on the standardized regression coefficients (Tables 2 and 3), we found that CT utilization was most impacted by the ratio of hospital-based physicians to popula- tion. However, the proportion of females had a slightly higher influence on MRI utilization than the ratio of hospital-based physicians to population. The age distribution of the popu- lation was less important than the distribution of health-care resources (i.e., hospital-based physicians and the number of CT/MRI units).
Analysis of Repeated Uses of CT or MRI Procedure
Because CT and MRI procedures are diagnostic services, we investigated the extent of their short-term repeated uses in
hospitals at outpatient and inpatient sectors during the pe- riod of 1998 to 2001, with 1 week, 2 weeks, and 1 month as the observation period for outpatient services. When one patient had two CT or MRI procedures in the observation period, this finding was defined as a “repeated use,” although different diseases or reasons may have necessitated the pro- cedures, and the repeated uses might be procured at one hospital’s or two hospitals’ outpatient sectors. Because hos- pitals report 1 medical claim for each stay after patients are discharged and the claim data do not cite the service time for CT or MRI scans, we defined repeated uses of CT or MRI in inpatient services as repeated use within a single hospital admission.
Repeated Uses of CT Procedure
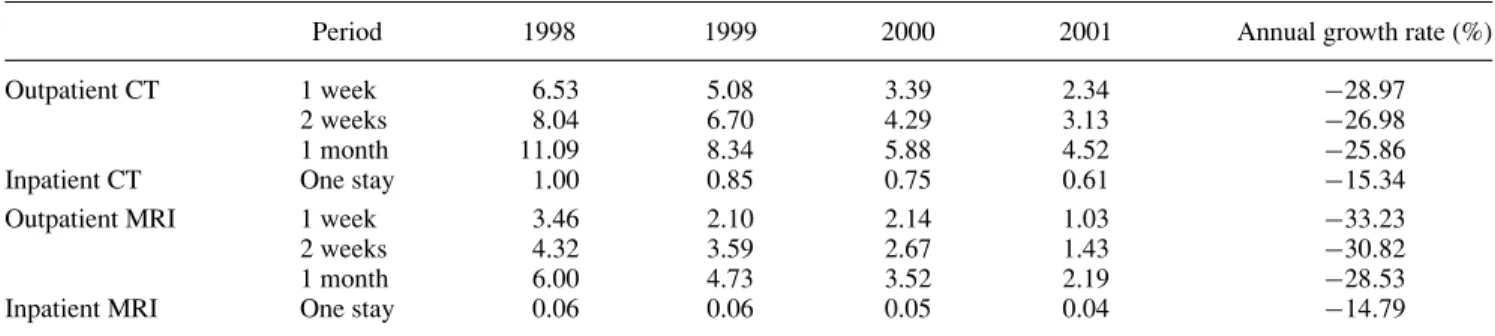
As shown in Table 4, the rate of repeat CT uses in a 1-week period was 6.53 percent in 1998 and decreased to 2.34 percent in 2001 for the outpatient services. When the observation period was 2 weeks, the rate of repeated uses increased to between 3.13 percent and 8.04 percent. When the observation time increased to 1 month, the rate of repeated uses was twice that of the 1-week observation period. Regardless of the observation time, the rate of repeat CT uses at outpatient services decreased approximately 25 percent from 1998 to 2001.
One percent of patients treated in inpatient services had repeat CT uses during a single hospital stay in 1998; this rate decreased to 0.61 percent in 2001. The average annual growth rate of repeat CT uses for inpatients services was
−15.34 percent. Outpatient services had a greater decrease in the rate of repeat CT uses than inpatient services, suggesting BNHI’s utilization instant report policy had a good effect on reducing CT repeated uses, especially among outpatients.
Table 4. Annual Repeated Uses of CT or MRI, 1998–2001
Period 1998 1999 2000 2001 Annual growth rate (%)
Outpatient CT 1 week 6.53 5.08 3.39 2.34 −28.97
2 weeks 8.04 6.70 4.29 3.13 −26.98
1 month 11.09 8.34 5.88 4.52 −25.86
Inpatient CT One stay 1.00 0.85 0.75 0.61 −15.34
Outpatient MRI 1 week 3.46 2.10 2.14 1.03 −33.23
2 weeks 4.32 3.59 2.67 1.43 −30.82
1 month 6.00 4.73 3.52 2.19 −28.53
Inpatient MRI One stay 0.06 0.06 0.05 0.04 −14.79
One stay is the patient’s length of one hospital stay.
CT, computed tomography; MRI, magnetic resonance imaging.
Repeated Uses of MRI Procedure
As for the repeat MRI uses (Table 4), when a 1-week obser- vation was evaluated, the rate of MRI repeated uses was 3.46 percent for outpatient services in 1998, which was reduced to 1.03 percent in 2001. When the observation period was ex- tended to 2 weeks, the rate of repeated uses was 4.32 percent in 1998 and 1.43 percent in 2001. The rate of MRI repeated uses in outpatient services was 6 percent in 1998 and 2.19 percent in 2001, using a 1-month observation period. The reduction in the rate of MRI repeated uses in outpatient ser- vices was approximately 30 percent for these 3 observation periods.
In inpatient services (Table 4), 0.06 percent of patients in 1998 had 2 MRI uses during their hospital stay, but the rate of repeated uses decreased to 0.04 percent in 2001. The average annual growth rate of repeated uses was −14.79 percent for inpatient MRI users. Compared with the inpatient MRI users, the outpatient MRI repeated uses rate declined more from 1998 to 2001. So, BNHI’s utilization instant report policy has effectively reduced repeated uses for both CT and MRI.
DISCUSSION
Roemer (25) indicated that a built bed is a filled bed, which describes the positive relationship between health- care resources and health-care utilization caused by supplier- induced demand due to information asymmetry between providers and patients. This study demonstrated that, after controlling for other factors, increases in the ratios of CT : or MRI : population and the hospital-based physician : pop- ulation significantly increases CT or MRI utilization, which is similar to the relationships between health-care resources and non–high-tech health-care utilization. Because CT has saturated the market in hospitals, the rate of use is stable.
However, because only larger hospitals can purchase the ex- pensive MRI, the modality is relatively less popular than CT, although the utilization rate of MRI in regions with a lower ratio of MRI : population has been growing markedly, which suggests that as the accessibility of high-cost
diagnostic equipment increases, the utilization rate parallels this increase if the service is covered by health insurance.
Before the implementation of NHI, Taiwan did not have one area with more health-care resources and more health- care utilization per capita (7). During the past 30 years in the United States, an increase in physicians has increased health-care expenditures, and the increase in physicians can explain 95 percent of the escalation in health-care spending (3). The main reasons were that both information asymmetry and health-insurance coverage cause more physician-induced demand (20). In Taiwan, patients had NHI comprehensive coverage and did not have any out-of-pocket payments for the utilization of CT and MRI. Our study showed the num- ber of hospital-based physicians strongly correlated with CT and MRI spending if other factors were fixed. According to standardized regression coefficients in the regression model, the rise in hospital-based physicians would have the biggest influence on CT utilization, with similar findings for MRI uti- lization. In addition, the ratio of hospital-based physician : population explains most of the variability of CT or MRI utilization (i.e., adjusted R2is 0.62 for CT and 0.69 for MRI) when the ratio was analyzed alone in the model, meaning the ratio of hospital-based physician : population had the highest predictability for CT or MRI spending.
Previous studies showed both pediatric and aged popula- tions incur more health-care spending (19;29). In this study, we used nationwide and multiple-year data. When we ex- amined simple correlation between the aged and CT/MRI utilization, we found a significant and positive relationship between the aged and CT/MRI utilization, which was sim- ilar to that of other studies (2;4;15). But, after controlling for other relative variables in the multiple regression model, there was no significant relationship between the aged and CT/MRI utilization, and the standardized regression coeffi- cients of the aged was also small, which suggested an aging population would not significantly increase CT or MRI ex- penditures. As for the relationship between children and CT or MRI utilization, an increase in the pediatric population sig- nificantly increased CT utilization but not MRI utilization.
The reason might be that children’s disease patterns require more CT diagnostic workups than MRI workups because of
the modalities’ different functions. Another reason might be cost-effectiveness, because physicians or patients’ families are more willing to spend health-care resources on children’s treatments than on aged patients.’ This finding suggests that Taiwan’s increasing aged population will not significantly increase high-tech CT or MRI utilization.
In general, females on average incur more health-care spending than males. Based on the nationwide data, we also found, after controlling for confounders, similar findings sug- gesting that CT and MRI utilization will escalate significantly as a population becomes more female. We need to note that, according to standardized regression coefficients (0.55 for CT and 0.54 for MRI) in the regression model, changes in female population are an important influencing factor for CT or MRI utilization (Tables 2 and 3), which is consistent with the study result that found that female patients in US hospitals underwent more CT procedures than males (4).
Income had inconsistent effects on health-care utiliza- tion, in our study and others. Grossman (11) indicated that a rise in income would increase patients’ health-care utiliza- tion, but Becker (1) argued that, when individuals have more income, the cost of accessing medical-care services will in- crease if the time spent accessing medical care is factored.
Consequently, individuals will reduce their health-care uti- lization. Taiwan’s NHI covers all CT or MRI procedures, and patients do not have any financial burden for CT or MRI uses.
But, in the regression model, we found increases in average family income decreased the rate of CT or MRI utilization.
Because CT or MRI procedures are not provided by primary- care services, hospital-based physicians are required to place an order for the diagnostic procedures. This finding might suggest that the health status of persons with lower incomes, who present to a hospital versus a primary-care setting, might demand more medical care and, therefore, use more CT or MRI procedures. This warrants further study.
Patients’ clinical status might necessitate repeated uses of CT or MRI over a short period of time, but when we fur- ther examined the correlation between the rate of CT or MRI utilization and the ratio of hospital-based physician : popu- lation, we found that the Pearson correlation coefficient was 0.57 for CT and 0.62 for MRI (p < .05), which means they had positively medium strength correlation. It suggests that more competitive health-care markets would cause higher rates of CT or MRI utilization. In addition, we also exam- ined whether there was any relationship between the rate of repeated uses of CT/MRI and the ratio of hospital-based physician : population. We did not find a significant correla- tion (p > .05) between the rate of repeated uses of CT/MRI and the ratio of hospital-based physician-population, which suggests that the repeated uses homogenously happened at health-care regions and were not influenced by the degree of market competition. After 1999, BNHI implemented “in- stant report policy” for CT and MRI utilization review. Based on the growth of MRI utilization, the policy did not have a significant effect on controlling for MRI uses, but it might
be that some MRI procedures have replaced some CT pro- cedures (23;24). However, when we analyzed the rate of repeated uses, we found that there was a significant reduc- tion in repeated uses of CT and MRI during 1998 to 2001, most likely directly attributable to the implementation of this instant report policy for CT and MRI procedures.
In addition, because Taiwan’s DOH did not have regula- tions on life-year limitations for CT or MRI scanners, some small-scale hospitals due to financial constraints might pur- chase used CT or MRI scanners from other hospitals. Thus, if the imaging quality of some hospitals’ CTs or MRIs is poor, and if the patients are referred to larger hospitals, the physicians there might request repeat CT or MRI procedures.
To reduce the utilization of CT or MRI, some insurers in the United States or Japan have tried to lower the insurance payment or coverage for CT or MRI procedures to decrease a hospital’s profit margin (12;13), even for hospitals that realized no profit from CT or MRI procedures; in Japan, this tactic successfully contained the escalation of spending for high-tech health-care devices (14). The high price of insurance payment was a major incentive factor in developing advanced medical technology (8). Consequently, the price of health-insurance payment is the key factor in managing high-tech utilization and expansion. In Taiwan, BNHI only reduced payment for CT and MRI procedures in 1996, and these reimbursements need to be further adjusted in the near future to contain CT and MRI utilizations.
POLICY IMPLICATION
To reasonably control the utilization of high-tech medical equipment such as CT and MRI, we proposed the following recommendations to the health-policy decision-makers : (i) Health-care supply-side factors were the most important fac- tors affecting increased CT or MRI utilization. Changes in CT/MRI utilization will require controlling the supply of CTs and MRIs. (ii) The insurance payment should reduce the fi- nancial incentive for the utilization of CT/MRI by health-care providers. (iii) Sharing information or CT/MRI films among hospital-based physicians will help reduce the repeated uses of CT/MRI for the purpose of a second opinion. (iv) The gov- ernment or the insurer needs periodically to investigate the quality of CT or MRI machines and weed out the nonquali- fied CT or MRI for insurance payment. (v) Implementation of an instant report policy for CT/MRI utilization review will effectively reduce unnecessary utilization.
CONTACT INFORMATION
Pei-Tseng Kung, ScD, Assistant Professor (ptkung@seed.
net.tw), Department of Healthcare Administration, Taichung Healthcare and Management University, 500 Lioufeng Road, Wufeng Shiang, Taichung, Taiwan 41354
Wen-Chen Tsai, DrPH, (corresponding author) Associate Professor (wtsai@mail.cmu.edu.tw), Graduate Institute of
Health Services Management, China Medical University, 91 Hsueh-Shih Road, Taichung, Taiwan 40402
Chih-Liang Yaung, PhD, Professor, Vice President, and Chair (vp@thmu.edu.tw), Graduate Institute of Health Administration, Taichung Healthcare and Management University, 500 Lioufeng Road, Wufeng Shiang, Taichung, Taiwan 41354
Kai-Ping Liao, MHA, Research Assistant (u864009@apple.
cmu.edu.tw), Graduate Institute of Health Services Man- agement, China Medical University, 91 Hsueh-Shih Road, Taichung, Taiwan 40402
REFERENCES
1. Becker GS. Theory of the allocation of time. Econo J.
1965;75:403-517.
2. Boutwell RC, Mitchell JB. Diffusion of new technologies in the treatment of medicare population. Implications for patient access and program expenditures. Int J Technol Assess Health Care. 1993;9:62-75.
3. Brown MM, Brown GC, Sharma S, Hollands H, Smith AF.
Physician manpower and health care expenditures in the United States: A thirty-year perspective. J Health Care Finance. 2001;
27:55-64.
4. Bunge RE, Herman CL. Usage of diagnostic imaging proce- dures: A nationwide hospital study. Radiology. 1987;163:569- 573.
5. Bureau of National Health Insurance. Press Release, 16 May 2002. Available at: www.nhi.gov.tw/07information/news/data/
89/news0706.htm.
6. Chiang TL. Analysis on trends for healthcare expenditures in Taiwan [In Chinese: English Abstract]. Taiwan J Public Health.
2002;21:157-163.
7. Chu CL, Hsueh YS, Chiang TL. Does supply of physicians af- fect the use of ambulatory services by the insured?—Findings from the 1994 Taiwan Health Interview Survey [In Chi- nese: English Abstract]. Taiwan J Public Health. 2000;19:381- 388.
8. Garrison LP, Wilensky GR. Cost Containment and Incentives for Technology. Health Aff (Millwood). 1986;5:46-58.
9. Getzen TE. Health care is an individual necessity and a national luxury: Applying multilevel decision model to the analysis of health care expenditures. J Health Econ. 2000;19:259-270.
10. Gibson DJ, Eugene W. Caldwell lecture. Technology: The key to controlling health care costs in the future. AJR Am J Roentgenol. 1994;163:1289-1293.
11. Grossman M. On the concept of health capital and the demand for health. J Polit Econ. 1972;80:223-255.
12. Hellinger FJ. Controlling costs by adjusting payment for med- ical technologies. Inquiry. 1982;19:34-43.
13. Hisashige A. MR imaging in Japan and the United States:
Analysis of utilization and economics. AJR Am J Roentgenol.
1994;162:507-510.
14. Hisashige A. The introduction and evaluation of MRI in Japan.
Int J Technol Assess Health Care. 1994;10:392-405.
15. Kennedy RH, Baker HL, Houser OW, et al. Neurological com- puter tomography in a defined population group. Radiology.
1979;130:153-158.
16. Manning WG, Newhouse JP, Duan N, et al. Health insurance and the demand for medical care: Evidence from a randomized experiment. Am Econ Rev. 1987;77:251-277.
17. Lazaro P, Fitch K. The distribution of “big ticket” medical technology in OECD countries. Int J Technol Assess Health Care. 1995;11:552-570.
18. Lipper MH, Hillman BJ, Pates RD, et al. Ownership and uti- lization of MR imagers in the commonwealth of Virginia.
Radiology. 1995;195:217-221.
19. Mendelson DN, Schwartz WB. The effects of aging and pop- ulation growth on health care costs. Health Aff (Millwood).
1993;12:119-125.
20. Newhouse JP. Medical care costs: How much welfare loss?
J Econ Perspect. 1992;6:3-21.
21. Niki R. Why Japan has been a “winner” in a cost containment race? — Recent health care financing policy in Japan. APHA Conference. 1997;107-156.
22. Okunade AA, Murthy VNR. Technology as a ‘major driver’ of health care costs: A cointegration analysis of The Newhouse Conjecture. J Health Econ. 2002;21:147-159.
23. Passariello R. Cost containment and diffusion of MRI: Oil and water? The situation in Europe. Eur Radiol. 1997;7:259-262.
24. Peddecord KM, Janon EA, Robins JM. Use of MR imaging in an outpatient MRI center. AJR Am J Roentgenol. 1987;148:809- 812.
25. Roemer MI. Bed supply and hospital utilization: A national experiment. Hospital. 1961;35:36-42.
26. Taiwan, Department of Health. Health and vital statistics.
Taipei, Taiwan: Department of Health; 2002.
27. Tsai WC, Kung PT. Relationship between Chinese medical utilization and growth of physicians [In Chinese: English Abstract]. Taiwan J Public Health. 2001;20:463-474.
28. Tsai WD, Li IH. Hospital nonprice competition and market structure: An empirical study of hospitals’ acquisition of high- tech medical equipment. Acad Econ Papers. 2002;30:57-78.
29. Van Tielen R, Peys F, Geneaer J. The demographic impact on ambulatory pharmaceutical expenditure in Belgium. Health Policy. 1998;45:1-14.