Anti-angiogenic potential of three triterpenic acids in human liver cancer cells
12 3
CHUN-CHE LINø,,#, CHUN-YIN HUANG‡,#, MEI-CHIN MONG†, CHIEN-YI CHAN‡, 4
MEI-CHIN YIN†,‡,* 5
ø
Department of Internal Medicine, Chung Shan Medical University Hospital, Taichung City, 6
Taiwan 7
Institute of Medicine, Chung Shan Medical University, Taichung City, Taiwan 8
‡
Department of Nutrition, China Medical University, Taichung City, Taiwan 9
†
Department of Health and Nutrition Biotechnology, Asia University, Taichung County, 10
Taiwan 11
12 13
running title: anti-angiogenic potential of triterpenic acids 14
#
These two authors contributed equally to this study. 15
*To whom correspondence should be addressed: Dr. Mei-chin Yin, Professor, Department 16
of Nutrition, China Medical University, 16th Floor, 91, Hsueh-shih Rd, Taichung City, 17
Taiwan, ROC 18
TEL: 886-4-22053366 ext. 7510, FAX: 886-4-22062891 19
Email: [email protected] 20
ABSTRACT 1
Three triterpenic acids, oleanolic acid, ursolic acid and maslinic acid, at 2 or 4 mol/L 2
were used to study their anti-angiogenic potential in human liver cancer Hep3B, Huh7 and 3
HA22T cell lines. The effects of these compounds upon the level and/or expression of 4
hypoxia-inducible factor (HIF)-1, basic fibroblast growth factor (bFGF), vascular 5
endothelial growth factor (VEGF), interleukin (IL)-8, urokinase plasminogen activator 6
(uPA), reactive oxygen species (ROS), nitric oxide (NO) and cell invasion and migration 7
were examined. Results showed that these triterpenic acids at 4 mol/L significantly 8
suppressed HIF-1expression in three cell lines (P<0.05); and these compounds at test 9
doses failed to affect bFGF expression (P>0.05). Three triterpenic acids 10
dose-dependently decreased production and expression of VEGF and IL-8, retained 11
glutathione level, lowered ROS and NO levels, and declined cell invasion and migration in 12
test cell lines (P<0.05). These compounds also dose-dependently reduced uPA production 13
and expression in Hep3B and Huh7 cell lines (P<0.05); but these agents only at 4mol/L 14
significantly suppressed uPA production and expression in HA22T cells (P<0.05). These 15
findings suggest that these triterpenic acids are potent anti-angiogenic agents to retard 16
invasion and migration in liver cancer cells. 17
18
KEYWORDS: angiogenesis; triterpenic acid; liver cancer cell; hypoxia-inducible factor; 19
vascular endothelial growth factor 20
INTRODUCTION 1
Angiogenesis, also called as neovascularization, is an important process for tumor 2
growth and metastasis. Liver cancer, also called as hepatocellular carcinoma (HCC), is a 3
hypervascular tumor characterized by massive angiogenesis (1). The increased 4
circulating levels and/or expression of several angiogenetic factors such as vascular 5
endothelial growth factor (VEGF) and interleukin (IL)-8 in patients with HCC have been 6
reported (2, 3). Hypoxia-inducible factor (HIF)-1and basic fibroblast growth factor 7
(bFGF) are two crucial activators responsible for cancer angiogenesis, in which HIF-1 8
regulates the essential adaptive responses of cancer cells to hypoxia, the major 9
pathophysiological condition promoting angiogenesis; and bFGF mediates extracellular 10
matrix degradation (4, 5). In addition, VEGF through increasing vascular permeability 11
could enhance endothelial cell migration and proliferation, which are required for vascular 12
remodeling and sprouting development of new blood vessels (6). Overexpression of 13
urokinase plasminogen activator (uPA), a gene related to invasion, also contributed to HCC 14
angiogenesis (7). On the other hand, reactive oxygen species (ROS) and nitric oxide (NO) 15
play important roles in cancer angiogenesis because these free radicals enhance oxidative 16
stress and stimulate VGEF production, which in turn favors cancer progression (8, 9). 17
Obviously, these factors provide vascular support for the growth of already established 18
malignant tumor. Thus, any agents with suppressive effects on the production or 19
expression of these angiogenetic factors may be beneficial in retarding tumor progression. 20
Oleanolic acid, ursolic acid and maslinic acid are pentacyclic triterpenic acids 21
naturally occurring in many herbs and plant foods such as glossy privet fruit (Ligustrum 22
lucidum Ait.), hawthorn fruit (Crataegi Pinnatifidae Fructus) and olive (10, 11). The 23
inhibitory effects of oleanolic acid and ursolic acid against the growth of human bladder, 24
prostate and colorectal cancer cells have been observed (12, 13). Our previous study (14) 25
also found that these two triterpenic acids at 8mol/L caused markedly apoptotic effects in 1
four human liver cancer HepG2, Hep3B, Huh7 and HA22T cell lines via increasing DNA 2
fragmentation, decreasing mitochondrial membrane potential and lowering 3
Na+-K+-ATPase activity. Juan et al. (15) reported that maslinic acid, another triterpenic 4
acid, could inhibit cell proliferation in human colon cancer cell, HT-29. These studies 5
suggest that these triterpenic acids are potent anti-cancer agents to cause apoptosis or 6
retard metastasis for liver cancer. Therefore, a further study was conducted to examine 7
the anti-angiogenic potential of these triterpenic acids. The major purpose of our present 8
study was to investigate the effects of triterpenic acids on the production and/or expression 9
of HIF-1, bFGF, VEGF, IL-8 and uPA in liver cancer cell lines. The influence of these 10
compounds upon the production of ROS and NO in these cell lines was also evaluated. 11
On the other hand, the presence of ursolic acid and maslinic acid in apple peel has 12
been considered as major compounds responsible for the anti-cancer activity of apple (16). 13
So far, less information is available regarding the presence of these triterpenic acids in 14
fresh vegetables. In order to enrich the food component database, eleven locally available 15
fresh vegetables in Taiwan were used to analyze the content of oleanolic acid, ursolic acid 16
and maslinic acid. 17
18
MATERIALS AND METHODS 19
Chemicals. Oleanolic acid (OA, 99%), ursolic acid (UA, 98%) and maslinic acid 20
(MA, 98.5%) were purchased from Aldrich Chemical Co. (Milwaukee, WI, USA). 21
Medium, plates, antibiotics and chemicals used for cell culture were purchased from Difco 22
Laboratory (Detroit, MI, USA). All chemicals used in these measurements were of the 23
highest purity commercially available. 24
Content of Triterpenic Acids. Eleven locally available fresh vegetables, carrot 1
(Daucus carota L.), celery (Apium graveolens L.), okra (Hibiscus esculentus), eggplant 2
(Solanum melongena L.), spinach (Spinacia oleracea L.), leaf mustard (Brassica juncea), 3
gynura (Gynura bicolor DC.), Chinese chive (Allium tuberosum Rottler), fennel 4
(Foeniculum vulgare), basil (Ocimum basilicum L.) and daylily (Hemerocallis fulva L.), 5
were used to analyze the content of OA, UA and MA. These vegetables, harvested in 6
summer of 2010, were purchased from farms in central area of Taiwan. The content of 7
three triterpenic acids in these vegetables was analyzed by HPLC methods described in Liu 8
et al. (17). 9
Cell Culture. Human normal liver cell line (L-02 cell) and liver cancer Hep3B, Huh7 10
and HA22T cell lines were obtained from American Type Culture Collection (ATCC, 11
Rockville, MD, USA). All cells were cultured in RPMI 1640 medium, containing 10% 12
fetal bovine serum (BSA), 100 units/mL of penicillin and 100 units/mL of streptomycin 13
(pH 7.4). Hypoxia (1% O2) was created using an anaerobic jar (AnaeroPack Series, 14
Mitsubishi Gas Chemical, Tokyo, Japan) with an AnaeroPack disposable O2-absorbing and 15
CO2-generating agent. The culture medium was changed every three days, and cells were 16
subcultured once a week. A phosphate buffer saline (PBS, pH 7.2) was added to adjust 17
the cell number to 105/mL for various experiments and analyses. 18
Experimental Design. Stock solution of OA, UA or MA was prepared in dimethyl 19
sulfoxide (DMSO) and diluted with medium. An equal volume of DMSO (final 20
concentration <0.5%) was added to the controls. Our previous study (14) found that OA 21
and UA at 2 and 4mol/L caused 55-70% cell viability in Hep3B, Huh7 and HA22T cells 22
(8 mol/L caused 20-30% cell viability). Thus, in order to observe the effects of these 23
triterpenic acids upon angiogenic factors in living cells, these compounds at these two 24
doses were used for present study. The cells at 105/mL were treated with OA, UA or MA 25
at 2 or 4mol/L under hypoxia at 37 °C for 72 h. Control group contained no OA, UA 1
or MA. 2
Measurement of Glutathione (GSH), Reactive Oxygen Species (ROS) and Nitrite. 3
After 72 h hypoxic treatment, cells were washed and suspended in RPMI 1640 medium. 4
GSH concentration (ng/mg protein) was determined by a commercial colorimetric GSH 5
assay kit (OxisResearch, Portland, OR, USA). The dye DCFH2-DA was used to measure 6
level of intracellular cellular ROS according to the method of Fu et al. (18). In briefly, 7
cells were incubated with 50 mol/L dye for 30 min and washed with PBS. After 8
centrifugation at 412 xg for 10 min, the medium was removed and cells were dissolved 9
with 1% Triton X-100. Fluorescence changes were measured at an excitation wavelength 10
of 485 nm and an emission wavelength of 530 nm using a fluorescence microplate reader. 11
The production of NO was determined by measuring the formation of nitrite. Briefly, 12
100 L of supernatant was mixed with 100 L Griess reagent after centrifuged at 10,000 13
xg for 15 min at 4 ºC. The optical absorbance at 540 nm was measured and compared 14
with a sodium nitrite standard curve. 15
Determination of Angiogenic Factors. VEGF and IL-8 levels in cell homogenates 16
were quantified by commercial ELISA kits (R&D Systems, Minneapolis, MN, USA). 17
uPA level was assayed by commercial ELISA kit purchased from American Diagnostica 18
(Greenwich, CT, USA). Each measurement was made in duplicate, and the level of each 19
angiogenic factor was determined from a standard curve. 20
Real Time Polymerase Chain Reaction (RT-PCR) for mRNA Expression. Total 21
RNA was isolated from cells using Trizol reagent (Invitrogen, Life Technologies, Carlsbad, 22
CA, USA). Two g of total RNA was used to generate cDNA, which was amplified 23
using Taq DNA polymerase. PCR was carried out in 50 L of reaction mixture 24
dNTP, 2.5 mM MgCl2, 0.5 mM of each primer) and 2.5 U Taq DNA polymerase. The 1
specific oligonucleotide primers for HIF-1, bFGF, VEGF, IL-8, uPA and 2
glyceraldehyde-3-phosphate dehydrogenase (GAPDH, the housekeeping gene) are as 3
follows. HIF-1: forward, 5'-CTG CTG TCT TAC TGG TCC TT-3', reverse, 5'-GTC 4
GCT TCT CCA ATT CTT AC-3'; bFGF: forward, 5’-GTG TGC TAA CCG TAC CTG 5
GC-3’, reverse, 5’-CTG GTG ATT TCC TTG ACC GG-3’; VEGF, forward, 5'-ATG AAC 6
TTT CTG CTC TCT GG-3', reverse, 5'-TCA TCT CTC CTA TGT GCT GGC-3'; IL-8, 7
forward,5’-CAC TCT CAA TCA CTC TCA GTT CTT TGA T-3’;reverse,5’-CTT CCT 8
GAT TTC TGC AGC TCT GT-3’; uPA, forward, 5′-TCA CAC CAA GGA AGA GAA 9
TGG CCT-3′, reverse 5′-AAT GAC AAC CAG CAA GAA AGC GGG-3′;GAPDH: 10
forward,5’-TGA TGA CAT CAA GAA GGT GGT GAA G-3’,reverse,5’-CCT TGG 11
AGG CCA TGT AGG CCA T-3’. The cDNA was amplified under the following 12
reaction conditions: 95 ºC for 1 min, 55 ºC for 1 min, and 72 ºC for 1 min. 28 cycles 13
were performed for GAPDH and 35 cycles were performed for HIF-1, bFGF, VEGF, 14
IL-8 and uPA. Generated fluorescence from each cycle was quantitatively analyzed by 15
using the Taqman system based on real-time sequence detection system (ABI Prism 7700; 16
Perkin-Elmer Inc., Foster City, CA, USA). In this study, mRNA level was calculated as 17
percentage of the control group. 18
Invasion Assay. Invasion was measured using 8 m pore BD BioCoat Matrigel
19
Invasion Chambers (BD Biosciences, San Jose, CA, USA), in which membrane was 20
coated with 500 ng/μL Matrigel. After 72 h hypoxic treatment, cells were resuspended in 21
RPMI 1640 medium containing 1% BSA, and at 105/100 L were seeded into the upper 22
chamber. The chambers were incubated for 24 h at 37 ºC in a humidified, 5% CO2 23
atmosphere for cell invasion. Non-invasive cells were removed by Q-tip. Invasive cells 24
were stained with 0.2% crystal violet in 10% ethanol. Four independent fields of 25
invasive cells per well were photographed under the microscope to determine the number 1
of invasive cells. Data were calculated as percentage of the control group. 2
Migration assay. Migration was measured using a transwell chamber (Corning, NY, 3
USA). The underside of transwell membranes was precoated with fibronectin (10 4
g/mL). After 72 h hypoxic treatment, cells were resuspended in RPMI 1640 medium 5
containing 1% BSA, and at 105/100 L were seeded into the upper chamber of transwell 6
chambers separated by inserts with 6.5 mm polycarbonate filters of 8m pore size. After 7
24 h incubation, non-migratory cells on the upper surface of membranes were removed 8
and migratory cells were stained with 0.1% crystal violet. Four independent fields of 9
migratory cells per well were photographed under the microscope to determine the number 10
of migratory cells. Data were calculated as percentage of the control group. 11
Statistical Analysis. The effect of each treatment was analyzed from nine different 12
preparations (n=9). Data were reported as means standard deviation (SD), and 13
subjected to analysis of variance (ANOVA). Differences among means were determined 14
by the Least Significance Difference Test with significance defined at P<0.05. 15
16
RESULTS 17
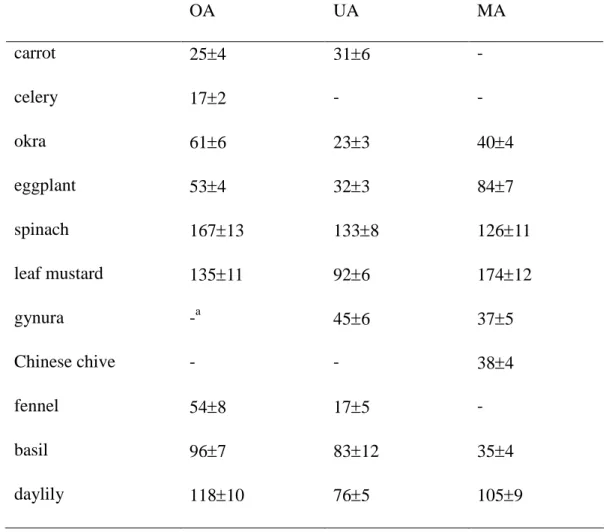
The content of three triterpenic acids in eleven fresh vegetables is shown in Table 1. 18
Among test vegetables, spinach had the highest content of OA and UA, and leaf mustard 19
had the highest MA content. As shown in Figure 1, HIF-1mRNA expression of three 20
liver cancer cells under hypoxic condition was greater than normoxic condition (P<0.05), 21
which indicated that hypoxia had been created. 22
OA, UA and MA at 4 mol/L significantly suppressed HIF-1mRNA expression in 23
three cell lines (Figure 2, P<0.05); and these compounds at test doses failed to affect bFGF 24
mRNA expression (Figure 3, P>0.05). Three triterpenic acids dose-dependently 1
decreased production and mRNA expression of VEGF and IL-8 in test cell lines (Figures 4 2
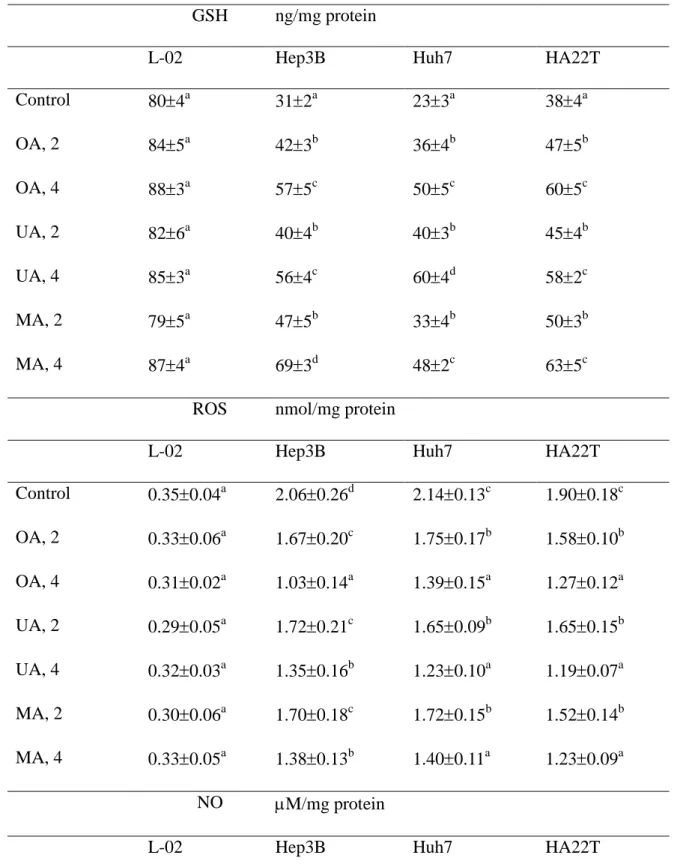
and 5, P<0.05). As shown in Table 2, three cancer cells had significantly lower GSH 3
level and higher production of ROS and NO than normal liver cells (P<0.05); however, test 4
compounds dose-dependently retained GSH level, and lowered production of ROS and NO 5
in test liver cancer cells (P<0.05). These compounds also dose-dependently diminished 6
invasion and migration in three test cell lines (Figure 6, P<0.05). As shown in Figure 7, 7
three test triterpenic acids dose-dependently reduced uPA production and mRNA 8
expression in Hep3B and Huh7 cell lines; but only at 4 mol/L significantly 9
down-regulated uPA production and mRNA expression in HA22T cells (P<0.05). 10
11
DISCUSSION 12
Our previous study already indicated that OA and UA exhibited marked apoptotic 13
effects in liver cancer cell lines (14). The results of our present study further found that 14
these two triterpenic acids and MA, another triterpenic acid, effectively down-regulated 15
mRNA expression of HIF-1, VEGF, IL-8, uPA, retained GSH level, decreased ROS and 16
NO production, as well as declined invasion and migration in three liver cancer cell lines 17
under hypoxic condition. These findings support that these triterpenic acids could 18
mitigate angiogenesis, which might attenuate liver cancer metastasis and deterioration. 19
Furthermore, we found that spinach, leaf mustard and daylily are rich in these triterpenic 20
acids. It has been suggested that vegetable intake could reduce cancer risk (19, 20). The 21
results of our present study further suggest that the vegetables rich in these triterpenic acids 22
may offer more protection against liver cancer. 23
Malignant tumor growth causes hypoxic condition within the tumor, which in turn 24
enhances the expression of HIF-1in order to mediate an adaptive response through 25
increasing angiogenesis. Subsequently, HIF-1, as an transcriptional activator, 1
up-regulates VEGF expression and leads to tumor neovascularization (21, 22). Thus, 2
regulation of HIF-1and/or VEGF has been considered as promising target for cancer 3
therapy. In our present study, three test triterpenic acids down-regulated HIF-1 4
expression at high dose, but decreased VEGF expression and production in dose-dependent 5
manner. Thus, the anti-angiogenic activity of these triterpenic acids could be partially 6
ascribed to these agents suppress HIF-1 and VEGF expression in test cell lines. 7
However, it is interesting to find that these agents at lower dose (2mol/L) failed to affect 8
HIF-1 expression, but they lowered VEGF expression. Obviously, other upstream 9
factor(s) was involved for VEGF transcription in these triterpene-treated cancer cells. 10
bFGF, another angiogenic activator, is more potent than VEGF for stimulating the vascular 11
endothelial mitogenesis because bFGF enhances the release and activity of collagenases, 12
proteases and integrins on the extracellular membrane to form nascent microvascular 13
networks (23). In our present study, three triterpenic acids at test doses failed to lower 14
bFGF expression. These results suggested that the anti-angiogenic activity of test 15
triterpenic acids did not involve bFGF associated pathway. 16
IL-8 from tumor cells is an autocrine growth factor and acts on endothelial cells 17
through their receptors to promote migration, invasion and angiogenesis, which 18
consequently elevated metastatic potential (24). Thus, decreasing IL-8 expression and 19
production might also alleviate cancer progression. In our present study, test triterpenic 20
acids reduced IL-8 expression and production in dose-dependent manner, which 21
subsequently contributed to diminish angiogenesis. IL-8 expression could be evoked by 22
HIF-1and NO (25, 26). Since these triterpenic acids could suppress HIF-1expression 23
and reduce NO production, it seems reasonable to observe the declined expression of 24
downstream target gene, IL-8. On the other hand, enhanced IL-8 expression could 1
increase the activity of some matrix metalloproteins and facilitate tumor cell invasion (27). 2
Thus, the lowered cell invasion as we observed in triterpene-treated liver cancer cells could 3
be partially ascribed to these agents already down-regulated IL-8. 4
It has been indicated that oxidative stress enhanced the expression of both HIF-1and 5
VEGF in cancer cells (28). Intracellular ROS derived from NADPH oxidase or 6
mitochondria, acting a signaling messenger, is able to activate critical target molecules 7
such as intercellular adhesion molecule-1 and trigger cell adhesion, 8
epithelial-mesenchymal transition and migration in tumor cells (29). Nitrite is capable of 9
inducing VEGF expression and favors nitrite-driven formation of endothelial tubes in 10
hypoxic tumor microenvironment (30). Obviously, liver cancer cells released ROS and 11
NO to promote their migration and angiogenesis. In our present study, triterpenic acids 12
treatments effectively retained GSH level, and reduced ROS and NO release in test cell 13
lines, which in turn alleviated oxidative stress and diminished the expression of angiogenic 14
factors such as VEGF. Several studies have reported that OA, UA and MA could 15
attenuate oxidative stress via sparing GSH, inhibiting NO production and/or scavenging 16
ROS (31-33). Thus, the lower ROS and NO levels in triterpenic acid-treated groups as 17
we observed could be explained. These findings revealed that these triterpenic acids 18
could mitigate angiogenesis in liver cancer cells through their anti-oxidative actions. 19
uPA converts plasminogen to plasmin, which is responsible for the degradation of 20
fibrin and extracellular matrix components, and finally promotes cell migration and 21
invasion (34). In our present study, the production and expression of uPA in the liver 22
cancer cell lines could be down-regulated by triterpenic acid treatments, which 23
subsequently decreased plasminogen conversion and degradation of fibrin and matrix 24
proteins. In addition, ROS could stimulate uPA expression in tumor cells (35). Thus, 25
the reduced uPA expression from triterpenic acids could be partially due to these 1
compounds already decrease ROS production. Since uPA expression was suppressed, the 2
observed lower cell invasion and migration in these triterpenic acid-treated groups could be 3
explained. Furthermore, test triterpenic acids at 4 mol/L inhibited 50-70% cell invasion 4
and migration in these three cell lines. Thus, these agents might be able to retard HCC 5
progression via blocking metastatic process. 6
It is interesting to find that three test compounds at equal dose exhibited greater 7
suppressive effects upon VEGF and uPA expression in Hep3B and Huh7 cells than in 8
HA22T cells, but these agents were greater in declining IL-8 expression in HA22T cells 9
than in other two cell lines. It has been reported that Hep3B expressed more 10
mesenchymal proteins for mesenchymal transition, Huh7 was highly associated with 11
hepatitis B virus- or C virus-related HCC, and HA22T was a poorly-differentiated cell line 12
(36-38). Thus, these cells, based on different pathological features and biochemical 13
behavior, might exhibit different response to certain chemical(s). These findings implied 14
that selecting any agent for anti-hepatoma therapy should consider the responsible cancer 15
cell line, and/or target molecules. In addition, the results of our present study suggested 16
that any agent, like these triterpenic acids, with multiple anti-cancer actions toward 17
multiple HCC cell lines might be appropriate choice for anti-HCC therapy. 18
In summary, the content of oleanolic acid, ursolic acid and maslinic acid in daylily, 19
spinach and leaf mustard was in the range of 76-174 mg/100 g dry weight. These three 20
triterpenic acids at 4mol/L markedly suppressed mRNA expression of angiogenic factors, 21
HIF-1, VEGF, IL-8 and uPA. These triterpenic acids also effectively alleviated 22
oxidative stress via retaining GSH level, lowering ROS and NO production, as well as 23
decreased cell invasion and migration in Hep3B, Huh7 and HA22T cell lines. These 24
findings suggest that these triterpenic acids are potent anti-angiogenic agents to retard 1
invasion and migration in liver cancer cells. 2
3
Acknowledgement 4
This study was supported by a grant from China Medical University, Taichung City, 5
Taiwan, ROC (Grant CMU99-asia-01). 6
LITERATURE CITED 1
1. Pang, R.; Poon, R.T. Angiogenesis and antiangiogenic therapy in hepatocellular 2
carcinoma. Cancer Lett. 2006, 242, 151-167. 3
2. Rosmorduc, O.; Housset, C. Hypoxia: a link between fibrogenesis, angiogenesis, and 4
carcinogenesis in liver disease. Semin. Liver Dis. 2010, 30, 258-270. 5
3. Battegay, E.J. Angiogenesis: mechanistic insights, neovascular diseases, and 6
therapeutic prospects. J. Mol. Med. 1995, 73, 333-346. 7
4. Pugh, C.W.; Ratcliffe, P.J. Regulation of angiogenesis by hypoxia: role of the HIF 8
system. Nat. Med. 2003, 9, 677-684. 9
5. Mise, M.; Arii, S.; Higashituji, H.; Furutani, M.; Niwano, M.; Harada, T.; Ishigami, S.; 10
Toda, Y.; Nakayama, H.; Fukumoto, M.; Fujita, J.; Imamura, M. Clinical significance 11
of vascular endothelial growth factor and basic fibroblast growth factor gene 12
expression in liver tumor. Hepatology 1996, 23, 455-464. 13
6. Finn, R.S.; Zhu, A.X. Targeting angiogenesis in hepatocellular carcinoma: focus on 14
VEGF and bevacizumab. Expert. Rev. Anticancer Ther. 2009, 9, 503-509. 15
7. Andreasen, P.A.; Kjoller, L.; Christensen, L.; Duffy, M.J. The urokinase-type 16
plasminogen activator system in cancer metastasis: a review. Int. J. Cancer 1997, 72, 17
1-22. 18
8. Morbidelli, L.; Donnini, S.; Ziche, M. Role of nitric oxide in the modulation of 19
angiogenesis. Curr. Pharm. Des. 2003, 9, 521-530. 20
9. Wu, W.S. The signaling mechanism of ROS in tumor progression. Cancer Metastasis 21
Rev. 2006, 25, 695-705.
22
10. Cui, T.; Li, J.Z.; Kayahara, H.; Ma, L.; Wu, L.X.; Nakamura, K. Quantification of the 23
polyphenols and triterpene acids in Chinese hawthorn fruit by high-performance 24
liquid chromatography. J. Agric. Food Chem. 2006, 54, 4574-4581. 25
11. Zhou, C.; Chen, K.; Sun, C.; Chen, Q.; Zhang, W.; Li, X. Determination of oleanolic 1
acid, ursolic acid and amygdalin in the flower of Eriobotrya japonica Lindl. by HPLC. 2
Biomed. Chromatogr. 2007, 21, 755-761.
3
12. Kassi, E.; Papoutsi, Z.; Pratsinis, H.; Aligiannis, N.; Manoussakis, M.; Moutsatsou, P. 4
Ursolic acid, a naturally occurring triterpenoid, demonstrates anticancer activity on 5
human prostate cancer cells. J. Cancer Res. Clin. Oncol. 2007, 133, 493-500. 6
13. Janakiram, N.B.; Indranie, C.; Malisetty, S.V.; Jagan, P.; Steele, V.E.; Rao, C.V. 7
Chemoprevention of colon carcinogenesis by oleanolic acid and its analog in male 8
F344 rats and modulation of COX-2 and apoptosis in human colon HT-29 cancer cells. 9
Pharm. Res. 2008, 25, 2151-2157.
10
14. Yan, S.L.; Huang, C.Y.; Wu, S.T.; Yin, M.C. Oleanolic acid and ursolic acid induce 11
apoptosis in four human liver cancer cell lines. Toxicol. Vitro. 2010, 24, 842-848. 12
15. Juan, M.E.; Wenzel, U.; Ruiz-Gutierrez, V.; Daniel, H.; Planas, J.M. Olive fruit 13
extracts inhibit proliferation and induce apoptosis in HT-29 human colon cancer cells. 14
J. Nutr. 2006, 136, 2553-2557.
15
16. He, X.; Liu, R.H. Triterpenoids isolated from apple peels have potent antiproliferative 16
activity and may be partially responsible for apple's anticancer activity. J. Agric. Food 17
Chem. 2007, 55, 4366-4370.
18
17. Liu, H.; Shi, Y.; Wang, D.; Yang, G.; Yu, A.; Zhang, H. MECC determination of 19
oleanolic acid and ursolic acid isomers in Ligustrum lucidum Ait. J. Pharm. Biomed. 20
Anal. 2003, 32, 479-485.
21
18. Fu, W.; Luo, H.; Parthasarathy, S.; Mattson, M.P. Catecholamines potentiate amyloid 22
β-peptide neurotoxicity: involvement of oxidative stress, mitochondrial dysfunction,
23
and perturbed calcium homeostasis. Neurobiol. Dis. 1998, 5, 229-243. 24
19. Key, T.J.; Schatzkin, A.; Willett, W.C.; Allen, N.E.; Spencer, E.A.; Travis, R.C. Diet, 1
nutrition and the prevention of cancer. Public Health Nutr. 2004, 7, 187-200. 2
20. Khan, N.; Afaq, F.; Mukhtar, H. Cancer chemoprevention through dietary 3
antioxidants: progress and promise. Antioxid. Redox Signal. 2008, 10, 475-510. 4
21. Rey, S.; Semenza, G.L. Hypoxia-inducible factor-1-dependent mechanisms of 5
vascularization and vascular remodelling. Cardiovasc. Res. 2010, 86, 236-242. 6
22. Liao, D.; Johnson, R.S. Hypoxia: a key regulator of angiogenesis in cancer. Cancer 7
Metastasis Rev. 2007, 26, 281-290.
8
23. Rusnati, M.; Presta, M. Interaction of angiogenic basic fibroblast growth factor with 9
endothelial cell heparan sulfate proteoglycans. Biological implications in 10
neovascularization. Int. J. Clin. Lab. Res. 1996, 26, 15-23. 11
24. Waugh, D.J.; Wilson, C. The interleukin-8 pathway in cancer. Clin. Cancer Res. 2008, 12
14, 6735-6741.
13
25. Xiong, Q.; Shi, Q.; Le, X.; Wang, B.; Xie, K. Regulation of interleukin-8 expression 14
by nitric oxide in human pancreatic adenocarcinoma. J. Interferon Cytokine Res. 2001, 15
21, 529-537.
16
26. Mizukami, Y.; Jo, W.S.; Duerr, E.M.; Gala, M.; Li, J.; Zhang, X.; Zimmer, M.A.; 17
Iliopoulos, O.; Zukerberg, L.R.; Kohgo, Y.; Lynch, M.P.; Rueda, B.R.; Chung, D.C. 18
Induction of interleukin-8 preserves the angiogenic response in HIF-1alpha-deficient 19
colon cancer cells. Nat. Med. 2005, 11, 992-997. 20
27. Kubo, F.; Ueno, S.; Hiwatashi, K.; Sakoda, M.; Kawaida, K.; Nuruki, K.; Aikou, T. 21
Interleukin 8 in human hepatocellular carcinoma correlates with cancer cell invasion 22
of vessels but not with tumor angiogenesis. Ann. Surg. Oncol. 2005, 12, 800-807. 23
28. Shi, D.Y.; Xie, F.Z.; Zhai, C.; Stern, J.S.; Liu, Y.; Liu, S.L. The role of cellular 1
oxidative stress in regulating glycolysis energy metabolism in hepatoma cells. Mol. 2
Cancer 2009, 8, 32.
3
29. Wang, Z.; Li, Y.; Sarkar, F.H. Signaling mechanism(s) of reactive oxygen species in 4
Epithelial-Mesenchymal Transition reminiscent of cancer stem cells in tumor 5
progression. Curr. Stem Cell Res. Ther. 2010, 5, 74-80. 6
30. Frérart, F.; Lobysheva, I.; Gallez, B.; Dessy, C.; Feron, O. Vascular caveolin 7
deficiency supports the angiogenic effects of nitrite, a major end product of nitric 8
oxide metabolism in tumors. Mol. Cancer Res. 2009, 7, 1056-1063. 9
31. Hsu, C.L.; Hong, B.H.; Yu, Y.S.; Yen, G.C. Antioxidant and anti-inflammatory 10
effects of Orthosiphon aristatus and its bioactive compounds. J. Agric. Food Chem. 11
2010, 58, 2150-2156. 12
32. Márquez Martín, A.; de la Puerta Vázquez, R.; Fernández-Arche, A.; Ruiz-Gutiérrez, 13
V. Supressive effect of maslinic acid from pomace olive oil on oxidative stress and 14
cytokine production in stimulated murine macrophages. Free Radic. Res. 2006, 40, 15
295-302. 16
33. Tsai, S.J.; Yin, M.C. Antioxidative and anti-inflammatory protection of oleanolic acid 17
and ursolic acid in PC12 cells. J. Food Sci. 2008, 73, 174-178. 18
34. Stefansson, S.; McMahon, G.A.; Petitclerc, E.; Lawrence, D.A. Plasminogen activator 19
inhibitor-1 in tumor growth, angiogenesis and vascular remodeling. Curr. Pharm. Des. 20
2003, 9, 1545-1564. 21
35. Lee, K.H.; Kim, J.R. Reactive oxygen species regulate the generation of urokinase 22
plasminogen activator in human hepatoma cells via MAPK pathways after treatment 23
with hepatocyte growth factor. Exp. Mol. Med. 2009, 41, 180-188. 24
36. Huang, E.J.; Wu, C.C.; Lee, S.D.; Chen, J.H.; Liu, J.Y.; Ko, J.L.; Lin, J.A.; Lu, M.C.; 1
Chen, L.M.; Huang, C.Y.; Kuo, W.W. Opposing action of estrogen receptors alpha 2
and beta on tumor necrosis factor alpha gene expression and caspase-8-mediated 3
apoptotic effects in HA22T cells. Mol. Cell Biochem. 2006, 287, 137-145. 4
37. Slany, A.; Haudek, V.J.; Zwickl, H.; Gundacker, N.C.; Grusch, M.; Weiss, T.S.; Seir, 5
K.; Rodgarkia-Dara, C.; Hellerbrand, C.; Gerner, C. Cell characterization by proteome 6
profiling applied to primary hepatocytes and hepatocyte cell lines Hep-G2 and 7
Hep-3B. J. Proteome Res. 2010, 9, 6-21. 8
38. Ura, S.; Honda, M.; Yamashita, T.; Ueda, T.; Takatori, H.; Nishino, R.; Sunakozaka, 9
H.; Sakai, Y.; Horimoto, K.; Kaneko, S. Differential microRNA expression between 10
hepatitis B and hepatitis C leading disease progression to hepatocellular carcinoma. 11
Hepatology 2009, 49, 1098-1112.
Table 1. Content (mg/100 g dry weight) of oleanolic acid (OA), ursolic acid (UA) and 1
maslinic acid (MA) in eleven vegetables, carrot, celery, okra, eggplant, spinach, leaf 2
mustard, gynura, Chinese chive, fennel, basil and daylily. Data are meanSD, n=6. 3 OA UA MA carrot 254 316 -celery 172 - -okra 616 233 404 eggplant 534 323 847 spinach 16713 1338 12611 leaf mustard 13511 926 17412 gynura -a 456 375 Chinese chive - - 384 fennel 548 175 -basil 967 8312 354 daylily 11810 765 1059 a
means too low to be detected. 4
Figure 1. HIF-1mRNA expression in human Hep3B, Huh7 and HA22T cell lines under 1
normoxia and hypoxia condition. Data are meanSD (n = 9). a,bMeans among bars 2
without a common letter differ, P<0.05. 3
1 b a b a b a 0 50 100 150 200 250 300 350 400 normoxia hypoxia re la ti v e m R N A ex p re ss io n
Hep3B Huh7 HA22T 2
Figure 2. Effect of oleanolic acid (OA), ursolic acid (UA) and maslinic acid (MA) at 0 1
(control), 2 or 4 mol/L upon HIF-1mRNA expression in human Hep3B, Huh7 and 2
HA22T cell lines. Data are meanSD (n = 9). a-cMeans among bars without a common 3
letter differ, P<0.05. 4
c c b b b b b a a c b b a a a c b b b a a 0 20 40 60 80 100 120
Hep3B Huh7 HA22T
re la ti v e m R N A ex p re ss io n (% o f co n tr o l)
control OA, 2 OA, 4 UA, 2 UA, 4 MA, 2 MA, 4 1
Figure 3. Effect of oleanolic acid (OA), ursolic acid (UA) and maslinic acid (MA) at 0 1
(control), 2 or 4mol/L upon bFGF mRNA expression in human Hep3B, Huh7 and HA22T 2
cell lines. Data are meanSD (n = 9). aMeans among bars without a common letter differ, 3
P<0.05.
a a a a a a a a a a a a a a a a a a a a a 0 20 40 60 80 100
Hep3B Huh7 HA22T
re la ti v e m R N A ex p re ss io n (% o f co n tr o l)
control OA, 2 OA, 4 UA, 2 UA, 4 MA, 2 MA, 4 1
Figure 4. Effect of oleanolic acid (OA), ursolic acid (UA) and maslinic acid (MA) at 0 1
(control), 2 or 4mol/L upon VEGF level (upper part) and mRNA expression (lower part) in 2
human Hep3B, Huh7 and HA22T cell lines. Data are meanSD (n = 9). a-dMeans among 3
bars without a common letter differ, P<0.05. 4
d c c c b b b a a b b b a a a b b b a a a 0 50 100 150 200 250
Hep3B Huh7 HA22T
p g /m g p ro te in
control OA, 2 OA, 4 UA, 2 UA, 4 MA, 2 MA, 4 1
c c c b b b a a a b b b a a a b b b a a a 0 20 40 60 80 100 120
Hep3B Huh7 HA22T
re la ti v e m R N A ex p re ss io n (% o f co n tr o l)
control OA, 2 OA, 4 UA, 2 UA, 4 MA, 2 MA, 4
Figure 5. Effect of oleanolic acid (OA), ursolic acid (UA) and maslinic acid (MA) at 0 1
(control), 2 or 4 mol/L upon IL-8 level (upper part) and mRNA expression (lower part) in 2
human Hep3B, Huh7 and HA22T cell lines. Data are meanSD (n = 9). a-dMeans among 3
bars without a common letter differ, P<0.05. 4
d d d b c b a b a b c b a a a c c c b b b 0 50 100 150 200 250 300
Hep3B Huh7 HA22T
p g /m g p ro te in
control OA, 2 OA, 4 UA, 2 UA, 4 MA, 2 MA, 4
1 2 3
d c c b b b a a a b b b a a a c b b a a a 0 20 40 60 80 100 120
Hep3B Huh7 HA22T
re la ti v e m R N A ex p re ss io n (% o f co n tr o l)
control OA, 2 OA, 4 UA, 2 UA, 4 MA, 2 MA, 4 1
Table 2. Effect of oleanolic acid (OA), ursolic acid (UA) and maslinic acid (MA) at 0 1
(control), 2 or 4 mol/L upon level of GSH, ROS and NO in human normal liver cell line 2
(L-02 cells), Hep3B, Huh7 and HA22T cell lines. Data are meanSD (n = 9). 3
GSH ng/mg protein
L-02 Hep3B Huh7 HA22T
Control 804a 312a 233a 384a OA, 2 845a 423b 364b 475b OA, 4 883a 575c 505c 605c UA, 2 826a 404b 403b 454b UA, 4 853a 564c 604d 582c MA, 2 795a 475b 334b 503b MA, 4 874a 693d 482c 635c
ROS nmol/mg protein
L-02 Hep3B Huh7 HA22T
Control 0.350.04a 2.060.26d 2.140.13c 1.900.18c OA, 2 0.330.06a 1.670.20c 1.750.17b 1.580.10b OA, 4 0.310.02a 1.030.14a 1.390.15a 1.270.12a UA, 2 0.290.05a 1.720.21c 1.650.09b 1.650.15b UA, 4 0.320.03a 1.350.16b 1.230.10a 1.190.07a MA, 2 0.300.06a 1.700.18c 1.720.15b 1.520.14b MA, 4 0.330.05a 1.380.13b 1.400.11a 1.230.09a NO M/mg protein
Control 1.30.3a 15.71.1d 14.61.0c 15.31.4d OA, 2 1.60.5a 10.50.7b 12.10.6b 10.81.0b OA, 4 1.40.2a 8.30.9a 8.51.1a 7.90.8a UA, 2 1.20.4a 12.60.8c 11.80.9b 12.91.2c UA, 4 1.50.2a 8.01.1a 8.30.7a 7.60.5a MA, 2 1.40.5a 13.11.0c 12.21.2b 13.00.9c MA, 4 1.30.6a 8.20.6a 9.00.8a 7.40.6a a-d
Means in a column without a common letter differ, P<0.05. 1
Figure 6. Effect of oleanolic acid (OA), ursolic acid (UA) and maslinic acid (MA) at 0 1
(control), 2 or 4 mol/L upon invasion and migration in human Hep3B, Huh7 and HA22T 2
cell lines. Data are meanSD (n = 9). a-dMeans among bars without a common letter 3
differ, P<0.05. 4
invasion c c c b b b a a a b b b a a a b b b a a a 0 20 40 60 80 100 120
Hep3B Huh7 HA22T
% o f co n tr o l
control OA, 2 OA, 4 UA, 2 UA, 4 MA, 2 MA, 4
1 2
migration c c d b b c a a b b b b a a a b b c a a b 0 20 40 60 80 100 120
Hep3B Huh7 HA22T
% o f co n tr o l
control OA, 2 OA, 4 UA, 2 UA, 4 MA, 2 MA, 4 1
Figure 7. Effect of oleanolic acid (OA), ursolic acid (UA) and maslinic acid (MA) at 0 1
(control), 2 or 4mol/L upon uPA level (upper part) and mRNA expression (lower part) in 2
human Hep3B, Huh7 and HA22T cell lines. Data are meanSD (n = 9). a-dMeans among 3
bars without a common letter differ, P<0.05. 4
1 d d b c c b b b a c c b a b a c c b a a a 0 2 4 6 8 10 12 14 16
Hep3B Huh7 HA22T
n g /m g p ro te in
control OA, 2 OA, 4 UA, 2 UA, 4 MA, 2 MA, 4
b d d b c c a b b b c c a b a b b c a a a 0 20 40 60 80 100 120
Hep3B Huh7 HA22T
re la ti v e m R N A ex p re ss io n (% o f co n tr o l)
control OA, 2 OA, 4 UA, 2 UA, 4 MA, 2 MA, 4