CHAPTER FOUR
4.1 Pilot Survey
Profile
ot survey, all of the interviewees received their
er
erience(yr) RESULTS
4.1.1 Interviewee
According to the pil
int preting trainings in interpreter’s training schools, including Graduate Institute
of Translation and Interpreting Studies of Fu Jen Catholic University and
Graduate School of Translation and Interpretation of Monterey Institute of
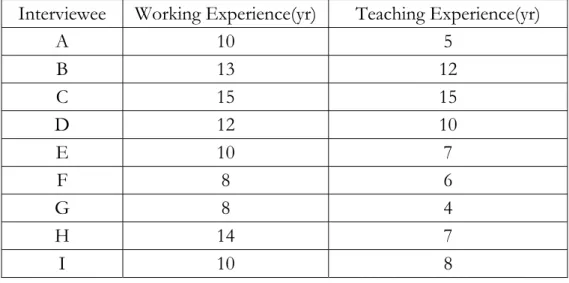
International Studies. The average professional experience is eleven years, and the
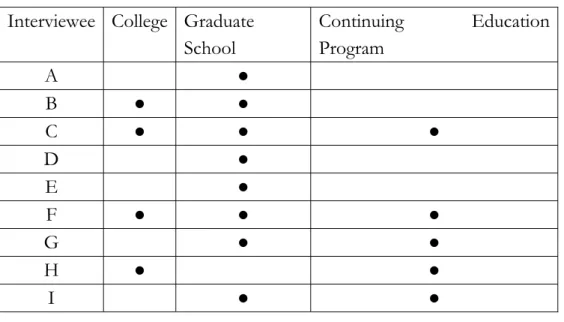
average teaching experience is eight years. The interviewees have various teaching
experiences. Four of them taught or teach at colleges, five at continuing education
institutes, and eight at the oldest interpreter training institutes of National Taiwan
Normal University and Fu Jen Catholic University. (See Table 4.1 and Table 4.2)
Table 4.1 Working and Teaching Experience of Interviewees Interviewee Working Experience(yr) Teaching Exp
A 10 5
B 13 12
C 15 15
D 12 10
E 10 7
F 8 6
G 8 4
H 14 7
I 10 8
Source: Compiled by this research
Average 11 8
Table 4.2 Interviewee’s Teaching Experience Interviewee College Graduate
School
Continuing Education Program
A ●
B ● ●
C ● ● ●
D ● E ●
F ● ● ●
G ● ●
H ● ●
I ● ●
Source: Compiled by this research
4.1.2 Participants’ Perspectives on Time Ratio
In the questionnaire, the interviewees were first asked “When you were a
student at an interpreting training institute, did your instructors emphasize that in
a consecutive interpreting setting the time ratio of interpretation relative to the
original speech must be maintained at a certain level, and time your production in
class?” Seven out of nine respondents replied that their instructors did talk about
this concept, and six of them said their instructors did time their performance in
class.
In the second question, “Did your instructors specify the time ratio of
interpretation relative to the original speech?”, five respondents provided the
ratios specified by their instructors. Two of them said interpretation should take
no more than 80% of the time of the original, two said 75%, and the other one
said interpretation can take as much time as the original does. However, when
asked “Did your instructors explain how the ratio was defined”, four of the
respondents said their instructors did not provide any explanation, and the other
one could not recall if the explanation was given. As a result, none of the
interviewees could provide a rationale of keeping a time ratio.
In the fourth question “According to your working experience, what should
the ratio be?”, eight of the respondents suggested in a consecutive setting,
interpretation should take less time than the original while the other one said
interpretation can take as much as the original if necessary.
When further asked for explanations to support this concept, some
respondents offered the following arguments:
- Chinese is more condensed than English.
- Messages are reorganized and filtered when translated, so it should take less
time.
- An interpreter should not steal the speaker’s thunder.
- In a consecutive interpreting setting, a lengthy interpretation will slow down
the pace and delay the schedule.
- Conference organizers believe interpretation should be shorter than the
original in a CI setting.
The above arguments only reflect what interpreters believe. Is it really
necessary for interpreters to stay within the limit of their empirically defined time
ratio, and does the audience really care? It is in this research that such an issue will
be explored.
4.1.3 Pedagogical Practices
In the following section of the pilot study survey, it is found that six out of
the nine interviewees timed their student's CI production in class, and two other
interviewees did not do so. The other interviewee did not answer the three
questions in part two because this interviewee has been teaching simultaneous
interpreting only. In addition, among seven of the nine the respondents stated that
students’ interpretation should be shorter than the original, only three of whom
could provide specific time ratios: 70%, 80%, and 90% of the time of the original.
However, one respondent suggested that the students’ interpretation can take as
much as the original.
In the exams organized by their interpreter training institutes, such as GITI
and GITIS, students are also timed when taking the subject of consecutive
interpreting. Before Joint Professional Diploma Examination in Conference
Interpretation (JPDECI) co-organized by GITI and GITIS, time ratio was used as
a grading factor of professional exam organized by GITIS (Yang, 2000). However,
as mentioned before, is such a criterion relevant to audience’s expectation since an
interpreter’s job is to provide satisfactory service for audience? It is pivotal to
research audience’s expectations which should be incorporated in the evaluation
criteria of the joint professional exam.
4.2 Sample Profile
A total of 120 participants were invited to participate in the experiment, 30
for each group. All the participants are either college students or holders of a
higher education degree. In each group, 20 participants are students, and the other
10 non-students. The purpose of such an arrangement is to ensure an identical
pattern of participant profile in each group.
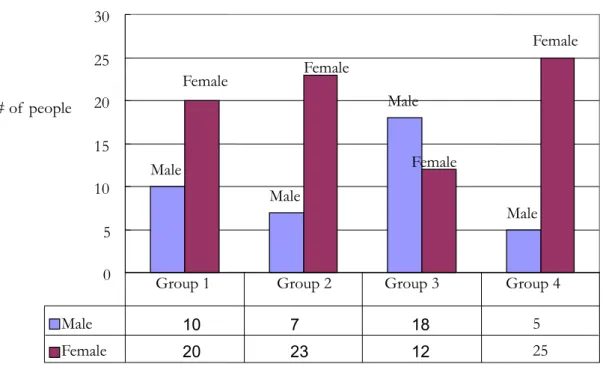
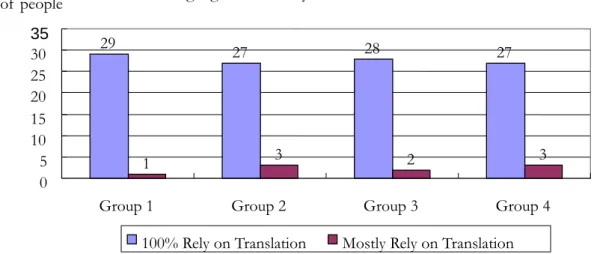
As for gender distribution, 40 are male, and 80 are female. In terms of
language proficiency, 111 participants indicated they had to 100% rely on
interpretation to understand the main ideas of the French speech, while nine
others could understand a small part of the French original but still needed to rely
on interpretation to understand the main ideas in the French speech. For the
Japanese speech, 102 participants indicated they had to 100% rely on
interpretation to understand the main ideas, while 18 others stated that they could
understand a small part of the original but still needed to rely on interpretation to
understand the main ideas.
The following charts are the breakdowns of gender distribution and profiles
of language proficiency of each group. (See Figure 4.1, 4.2, and 4.3)
Gender Distribution
Male
Male
Male
Male Female Female
Female
Female
0 5 10 15 20 25 30
# of people
Male 10 7 18 5
Female 20 23 12 25
Group 1 Group 2 Group 3 Group 4
Figure 4.1 Breakdowns by Gender Source: Compiled by this research
Language Proficiency Profile of French
29 27 28 27
1 3 2 3
0 5 10 15 20 25 30 35
Group 1 Group 2 Group 3 Group 4
# of people
100% Rely on Translation Mostly Rely on Translation
Source: Compiled by this research
Figure 4.2 Profiles of Language Proficiency---French
Language Proficiency Profile of Japanese
24 23
27 28
6 7
3 2
0 5 10 15 20 25 30
Group 1 Group 2 Group 3 Group 4
# of people
100% Rely on Translation Mostly Rely on Translation
Source: Compiled by this research
Figure 4.3 Profiles of Language Proficiency ---Japanese
4.3 Results
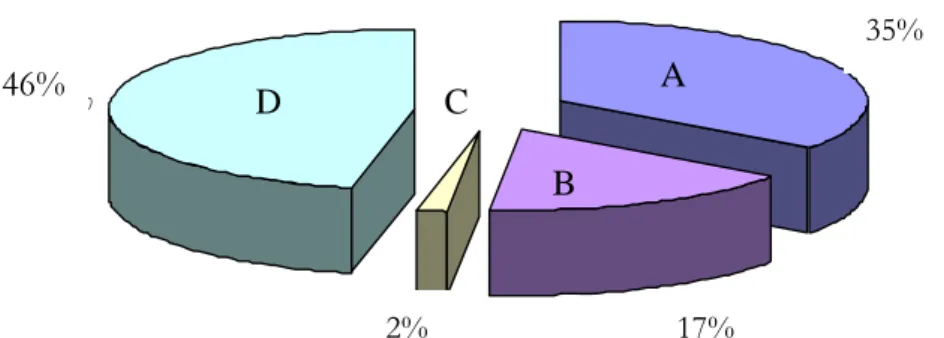
Of all the 120 participants, 42 participants are able to correctly identify the
length of interpretation (type A), while 56 indicate their evaluation is not subject
to the length of interpretation (type D). There are also 20 participants who
incorrectly identify the length while claiming that their evaluation is subject to the
length of interpretation (type B). Two others indicate they are unable to identify
the length of interpretation but still state that their evaluation is subject to the
length of interpretation (type C). Breakdown of the results is shown in Figure 4.4.
35%
17
35%
2% %
46% 46% A
B
D C
Source: Compiled by this research
Figure 4.4 Breakdown of Overall Results
17%
2%
When the participants were asked to rate the overall quality of both
interpretations (Question One and Two), 30 out of the 120 participants (25%)
prefer the interpretation longer than its original, 29 (24.16%) assigned the same
score to both interpretations, and the rest 61 (50.84%) prefer the interpretation
shorter than the original.
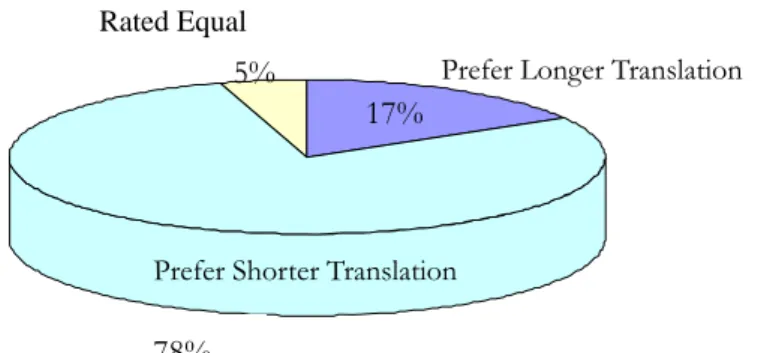
Among type A participants, 33 (78%) of them prefer the interpretation that
takes less time than the original, seven (17%) prefer that takes more time, and the
other two (5%) rated both interpretations equal. (See Figure 4.5)
17%
5%
Rated Equal
Prefer Longer Translation
Prefer Shorter Translation
78%
Source: Compiled by this research
Figure 4.5 Breakdown of Type A Participants’ Preferences 78%
Among type B participants, 12 out of 20 participants prefer interpretations
that take more time than the original, and the other eight participants prefer
otherwise. The breakdown of type B participants’ preferences is shown in Figure
4.6.
60%
40%
Prefer Translation Shorter
Than Original Prefer Translation Longer Than Original
Source: Compiled by this research
Figure 4.6 Breakdown of Type B Participants’ Preferences
Among type C participants, one of the two participants prefers
interpretations longer than the original while the other one prefers otherwise. For
type D participants, their evaluation is not subject to the length of interpretation,
so there is not preference breakdown.
4.3.1 Group One ---Long French –Short Japanese
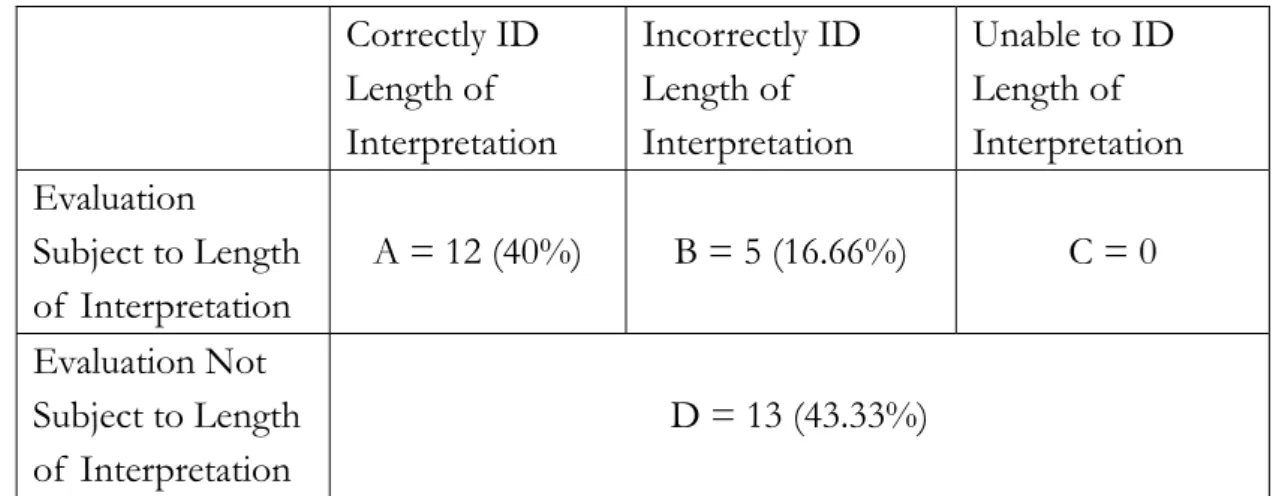
In Group One, 12 out of 30 participants (40%) correctly identify the length
of interpretation and indicate that their evaluation is subject to the length of
interpretation, five (16.66%) incorrectly identify the length of interpretation and
indicate their evaluation is subject to the length of interpretation, no one state that
they are unable to identify the length of interpretation, and 13 (43.33%) indicate
their evaluation is not subject to the length of interpretation. (See Table 4.3)
Table 4.3 Result of Group One
Correctly ID
Length of Interpretation
Incorrectly ID Length of Interpretation
Unable to ID Length of Interpretation Evaluation
Subject to Length of Interpretation
A = 12 (40%) B = 5 (16.66%) C = 0
Evaluation Not Subject to Length of Interpretation
D = 13 (43.33%)
Source: Compiled by this research
Among type A participants, four prefer the Chinese interpretation from
French, six prefer that from Japanese, and two others rate both interpretations
equal. The distribution of type A participants’ preferences is shown in Figure 4.7.
0. 0% 14%
20%
6%
40%
43%
17%
Figure 4.7 Preference of Interpretation ---Type A Participants Source: Compiled by this research
Prefer Translation from French
Equal Prefer Translation from Japanese
C
B D
A
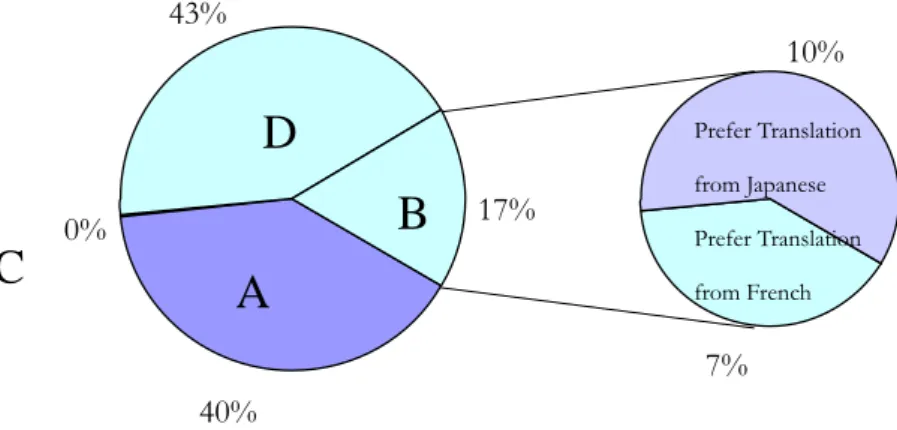
Among type B participants, two prefer the Chinese interpretation from
French, and three prefer that from Japanese. The distribution of type B
participants’ preferences is shown in Figure 4.8.
40%
0%
43%
7%
10%
17%
A D
C
B
Prefer Translation from Japanese Prefer Translation from French
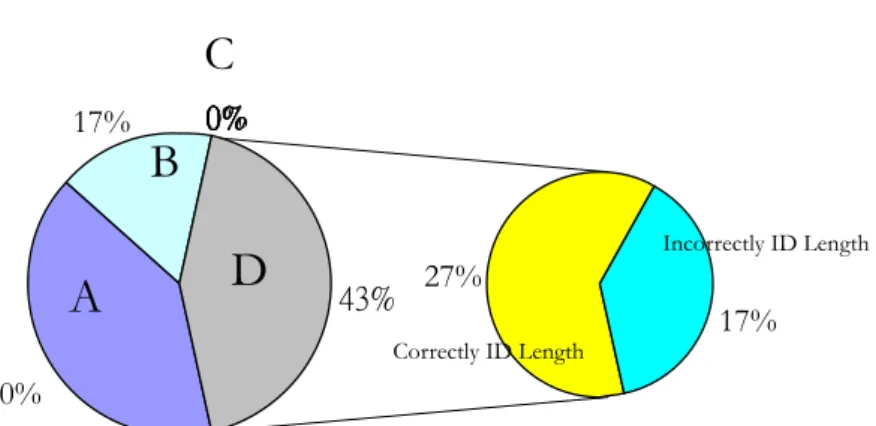
Among type D participants, eight out of the 13 participants are able to Source: Compiled by this research
Figure 4.8 Preference of Interpretation---Type B Participants
correctly identify the length of interpretation, and the other five fail to do so. The
percentage distribution is shown in Figure 4.9.
17% 0%0%0%0%0%0%
27%
43% 17%
40%
C
Source: Compiled by this research
Figure 4.9 Percentage of Correctly ID Length---Type D Participants
Incorrectly ID Length
B D
Correctly ID Length
A
Overall in Group One, 20 participants correctly identify the length of
interpretation, and the other 10 fail to do so. The percentage distribution is shown
in Figure 4.10.
Chart 4-10 Percentage of Correctly ID Length
67%
33%
ID Length Correctly Fail to ID Length
Figure 4.10 Percentage of Correctly ID Length---Group One Source: Compiled by this research
4.3.2 Group Two ---Long Japanese-Short French
In Group Two, 11 (36.66%) participants correctly identify the length of
interpretation and indicate that their evaluation is subject to the length of
interpretation, six (20%) incorrectly identify the length of interpretation and
indicate their evaluation is subject to the length of interpretation, one (3.33%)
state that he is unable to identify the length of interpretation, and 12 (20%)
indicate their evaluation is not subject to the length of interpretation, as shown in
Table 4.4.
Table 4.4 Result of Group Two
Correctly ID
Length of Interpretation
Incorrectly ID Length of Interpretation
Unable to ID Length of Interpretation Evaluation
Subject to Length of Interpretation
A = 11 (36.66%) B = 6 (20%) C = 1 (3.33%)
Evaluation Not Subject to Length of Interpretation
D = 12 (40%)
Source: Compiled by this research
Among type A participants, all of the participants prefer the Chinese
interpretation from French. (see Figure 4.11 for the detailed breakdown)
Among type B participants, two prefer the Chinese interpretation from
French, and four prefer that from Japanese. (See Figure 4.12 for detailed
breakdown)
40%
7%
13%
3.33% 20%
36.66%
Source: Compiled by this research
Figure 4.12 Preference of Interpretation---Type B Participants
20%
40%
0%
36.66
%
3.33%
36.66%
A D
C B
Prefer Translation from French
A
Source: Compiled by this research
Figure 4.11 Preference of Interpretation---Type A Participants
Prefer Translation from Japanese
Prefer Translation from French
C
D B
Among type C participants, only one participant indicates that s/he is unable
to identify the length of interpretation, but still states that the interpretation from
Japanese is preferred to that from French.
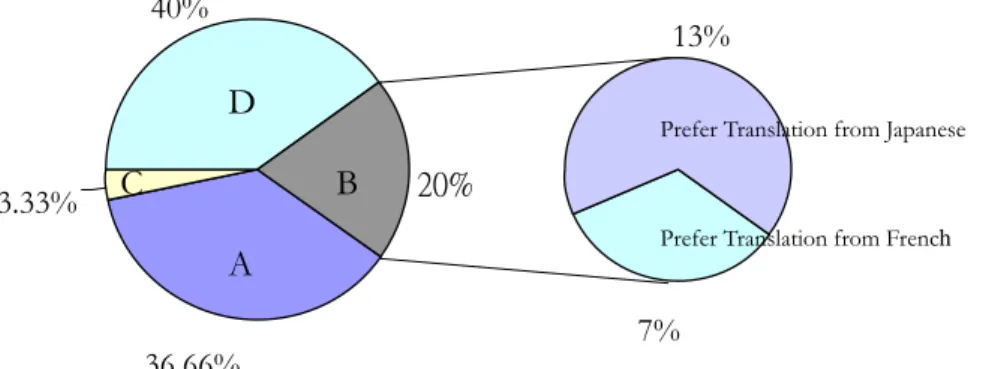
Among type D participants, eight out of 12 participants are able to correctly
identify the length of interpretation, and the other four fail to do so. (See Figure
4.13 for detailed breakdown)
20%
27%
40% 13%
36.66%
3.33%
Source: Compiled by this research
Figure 4.13 Percentage of Correctly ID Length ---Type D Participants
Incorrectly ID Length
Correctly ID Length
C B
A D
Overall in Group Two, 15 participants correctly identify the length of
interpretation, and the other 15 fail to do so. (See Figure 4.14 for detailed
breakdown)
50%
50% Correctly ID Length
Incorrectly ID Length
Source: Compiled by this research
Figure 4.14 Overall Percentage of Correctly ID Length---Group Two
4.3.3 Group Three ---Short French-Long Japanese
In Group Three, nine (30%) participants correctly identify the length of
interpretation and indicate that their evaluation is subject to the length of
interpretation, two (6.66%) incorrectly identify the length of interpretation and
indicate their evaluation is subject to the length of interpretation, one (3.33%)
state that he is unable to identify the length of interpretation, and 18 (60%)
indicate their evaluation is not subject to the length of interpretation. (see Table
4.5 for detailed breakdown)
Table 4.5 Result of Group Three
Correctly ID
Length of Interpretation
Incorrectly ID Length of Interpretation
Unable to ID Length of Interpretation Evaluation
Subject to Length of Interpretation
A = 9 (30%) B = 2 (6.66%) C = 1 (3.33%)
Evaluation Not Subject to Length of Interpretation
D = 18 (60%)
Source: Compiled by this research
Among type A participants, all of the nine participants suggest the Chinese
interpretation from French is superior to that from Japanese. (see Figure 4.15)
60%
30%
30%
3.33%
6.66%
Prefer Translation from French
CB
D A
Source: Compiled by this research
Figure 4.15 Preference of Interpretation---Type A Participants
Among type B participants, two incorrectly identify the length of
interpretation. One of them prefers the interpretation from French, and the
other one prefers that from Japanese. (see Figure 4.16 for detailed breakdown)
30%
3.33%
3.33%
6.66%
3.33%
60%
Source: Compiled by this research
Figure 4.16 Preference of Interpretation---Type B Participants
Prefer Translation from Japanese Prefer Translation from French
D
C A
B
the
g type D participants, nine out of the 18 participants correctly identify
verall, in Group Three, 18 participants correctly identify the length of
inter
length of interpretation, indicates the interpretation from Japanese is
preferred.
Amon
the length of interpretation while the other nine fail to do so. (see Figure 4.17 for
detailed breakdown)
30%
30%
30%
60%
6.66%
3.33%
O
pretation, and other 12 fail to do so. (see Figure 4.18 for detailed breakdown)
60%
40%
Incorrectly ID Length of Interpretation
Figure 4.18 Percentage of Correctly ID Length ---Group Three Source: Compiled by this research
Figure 4.17 Percentage of correc Participants Source: Compiled by this research
D B
C
Correctly ID Length
Incorrectly ID Length
Correctly ID Length of Interpretation
A
tly ID Length---Type D
4.3.4 Group Four ---Short Japanese-Long French
In Group Four, ten (33.33%) participants correctly identify the length of
interpretation and indicate that their evaluation is subject to the length of
interpretation, s 33%) incorrectly identify the length of interpretation and
indicate their evaluation is subject to the length of interpretation, no one is unable
to identify the leng %) indicate their evaluation
is not subject to the length of interpretation. (see Table 4.6 for detailed
breakdown)
Table 4.6 Result of Group Four even (23.
th of interpretation, and 13 (43.33
Correctly ID
Length of Interpretation
Incorrectly ID Length of Interpretation
Unable to ID Length of Interpretation
Evaluation
Subject to Length of Interpretatio
A = 10 (33.33%) B = 7 (23.33%) C = 0 n
Evaluation Not S
of
ubject to Length Translation
D = 13 (43.33%)
Source: Compiled by this research
Among
interpretation from
type A en of
F . (see
participants, sev the participants prefer the Chinese
rench, and the other three prefer that from Japanese
0% 10%
23%
33.33%
23.33%
33%
Among type B p , e of them prefer tation
from French, and the other two prefer that anese. (see Figure 4.20 for
detailed breakdown)
Among type D participants, eleven out of the 13 participants are able to
43.
articipants fiv the Chinese interpre
from Jap
0% 17%
7%
43.33%
23.33%
33.33%
D A
B
Prefer Translation from Japanese
Prefer Translation from French
D
B C A
Prefer Translation
Prefer Translation from Japanese
C
from French
10.33%
Figure 4.19 Preference of Interpretation---Type A Participants Source: Compiled by this research
Figure 4.20 Preference of Interpretation ---Type B Participants Source: Compiled by this research
correctly identify the length of interpretation, and the other two fail to do so. (see
Figure 4.21 for the detailed breakdown)
0%
0%
0%
0%
0%0%
7%
37%
33.33%
23.33%
Overall in Group Four, 21 participants correctly identify the length of
interpretation, and the other nine fail. (see Figure 4.22 for the detailed breakdown)
43.33
%
30%
70%
ID Length Incorrectly
B C
Correctly ID Length
D A
Incorrectly ID Length
ID Length Correctly
6.33%
Figure 4.21 Percentage of Correctly ID Length ---Type D Participants Source: Compiled by this research
Figure 4.22 Overall Percentage of Correctly ID Length Source: Compiled by this research