國立臺灣大學醫學院暨工學院醫學工程學研究所 博士論文
Graduate Institute of Biomedical Engineering College of Medicine and College of Engineering
National Taiwan University Doctoral Dissertation
奈米碳管結合低電壓電穿孔之藥物釋放平台於癌症治 療應用
Combining the Single-Walled Carbon Nanotubes with Low Voltage Electrical Stimulation for Effective Cancer
Therapy
李佩芝 Pei-Chi Lee
指導教授:謝銘鈞 博士 Advisor: Ming-Jium Shieh, Ph.D.
中華民國 105 年 6 月
June 2016
誌誌 誌誌謝謝謝 謝
感謝指導教授謝銘鈞醫師,在研究生涯中給予充分的自由與資源,在適當的時機給 予支持與鼓勵,謝謝您。
感謝口試委員林峯輝老師、林文澧老師、陳三元老師、楊禎明老師、鍾次文老師、
陳文翔醫師、以及賴秉杉老師,在口試時給予珍貴的建議,使研究最後能趨近於完 善。
謝謝郁智與心怡在行政與實驗室大小事物上,都給予充分的幫助,無條件的犧牲與 付出,謝謝你們。
最後,謝謝家人的默默支持與陪伴,沒有這分安定的力量,我是無法完成的。
李佩芝 2016, 7
中文 中文 中文 中文摘要摘要摘要 摘要
本研究將奈米碳管視為奈米電極,分散於細胞外液中,在施予電壓的情況下,
透過奈米碳管良好的導電性以及場致發射能力,可於碳管尖端處放大電場效應,降
低電穿孔(electroporation)所需之電壓,有效刺激細胞膜改變其通透性 (electro-
permeability),令小分子與奈米粒子皆能達到高效能傳輸,大量累積於癌細胞與腫
瘤。在細胞實驗中,我們證明了奈米碳管結合低電壓能在細胞膜上產生可恢復性
(reversible)之孔洞,克服了傳統電穿孔所需之高電壓對細胞所造成不可恢復性
(irreversible)孔洞的導致細胞死亡之障礙,增加細胞存活率並使小分子能有效的傳
遞。在動物實驗中,我們給予老鼠尾靜脈注射奈米碳管電極液後,於腫瘤位置進行
低電壓刺激,有效的增加了血管的通透性,使奈米粒子從血管穿透到癌細胞組織中,
增強高滲透長滯留效應 (enhanced permeability and retention effect)。於癌症治療中,
我們分別使用了光熱治療與化療兩種癌症療法,其結果顯示皆能有效的達到癌細
胞毒殺以及腫瘤抑制之效果。綜合上述,我們證明此藥物傳輸平台不僅可用於傳統 電脈衝化療(electro-chemotherapy),結合奈米碳管的光學性質與熱傳導性,可適用
於多樣化的癌症治療中。
關鍵字 關鍵字 關鍵字
關鍵字::::奈米碳管奈米碳管奈米碳管奈米碳管; 場致發射能力場致發射能力場致發射能力; 電穿孔場致發射能力 電穿孔電穿孔電穿孔; 高滲透長滯留效應高滲透長滯留效應高滲透長滯留效應高滲透長滯留效應; 癌症治療癌症治療癌症治療癌症治療
Abstract
Effective delivery of biomolecules or functional nanoparticles into target sites has
always been the primary objective for cancer therapy. We demonstrated that by
combining single-walled carbon nanotubes (SWNTs) with low-voltage (LV) electrical
stimulation, biomolecule delivery can be effectively enhanced through reversible
electroporation (EP). Clear pore formation in the cell membrane is observed due to LV
(50 V) pulse electrical stimulation amplified by SWNTs. The cell morphology remains
intact and high cell viability is retained. This modality of SWNT + LV pulses can
effectively transfer both small molecules and macromolecules into cells through
reversible EP. This drug delivery system we established could combine with various
cancer treatments, such as phototherapy and chemotherapy. The results of animal studies
also suggest that treatment with LV pulses alone cannot increase vascular permeability in
tumors unless after the injection of SWNTs. The nanoparticles can cross the permeable
vasculature, which enhances their accumulation in the tumor tissue. Therefore, in cancer
treatment, both SWNT + LV pulse treatment followed by the injection of LIPO-DOX®
and SWNT/DOX + LV pulse treatment can increase tumor inhibition and delay tumor
growth. This novel treatment modality applied in a human cancer xenograft model can
provide a safe and effective therapy using various nanomedicines in cancer treatment.
Keywords: cancer therapy; single-walled carbon nanotube; electroporation; tumor;
nanomedicine
Contents 中文摘要中文摘要
中文摘要中文摘要……….……….. I
Abstract ………..……….…………... II
Contents ..………...… IV
List of figures ……….………...…. VI Chapter 1. Introduction……...………...………… 1 Chapter 2. Materials and methods………...……….…… 5 Chapter 3. Results and discussions…..………...……….…… 20 Part I. Enhanced cell electro-permeabilisation combined with phototherapy to kill cancer cells by using single-walled carbon nanotube ……….…… 20
3.1.1 Functionalization and characterization of SWNT-PEG/VNc……….20
3.1.2 Photodynamic and Photothermal Properties of SWNT-PEG/VNc……… 22
3.1.3 Enhanced cellular uptake by the combination of LV pulses with SWNT …….... 24
3.1.4 SWNT-PEG/VNc mediated Electro-Phototherapy efficiently kills cancer cells… 25
Part II. Effect of the LV stimulation on Cell Membrane Poration Enhanced by the
Single-Walled Carbon Nanotubes………..………...…….. 28
3.2.1 SWNTs combined with LV pulses induced cell electropermeabilization …..….. 28
3.2.2 Reversibility of cell electropermeabilization ………. 32
3.2.3. The change of membrane potential in HT-29 cells after EP ………. 34
Part III. Combining the Single-Walled Carbon Nanotubes with Low Voltage Electrical Stimulation to Improve Accumulation of Nanomedicines in Tumor for
Effective Cancer Therapy. ………...… 38
3.3.1. EPR effect improvement by the increased electrical stimulation through SWNTs……….……….……….. 38
3.3.2. In vivo studies of ECT……….….…………. 41
Chapter 4. Conclusions………...……….. 46
Reference ……….………….. 47
Figures ……….….. 58
List of figures
Scheme 1. Synthetic scheme for the fabrication of SWNT/PEG-VNc ….…….….……58 Fig 1. Elemental analysis of SWNT and oxidized SWNT .………...…….…… 59
Fig. 2. (A)Difference in fluorescence emission after mixing THA stock solution with raw
SWNT or oxidized SWNT. (B) Fluorescent spectra of THA in the presence of raw SWNT
and oxidized SWNT ………..……….… 60
Fig. 3. Zeta potential distribution of SWNT-COOH and SWNT-PEG were analyzed by
DLS. …….………..……….………... 61
Fig. 4. 1H-NMR spectrum of SWNT-PEG. The arrow indicates the characteristic peak of PEG at approximately 3.5 ppm .…….……….…... 62
Fig. 5. (A) VNc suspended in water, DMF and DMSO. (B) SWNT-PEG/VNc suspended
in water .………..……….……….…….. 63
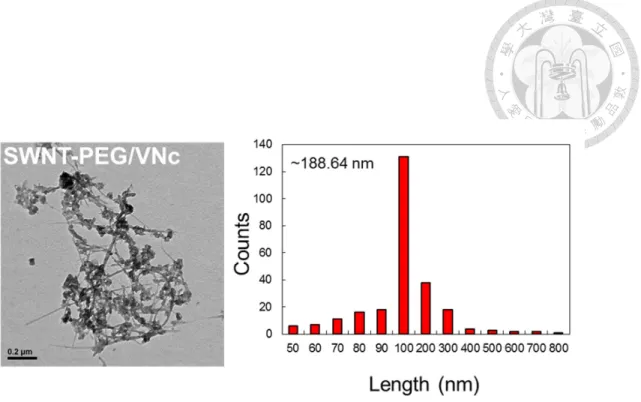
Fig. 6. TEM image of SWNT-PEG/VNc. The length of SWNT-PEG/VNc deduced from
TEM image was approximately 188.64 nm .……….…….. 64
Fig. 7. HRTEM of SWNT-PEG and SWNT-PEG/VNc.……….….…... 65 Fig. 8. Representative EDX spectra of SWNT-PEG/VNc ……….….……... 66 Fig. 9. X-ray diffraction analysis of SWNT, SWNT-PEG/VNc and VNc ……...…….. 67 Fig. 10. UV-visible absorbance spectra of VNc (blue), SWNT-PEG/VNc (red), and SWNT-PEG (black) ………..…….. 68
Fig. 11. Singlet oxygen generation of VNc in DMSO by Singlet Oxygen Sensor Green
reagent. The sample was exposed to irradiation (808 nm) for 1O2 generation …………69
Fig. 12. The thermal curves and of PBS and VNc (1, 2, 5 µg/ml in DMSO) under 808 nm
laser irradiation at 1.3 W/cm2 for 5 min ……….. 70
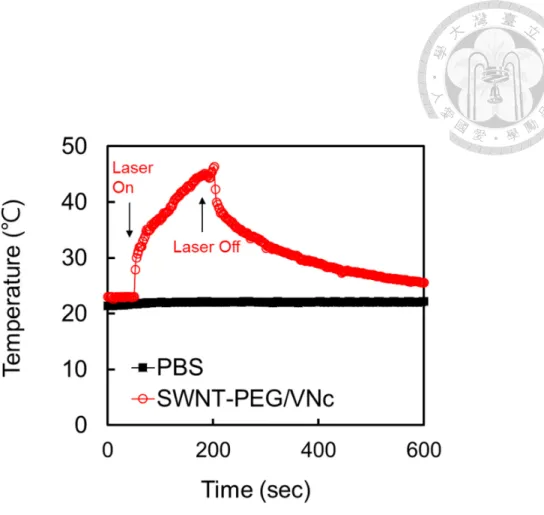
Fig. 13. The thermal curves and of PBS and SWNT-PEG/VNc under 808 nm laser irradiation at 1.3 W/cm2 for 3 min ……….…….. 71
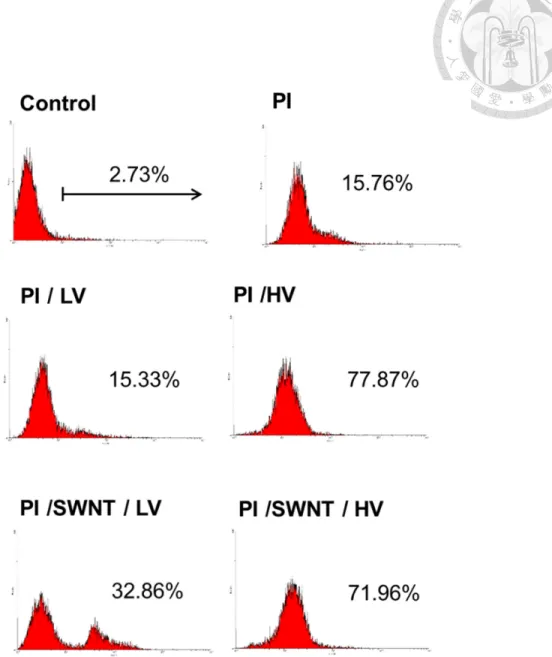
Fig. 14. PI signals of HT-29 cells detected by flow cytometry. We used pulsing buffer
with (PI/SWNT/LV and PI/SWNT/HV group) or without SWNT (PI/HV and PI/LV group)
during the pulsation ………..……….. 72
Fig. 15. The data of histogram correspond to (Fig. 14) ……….. 73 Fig. 16. The cellular uptake of SWNT-PEG/VNc treated to HT-29 cells. (A) No EP group.
(B) EP group. HV (1600 V, 10 ms, 3 pulses); LV (50 V, 40 ms, 100 pulses) …...…….. 74
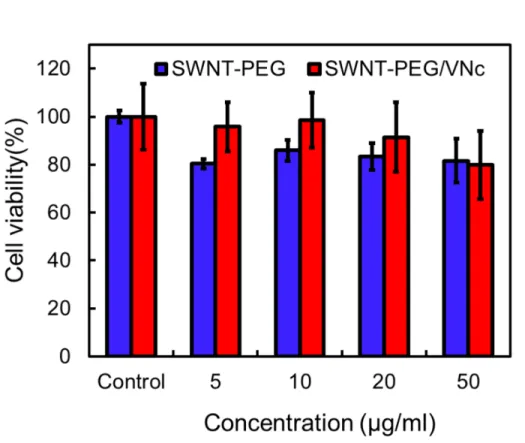
Fig. 17. Cell viability of HT-29 cells treated with SWNT-PEG and SWNT-PEG/VNc for
24 h ………. 75
Fig. 18. Apoptosis and necrosis assay of the cells detected by fluorescence microscopy
after incubation with SWNT-PEG and SWNT-PEG/VNc for 24 h with laser irradiation.
(scale bar = 100 µm) ………... 76
Fig. 19. Cell viability of HT-29 cells after incubation with SWNT-PEG and SWNT- PEG/VNc for 24 h with or without laser irradiation ……….…….. 77
Fig. 20. The comparison of cell viability of HT-29 cells under different treatment .…. 78
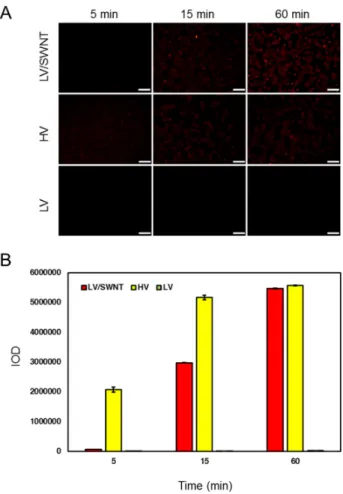
Fig. 21. (A) Pulsing buffer with (LV/SWNT group) or without (HV and LV group) SWNT during the pulsation. The fluorescence of the PI signal expression of HT-29 cells
at 5, 15, and 60 min after transfecting with PI dye under HV (1600 V, 10 ms, 3 pulses)
and LV (50 V, 40 ms, 100 pulses) electro-pulses (scale bar = 100 µm). (B) The integrated
optical density (IOD) of the PI signal expression from the fluorescence image (A) .…79
Fig. 22. Fluorescence micrographs captured from movie at 40 min of HV and LV/SWNT
groups after being transfected with the PI dye (Gray scale) (scale bar = 25 µm) .…….. 80
Fig. 23. Concept of electric stimulation enhancement by CNTs. After giving the LV pulses, the electric stimulation is amplified by CNTs at their tips so that the cell
electropermeabilization could occur, and the delivery efficiency of biomolecules could
be enhanced ………...……..81
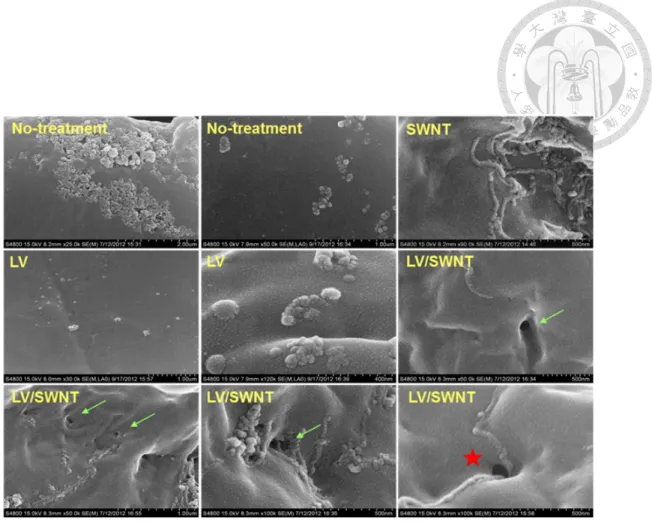
Fig. 24. High magnification of field emission electron micrographs in the near-membrane
region following in vitro cellular exposure to no-treatment, LV, and LV combined with
SWNT pulsing buffer. Green arrows demonstrated SWNT-like structures around the pore
in the surface of the cell membrane. The red star indicated the SWNT-like structures
appearing proximal in the pore .……..………...…...…...…...…...………. 82
Fig. 25. (A) TEM image of SWNT-PEG6k. High magnification of the TEM images
showed that the diameter of SWNT-PEG6k was approximately 20 nm. (B) Size
distribution of SWNT-PEG6k was deduced from (B). The length of SWNT-PEG6k was
approximately 187.36 nm. ……….. 83
Fig. 26. Cell viability after treatment with different intensities of electrical stimulations.
The HT-29 cells were transfected with the PI dye under HV (1600 V, 10 ms, 3 pulses)
and LV (50 V, 40 ms, 100 pulses) pulses. At 24 h after EP, the cell viability was assessed
by staining with calcein AM. (SWNT pulsing buffer = LV/SWNT group, pulsing buffer
without SWNT = HV and LV group). Live cells appeared to be green (calcein AM),
cellular uptake with PI appeared to be red, and the merged images appeared to be yellow
(scale bar = 50 µm) . ……….. 84
Fig. 27. Apoptosis and necrosis assay of the cells detected by flow cytometry after
different EP conditions (Control; 50 V, 40 ms, 100 pulses; 100 V, 40 ms, 50 pulses; 50
V, 40 ms, 10 pulses; 700 V, 20 ms, 3 pulses; 1300 V, 20 ms, 3 pulses; 1600 V, 10 ms, 3
pulses) .……….….. 85
Fig. 28. The data of histogram correspond to (B). The results showed the obvious
escalation of necrotic cells when the applied voltage was increased. ……….….. 86
Fig. 29. Cell viability of HT-29 cells exposed to LV (50 V, 40 ms, 100 pulses) and HV (1600 V, 10 ms, 3 pulses) pulses by using SWNT pulsing buffer and commercial T-
buffer®.……….……... 87
Fig. 30. Investigation of cell morphology. (A) The SEM images showed the cells
following fixation immediately after receiving LV (50 V, 40 ms, 100 pulses) and HV
(1600 V, 10 ms, 3 pulses) electric stimulation (SWNT pulsing buffer = LV/SWNT group,
pulsing buffer without SWNT = HV and LV group)..………. 88
Fig. 31. Dot plot representations of flow cytometry data showed the cell size and
granularity after the same EP condition from Fig. 30..……….….. 89
Fig. 32. Dot plot data from flow cytometry showing the morphology change of cells after
different EP conditions. Compared to the control (no EP) group, the cells treated by HV
(1300V * 20 ms * 3 pulses and 1600 V * 10 ms * 3 pulses) stimulation revealed that the
cell size (FSC-H) decreased while the cell granularity (SSC-H) increased .………….. 90
Fig. 33. The SEM images showed the cells following fixation at 0, 5, 15, and 60 min after
receiving HV (1600 V, 10 ms, 3 pulses) electric stimulation ………..…….. 91
Fig. 34. Scanning electron microscope images of the cells. Cell membrane appearances
at 1 and 60 min after exposing to LV/SWNT electrical stimulation. Pores were easily
identified within the surface of cells at 1 min after EP. However, the pore numbers were
decreased at 60 min after EP. Green arrows showed the pores distributed numerously on
the cell membrane ………..………. 92
Fig. 35. Investigation of the transmembrane potential of HT-29 cells by the membrane potential probe. (A) Fluorescence images showed DIOC6-highlighted changes in the
membrane potential immediately after EP. White arrows showed the decrease in
fluorescence intensity (scale bar = 50 µm) ……….. 93
Fig. 36. Flow cytometry of HT-29 cells. Conditions were the same as in Fig. 35 ……..94 Fig. 37. Membrane potential monitored by JC-1 dye at 5, 30, 60, and 120 min after EP.
The results showed the same fields of view of cells, before and after electro-pulsation.
The loss of orange J-aggregate fluorescence and cytoplasmic diffusion of green monomer
fluorescence occurred after the exposure of electro-stimulation in the HV and LV/SWNT
groups (scale bar = 50 µm). ………95
Fig. 38. HT-29 cells transfected with minicircle DNA encoding GFP by using transfection
reagent or exposing to LV (50 V, 40 ms, 100 pulses) and HV (1600 V, 10 ms, 3 pulses)
pulses. Histogram data analysis by flow cytometry showed the fluorescence intensity of
GFP expressed in HT-29 cells at 48 h after transfection (SWNT pulsing buffer =
LV/SWNT group, pulsing buffer without SWNT = HV and LV group). ……….…….. 96
Fig. 39. PI dye transferred into cells at 3 h after EP. Fluorescence images: Lysotracker
(green), PI (red), and Merge (yellow). High magnification showing the different modes
of entrance of PI for HV compared with the LV/SWNT group (Scale bar = 100 µm) …...97
Fig. 40. EPR effect enhancement following low-intensity electric stimulation enlarged due to CNTs. The accumulation of nanoparticles in the tumor tissue occurred due to not
only the original intercellular space between the endothelial cells but also the tumor
vascular permeability increased by the electric stimulation effect. ………. 98
Fig. 41. (A) In vivo IVIS images of the mice bearing HT-29 tumors at 1, 24, and 96 h
after injection with nanoparticles, respectively. Accumulation of nanoparticles in the
tumors was different between the different EP conditions. The treatment methods
demonstrated are from (A) (HV = 700 V, 20 ms, 3 pulses, LV = 50 V, 40 ms, 10 pulses).
(B) Ex vivo imaging of nanoparticles in the heart, liver, spleen, lung, kidney, and tumor
of mice at 96 h after the same treatments as in (A). ………. 99
Fig. 42. Comparison of the tumor surface (right side tumor) after treating with different
EP conditions. The mice with the SWNT post-injection treated with LV pulse stimulation
(LV/SWNT) showed no harmful effect of the tumor. However, an obvious ablation was
observed on the tumor treated with HV pulses (HV). (The red arrow indicated the tumor
treated by HV after 1 h with severe blood stasis). ………..100
Fig. 43. Different regions of tumors were imaged using fluorescence microscopy for 10
min post-injection. Nanoparticles (red), tumor cells (Hoechst, blue). (Scale bar = 100
µm). ………...101
Fig. 44. (A) Typical intravital micrograph of tumors treated without electro-stimulation after injecting nanoparticles. The nanoparticles were completely filled inside the tumor
vessels at 10 min after injection. At 60 min, the nanoparticles aggregated along the tumor
vessels without obvious appearance in the tumor tissue. Tumor cells (blue), blood vessels
(green), and nanoparticles (red) (scale bar = 100 µm). (B) Tumor treated with LV pulses
after SWNT injection, followed by intravenous administration of nanoparticles. White
arrows indicated the leakage of nanoparticles into the tumor interstitial tissue at 60 min
after EP. Tumor cells (blue), blood vessels (green), and nanoparticles (red) (scale bar =
100 µm). ………102
Fig. 45. Comparison of LV/SWNT with LV groups by enhancement of nanoparticle accumulation. Tumor sections were extracted at 3 h after administering nanoparticle
injection. (A) The tumor treated with SWNT post-injection showed an apparent
aggregation of nanoparticles in the tumor region. Nanoparticles (red), tumor cell (Hoechst,
blue). (Scale bar = 50 µm). (B) The tumor treated without SWNT showed less aggregation
of nanoparticles compared to (A). Nanoparticles (red), tumor cell (Hoechst, blue). (Scale
bar = 50 µm). ……….103
Fig. 46. SWNT-PEG was loaded with doxorubicin non-covalently by π-π stacking.…104 Fig. 47. Particle size and zeta potential analyses of SWNT-COOH, SWNT-PEG, and
SWNT/DOX by DLS. SWNT with much more modification showed a larger size. Zeta
potentials of the SWNT showed that SWNT-PEG had negative charges. Loading DOX
increased the zeta potentials of SWNT-PEG. ………105
Fig. 48. UV-visible absorbance spectra of SWNT/DOX (blue), DOX (red), and SWNT-
PEG (black). The drug loading efficiency was 56.4%.……….. 106
Fig. 49. SWNT combined with LV pulses for improving the tumor therapy efficacy by
nanomedicine. Schematic representation of ECT in a HT-29 human colon cancer
xenograft model. ……….……….. 107
Fig. 50. Body weights of all the groups showed no notable changes. ……….………... 108
Fig. 51. Tumor volume ratio of HT-29-bearing mice among the various groups. Animals
that received a combination of pulses and nanomedicine showed significant tumor growth
suppression (SWNT/DOX + EP vs SWNT/DOX, *p < 0.05; SWNT + EP + LIPO-DOX
vs LIPO-DOX, *p < 0.05). ………..….. 109
Fig. 52. Photographs of dissected tumors. Measurement of tumor weight for each group
after 36 days. The effective EP combined with nanomedicine revealed a high reduction
in the tumor weights (SWNT/DOX + EP vs SWNT/DOX, **p < 0.01; SWNT+ EP +
LIPO-DOX vs LIPO-DOX, *p < 0.05). ……. ……….…..110
Fig. 53. Hematoxylin and eosin (H&E) staining of organs of HT-29 tumor xenograft–
bearing mice treated with PBS (control), LIPO-DOX, SWNT/DOX, and SWNT + EP +
LIPO-DOX. Scale bar = 50 μm. ……. ……….. 111
Fig. 54. H&E-stained images revealed severe damage in the tumor tissues of SWNT/DOX + EP and SWNT + EP + LIPO-DOX groups. No notable damage was
observed in the PBS and SWNT + EP groups. Scale bar = 50 μm and 25
μm. ………..…..112
Fig. 55. Photograph of SWNT-PEG and SWNT/DOX suspended in PBS lasting for a
month. The solutions were stored at 4°C. ……….. 113
Fig. 56. Images of livers extracted from mice at 1 and 8 weeks after injecting with PBS
(control), SWNT, and SWNT/DOX. ………...….. 114
Fig. 57. Hematoxylin and eosin (H&E)–stained images of livers extracted from mice
injected at 1, 6, and 8 weeks after injecting with PBS (control), SWNT, and SWNT/DOX.
Black arrows showed the aggregation of SWNT/DOX. Scale bar = 50
μm. ………..…..115
Chapter 1. Introduction
Nanoparticles were introduced to biomedical engineering more than a decade ago,
particularly for tumor drug delivery [1–4]. Owing to the enhanced permeability and
retention (EPR) effect, nanovectors could carry the antitumor reagent to the blood vessels
in the tumor and possibly leak into the tumor tissue through the intercellular space
between the endothelial cells [3–5]. Although the antitumor drug could reach the target
region because of the accumulation of nanoparticles in the tumor, the concentration of the
drug in the tumor tissue remains poor because of the size of nanoparticles and their
circulation time [6]. In this study, we propose an improvement in the EPR effect by
electrical stimulation.
Electroporation (EP) is an efficient physical method of transporting biomolecules or
nanoparticles into the cells because of its local electric field at the target tissue [7–9].
Application of a strong electrical stimulation results in an increased transmembrane
potential that could in turn result in the formation of pores in the cell membrane. These
reversible pores could last for a specific time, during which the cells could be repaired
[10], and the biomolecules could diffuse or drift by the strong electrophoretic force into
the target region [11,12]. Due to its effective transfection ability in the treatment of
various types of tumors, this method is commonly used for cancer therapies including
gene therapy and targeted electrochemotherapy (ECT) [13–22].
Clinical trials using ECT have been approved since the 1990s [23]. During the past
few decades, this technology was greatly improved owing to its high efficiency to deliver
chemical therapeutics or small molecules into the tumors. Among these anticancer drugs,
bleomycin, cisplatin, and doxorubicin are promising drugs that can be applied in
combination with EP [24]. These anticancer agents can be administered by intravenous
(IV) or intratumoral injections and usually have a dosage limitation because of the high
biotoxicity. Therefore, it is very important to note the adverse effects caused by these
drugs, including pulmonary fibrosis, nephrotoxicity, and neurotoxicity [25,26]. Using EP
could effectively lower the dosage and decrease the side effects. Moreover, the
incorporation of a nanovector could overcome the limitation of the anticancer agent’s
poor solubility in aqueous solutions. However, effective EP usually requires high voltages
(HVs), which could result in irreversible EP and tissue ablation [27,28]. Here, we report
the application of a single-walled carbon nanotube (SWNT) pulsing buffer, which can be
combined with low external static electric fields. Using this method, the delivery of
nanoparticles could be effectively enhanced by reversible EP. Moreover, the conventional
ECT limitation could be overcome.
Considering their unique physical properties, carbon nanotubes (CNTs) have various
applications in biomedical nanotechnology including photothermal therapy, near infrared
imaging, and photoacoustic imaging [29–35]. However, there remains few applications
for the field emission capability of CNTs that can be applied in biomedical research,
particularly in tumor models. Due to the high aspect ratio of CNTs, they are capable of
enhancing the electric field at their tips and creating localized high-field regions [36–38].
This well-known phenomenon has been broadly used in field emission applications in
which CNTs act as an electron field emitter [39]. Moreover, in vitro
electropermeabilization studies, which are based on CNTs, have revealed that they could
amplify the external electric field, thereby inducing pore formation in the cell membrane
[40–43]. When the cells were exposed to electric field inside the microfluid chip
embedded with CNTs, it led to leakage of the intracellular components, and a low voltage
(LV) was sufficient for the electrical stimulation [42]. Wang et al demonstrated that the
MWNT-enhanced EP effect via significantly lower electric fields had the potential for
tumor cell ablation in vitro [43].
In the present study, we employed SWNTs as nanoelectrodes dispersed in the
pulsing buffer around the cellular environment during electro-stimulation in order to
lower the EP voltages and reduce cell mortality. Using an animal model, we also
demonstrated that this method enhanced the EPR effect, thereby improving the delivery
of nanoparticles that permeate from the blood vessel to the tumor tissue. Moreover, we
presented evidence that SWNTs and liposomal nanovector with doxorubicin
(SWNT/DOX and LIPO-DOX®) can be used as nanomedicines with SWNT + EP, which
showed improvement in tumor inhibition as compared with nanomedicines alone. These
results suggest that the new modality can be applied to various types of nanomedicines to
improve antitumor therapy efficacy.
Chapter 2. Materials and methods
Part I
Oxidative Shortening of SWNT
Raw SWNT was purchased from Golden Innovation Business Co., Ltd (Taipei,
Taiwan). SWNT ws oxidized by exposure to a strong acid solution (H2SO4: HNO3 = 3:1)
for 24 h. After purification, oxSWNT was refluxed in 4 M HNO3 at 80°C for 48 h to
shorten the length. After washing, the resultant suspension was then diluted with 250 mL
of water, and the oxSWNT was collected on a 100-nm pore membrane filter (Millipore)
and washed with deionized water. The obtained oxSWNT was further resuspended in
water and centrifuged at 4000 ×g for 30 min to remove the residuals. The collected
oxSWNT was lyophilized to dryness at room temperature.
oxSWNT-PEG
The oxSWNT was dissolved in phosphate-buffered saline (PBS) (pH = 7.2) and
sonicated for 30 min. 1-Ethyl-3-(3-dimethylaminopropyl) carbodiimide hydrochloride
(Sigma-Aldrich) and sulfo-NHS (N-hydroxysulfosuccinimide) (Sigma-Aldrich) were
added to the SWNT solution and stirred at room temperature for 1 h. This was followed
by treatment with poly (ethylene glycol) bis (3-aminopropyl) terminated (MW = 6000)
(Sigma-Aldrich) for 72 h with stirring at room temperature. Unboned excess materials
were removed by filter tubes (100 kDa AmiconYM-50, Millipore), centrifuged at 4000
rpm for 30 min, and washed thoroughly with water.
oxSWNT-PEG/VNc
oxSWNT-PEG (10mg) was dissolved in DMF and sonicated for 1 h. The VNc was
added and the resulting blackish green solution was further sonicated for 30 min. This
was followed by room temperature stirring for 48 h. The solid was washed with ethanol
with repeated centrifugation until the solution was free of any green color. The resulting
oxSWNT-PEG/VNc was freeze-dried.
Characterization.
The O amount of oxSWNT was eveluaed by Element ANALYZER (Thermo Flash
2000). Size distribution was deduced by TEM (Hitachi H-7650) images. High-
magnification images of SWNT were obtained from FEG-TEM (Philips Tecnai F30 Field
Emission Gun Transmission Microscope). The difference of zeta potential between
oxSWNT and SWNT-PEG was measured by Zetasizer (Malvern-zetasizer 3000hs,
Malvern, UK). To identify the phase structure of the SWNT-PEG/VNc, the dry sample
powder was observed by an X-ray powder diffraction instrument (PANalytical; X' Pert
PRO) with CuKα radiation (40 mV, 40kV). Scanning angle was observed from 15° to 70°
(step size = 0.02°). The covalent interactions between PEG and SWNT were evaluated
by 1H-NMR spectroscopy. The SWNT-PEG was thoroughly suspended in D2O. The
characteristic peak of 5 ppm was the D2O solvent peak and 3.4 – 3.6 ppm were attributed
to the PEG. Thermal decomposition temperature was measured by thermogravimetric
analysis (TGA) (TA Instrument 5100-Dynamic Q500) in air or N2 atmosphere (room
temperature to 800°C, 10°C/min). For the diffraction pattern analysis, SWNT-PEG/VNc
was observed by HRTEM/EDS (Philips/FEI Tecnai 20 G2 S-Twin Transmission Electron
Microscope including EDX Spectroscopy, CCD Camera with Diffpack program).
Spectrochemical titration
An ethanolic solution of THA was added to small amount (2 mg) of SWNT, and the
mixture is allowed to stir at room temperature for 1 h [63]. After centrifugation SWNT
have been removed and the solution filtered on a 0.45 μm pore filter. The absorbance
intensity (590 nm) was determined by a micro-plate reader (Gemini EM; Molecular
Devices, Germany).
Singlet oxygen production of VNc
To measure the production of 1O2 by VNc, the sensing probe singlet oxygen sensor
green (Molecular Probes Inc., Leiden, The Netherlands) was used. In brief, singlet oxygen
sensor green and VNc (5 ug/ml) were dissolved in DMSO in 96 well. The corresponding
well were treated with irradiation (808 nm, 340 mW) for 30, 60, 90, 120 s. The
fluorescence intensity was determined by a micro-plate reader (Gemini EM; Molecular
Devices, Germany) excitation/emission of 488/524 nm.
Photothermal Effects.
SWNT-PEG/VNc dispersion (PBS) in 96 well were irradiated at the top surface for
3 min with 808 nm (power, 1.3 W) diode laser. VNc dispersion (DMSO) in 96 well were
irradiated at the top surface for 5 min with 808 nm (power, 1.3 W) diode laser.
Temperature was measured by a thermocouple thermometer.
Cell culture
HT-29 cells (human colon adenocarcinoma cell lines) were obtained from the
American Type Culture Collection (ATCC). Cells were routinely cultured in flasks
containing Dulbecco’s Modified Eagle’s medium (DMEM, Invitrogen) supplemented
with 10% fetal bovine serum (FBS, Invitrogen), 100 U/ml penicillin, and 100 µg/ml
streptomycin (Invitrogen). Cells were incubated at 37°C in a humidified atmosphere with
5% CO2.
Propidium iodide dye delivery
For cell permeabilization in 100 µl of pulsing buffer, HT-29 cells were trypsinized,
centrifuged for 5 min at 1500 rpm, and resuspended in buffer T® or SWNT buffer (106
cells/ml) mixed with propidium iodide (PI, 0.5 µg/ml). After EP, the cells were seeded
into 24-well plates. Cells with pore formation were identified by the cellular uptake of
the PI dye with flow cytometry. The EP parameters were LV (100 pulses at 50 V, pulse
duration = 40 ms) and HV (3 pulses at 1600 V, pulse duration = 10 ms).
Cellular uptake of SWNT-PEG/VNc
For cell permeabilization in 100 µl of pulsing buffer, HT-29 cells were trypsinized,
centrifuged for 5 min at 1500 rpm, and resuspended in SWNT-PEG/VNc (VNc, 2 and 5
µg/ml). After EP, the cells were seeded into 24-well plates. The cellular uptake of the
SWNT-PEG/VNc was evaluated with flow cytometry. The EP parameters were LV (100
pulses at 50 V, pulse duration = 40 ms) and HV (3 pulses at 1600 V, pulse duration = 10
ms).
MTT assay
HT-29 cells were first seeded onto 96-well plates at a density of 8000 cells per well
and cultured. After 24 h, cells were incubated in media containing with VNc(0.1- 50
ug/ml)for 24 h. Cell viability was determined using an MTT assay and a scanning multi-
well ELISA reader (Microplate Readers Sunrise, TECAN Group ltd, Switzerland). The
fraction of live cells was calculated by dividing the mean optical density obtained from
treated cells by the mean optical density from untreated control cells.
Trypan blue assay (Dye exclusion assay)
HT-29 cells were seeded onto 24-well plates at a density of 5×10⁴ cells per well and
incubated for 24 h. After 24 h, cells were incubated in media containing with SWNT-PEG
(1, 5, 10, 20 and 50 ug/ml) and SWNT-PEG/VNc (1, 5, 10, 20 and 50 ug/ml). After 24 h ,
the cells were washed by PBS twice and trypsinized. 10 µl of cell suspension was simply
mixed with 10µl of trypan-blue dye. The cell sample solution was loaded into
hemacytometer then visually examined to determine whether cells take up or exclude dye.
Phototherapy in vitro
HT-29 cells were seeded onto 24-well plates at a density of 5×10⁴ cells per well and
incubated for 24 h. After 24 h, cells were incubated in media containing with SWNT-PEG
(20 ug/ml) and SWNT-PEG/VNc (SWNT 20 ug/ml and VNc 2 ug/ml) for 24 h. After
incubation, the cell changed with fresh medium and laser with a wavelength of 808 nm
(1.3 W) was used to irradiate the cells for 3 min. After irradiation, we incubated the cells
for 24 h. The cell viability was estimated by using a trypan blue assay. Besides, the cells
were also stained with FITC Annexin V/Dead Cell Apoptosis Kit (Invitrogen) to evaluate
the mortality attributed to phototherapy. All the results were collected by flow cytometry.
Electro- Phototherapy in vitro
For cell permeabilization in 100 µl of pulsing buffer, HT-29 cells were trypsinized,
centrifuged for 5 min at 1500 rpm, and resuspended in SWNT-PEG/VNc (VNc, 2, 5
µg/ml). After EP, the cells were seeded into 24-well plates. After incubation, the cell
changed with fresh medium and laser with a wavelength of 808 nm (1.3 W) was used to
irradiate the cells for 3 min. After irradiation, we incubated the cells for 24 h. The cell
viability was estimated by using a trypan blue assay.
Part II-III
Preparation of SWNT pulsing buffer
Raw SWNTs were purchased from Golden Innovation Business Co., Ltd (Taipei,
Taiwan). SWNTs were oxidized by exposure to a strong acid solution (H2SO4: HNO3 =
3:1) for 24 h. After purification, oxSWNTs were refluxed in 4 M HNO3 at 80°C for 48 h
to shorten the length. After washing, the resultant suspension was then diluted with 250
mL of water, and the oxSWNTs were collected on a 100-nm pore membrane filter
(Millipore) and washed with deionized water. The obtained oxSWNTs were further
resuspended in water and centrifuged at 4000 ×g for 30 min to remove the residuals. The
collected oxSWNTs were lyophilized to dryness at room temperature. The resulting
particles were dissolved in phosphate-buffered saline (PBS) (pH = 7.2) and sonicated for
30 min. 1-Ethyl-3-(3-dimethylaminopropyl) carbodiimide hydrochloride (Sigma-Aldrich)
and sulfo-NHS (N-hydroxysulfosuccinimide) (Sigma-Aldrich) were added to the SWNTs
and stirred at room temperature for 1 h. This was followed by treatment with poly
(ethylene glycol) bis (3-aminopropyl) terminated (MW = 6000) (Sigma-Aldrich) for 72 h
with stirring at room temperature. Unboned excess materials were removed by filter tubes
(100 kDa AmiconYM-50, Millipore), centrifuged at 4000 rpm for 30 min, and washed
thoroughly with water. Next, the SWNT-PEG6k (20 µg/ml) was suspended in PBS with
0.01% Pluronic F127 (Sigma-Aldrich) as an SWNT pulsing buffer for cell
electropermeabilization. The size distribution was deduced by TEM (Hitachi H-7650)
images. High-magnification images of SWNTs were obtained from FEG-TEM (Philips
Tecnai F30 Field Emission Gun Transmission Microscope).
DOX loading on PEGylated SWNTs
SWNT-PEG was loaded with doxorubicin non-covalently by π–π stacking and
hydrophobic interactions according to the aromatic structure of DOX [44]. We mixed
DOX with PEGylated SWNTs (weight ratio = 1:10) in PBS (pH = 7.4) overnight.
Unabsorbed excess DOX was removed by filter tubes (100 kDa AmiconYM-50,
Millipore), centrifuged at 4000 rpm for 30 min, and washed thoroughly with water until
the filtrate was no longer red. The formed SWNT/DOX complex was characterized by a
UV-vis spectrophotometer (SpectraMax Microplate Readers, Molecular Devices, USA).
The particle size and zeta potential were analyzed by Zetasizer Nano-ZS90 (Malvern
Instruments Ltd, UK).
EP systems
We used two types of commercial EP systems in our investigation: suspension and
attachment types. Two tests were performed to investigate the repeatability combined
with SWNT pulsing buffer. We used the NeonTM Transfection System (MP-100,
InvitrogenTM, Life Technology) and a NeonTM 100 µl kit (InvitrogenTM, Life Technology)
for the cell-suspended permeabilization. The attachment type used was a BEX
electroporator (Tokiwa Science, Tokyo, Japan) with electrodes (LF650S7, LF647P2X5)
for both the in vitro and in vivo experiments. For all the in vitro experiments, the NeonTM
Transfection System was used, excluding the JC-1 and the real-time event of the EP
experiments.
Propidium iodide dye delivery
HT-29 cells (human colon adenocarcinoma cell lines) were obtained from the
American Type Culture Collection (ATCC). Cells were routinely cultured in flasks
containing Dulbecco’s Modified Eagle’s medium (DMEM, Invitrogen) supplemented
with 10% fetal bovine serum (FBS, Invitrogen), 100 U/ml penicillin, and 100 µg/ml
streptomycin (Invitrogen). Cells were incubated at 37°C in a humidified atmosphere with
5% CO2. For cell permeabilization in 100 µl of pulsing buffer, HT-29 cells were
trypsinized, centrifuged for 5 min at 1500 rpm, and resuspended in buffer T® or SWNT
buffer (106 cells/ml) mixed with propidium iodide (PI, 0.5 µg/ml). At 5, 15, and 60 min
after EP, the cells were seeded into 24-well plates. Cells with pore formation were
identified by the cellular uptake of the PI dye with the subsequent fluorescent signal
immediately. The EP parameters were LV (100 pulses at 50 V, pulse duration = 40 ms)
and HV (3 pulses at 1600 V, pulse duration = 10 ms). The PI signal expression in HT-29
cells was quantified by calculating the integrated optical density (IOD) using the Image
Pro Plus software (Media Cybernetics, Silver Spring, MD).
Real-time observation of cell electropermeabilization
To monitor the real-time event of EP, the cells were seeded into a 6-cm dish. After
24 h, the medium was changed with pulsing buffer mixed with PI. Next, the dish was
placed under a fluorescence microscope (Olympus IX71) using the TRITC channel
(Excitation filter: HQ535, Emission filter: HQ610). Before and after electro-stimulation,
the images were captured (1.53–1.84 image/s) for 40 min by the camera (Olympus U-
CMAD3). The results are demonstrated in Movie S1 and S2.
Cell viability
HT-29 cells were trypsinized, centrifuged for 5 min at 1500 rpm, and resuspended
in buffer T® buffer or SWNT pulsing buffer (106 cells/ml) mixed with 0.5 µg/ml PI. At
60 min after EP, the cells were seeded into plates and changed with the fresh medium.
After 24 h, the cells were stained with Calcien AM (Sigma-Aldrich) to observe the cell
viability. Cells with pore formation were identified by the fluorescent signal of PI.
Apoptosis and necrosis assay
HT-29 cells were trypsinized, centrifuged for 5 min at 1500 rpm, and resuspended
in T® buffer (106 cells/ml). At 24 h after different EP conditions (no treatment, 50 V*40
ms*100 pulses, 100 V*40 ms*50 pulses, 50 V*40 ms*10 pulses, 700 V*20 ms*3 pulses,
1300 V*20 ms*3 pulses, 1600 V*10 ms*3 pulses), the cells were stained with FITC
Annexin V/Dead Cell Apoptosis Kit (Invitrogen) to evaluate the mortality attributed to
EP. All the results were collected by flow cytometry.
SEM
After incubating for 24 h, the cells were trypsinized, centrifuged for 5 min at 1500
rpm, and resuspended in buffer T® or SWNT buffer (107 cells/ ml). At 1, 5, 15, and 60
min after LV and HV stimulation, the cells were fixed in 5% glutaraldehyde immediately
for 2 days at 4°C and then rinsed three times with PBS. The fixed cells were dehydrated
in serial concentrations of ethanol. After critical point drying, according to the
manufacturer’s directions, the cover slips were sputter-coated with gold and viewed by
the field-emission scanning electron microscope (FE-SEM, Hitachi S-4800).
DIOC6 and JC-1 staining
To investigate the membrane potential change after EP, cells were trypsinized and
stained with DIOC6 (5 µg/ml) (Invitrogen) in suspension. After incubating for 15 min at
37°C, the cells were washed and changed with the pulsing buffer. Then, the cells were
treated by stimulation with LV, HV, and LV/SWNT. After EP, cells were seeded back to
the 12-cm wells followed by fluorescence microscopy and observed in FITC channel
(Excitation filter: HQ480, Emission filter: HQ535). In addition, the fluorescence
intensities were detected by flow cytometry (BD, Bioscience). The alterations in the cell
membrane potential were also assessed by JC-1 (Invitrogen). The cells were seeded in a
dish and incubated at 37°C with 5% CO2. After 24 h, the cells were stained with JC-1 (5
µg/ml) for 15 min, followed by washing and then changed with the pulsing buffer. Next,
the cells were treated by stimulation with LV, HV, and LV/SWNT. After EP, cells were
observed at 5, 30, 60, and 120 min in the FITC channel (Excitation filter: HQ480,
Emission filter: HQ535) and TRITC channel (Excitation filter: HQ535, Emission filter:
HQ610).
GFP expression
To evaluate the transfection efficiency, HT-29 cells were transfected with minicircle
DNA encoding GFP protein (CMV-GFP-T2A-Luciferase, SBI). HT-29 cells were seeded
in a 12-well plate. After 24 h, cells were trypsinized and resuspended (107 cells/ ml) in
the pulsing buffer A (SWNT 20 µg/ml and minicircle DNA 10 µg/ml mixed with 0.01%
F127 in PBS) for the LV/SWNT stimulation group and pulsing buffer B (minicircle DNA
1 µg in buffer T®) for the LV and HV stimulation group. After EP, cells were seeded back
to the 12-cm wells. For the transfection reagent group, Lipofactamine® (Invitrogen) was
used and DNA–lipid complex was added to the cells. After 48 h, all the transfected cells
were analyzed by flow cytometry (BD Bioscience).
EP protocol: in vivo study
All the animal experiments were performed using the BEX electroporator. The
animals were kept under isoflurane/air anesthesia for the entire procedure. We used HV
(3 pulses at 700 V, pulse duration = 20 ms) and LV (10 pulses at 50 V, pulse duration =
40 ms) pulses as our EP conditions to evaluate the effect of electro-stimulation in vivo.
IVIS imaging
We examined the ability of SWNT + LV pulses to enhance nanoparticle delivery.
FluoSphere® (Ex.580/Em.605, Molecular probe, Invitrogen) beads, approximately 100
nm in diameter, were used as aqueous suspensions containing 2% solids. The animals
were divided into three groups. In the LV/SWNT group, to evaluate the SWNT effect
combined with LV pulses, SWNT-PEG6k (300 µg/mouse) in PBS with 0.01% Pluronic
F127 was intravenously injected and electropulsation was applied on the right tumor
immediately after the injection of FluoSpheres® (500 µl/mice). The HV and LV group
without SWNT post-injection were administered only the nanoparticle injection. Then,
the mice were imaged using IVIS Lumina II with an excitation wavelength of 570 nm at
1, 24, and 96 h post-injection. Next, various tissues, including the heart, liver, spleen,
lung, kidney, and tumor, were extracted from the mice at 96 h post-injection. Finally, the
tissues were imaged using IVIS Lumina II with an excitation wavelength of 570 nm.
Intravital microscopy
Mice were injected with Hoechst (Sigma-Aldrich, 33258) for labeling the cancer
cells and FITC-dextran (Sigma-Aldrich) for labeling the tumor vessels. The animals were
divided into two groups. In one group, to evaluate the SWNT effect combined with LV,
SWNT-PEG6k (300 µg/mouse) in PBS with 0.01% Pluronic F127 was intravenously
injected and electropulsation was applied on the tumor immediately after the injection of
FluoSphere® (100 µl/mice). The other group lacked of the LV/SWNT stimulation but
followed the same procedure. All the substances were administered by tail vein injection.
The mice were placed on the platform underneath the fluorescence microscope (Olympus
IX71), with the tumor lying on the cover slip next to the objective lens. The tumor cells
were observed by DAPI filter (Excitation filter: D350, Emission filter: D460/50 m). The
tumor vessels were observed by the FITC filter (Excitation filter: HQ480, Emission filter:
HQ535), and the nanoparticles were observed by the TRITC filter (Excitation filter:
HQ535, Emission filter: HQ610/75 m). The real-time images were captured by a camera
(Olympus U-CMAD3) and processed using a software (PictureFrameTM 2.2, Optronics).
Electrochemotherapy by nanomedicine in vivo
Female BALB/c athymic nude mice aged 4–5 weeks were purchased from the
National Laboratory Animal Center (Taipei, Taiwan). All the in vivo studies were
approved by the National Taiwan University College of Medicine and the College of
Public Health Institutional Animal Care and Use Committee (IACUC). HT-29 cells were
subcutaneously injected in the flank of mice (107 cells/mice). When the tumor reached a
mean volume of 100 mm3 (approximately 16 days after the injection), the mice were
randomly divided into PBS, SWNT, SWNT/DOX, LIPO-DOX (TTY Biopharm
Company Limited, Taiwan), SWNT/DOX + EP, and SWNT + EP + LIPO-DOX groups
(n = 5/group). The animals of the SWNT/DOX + EP group were injected with
SWNT/DOX (SWNT 7.14 mg/kg, DOX 4 mg/kg), followed by LV pulses (50 V, 40 ms,
10 pulses) immediately. Animals of the SWNT + EP + LIPO-DOX group were injected
with SWNT (7.14 mg/kg), followed by LV pulses (50 V, 40 ms, 10 pulses) immediately.
Immediately after the pulses, LIPO-DOX (4 mg/kg) was administered. The other groups
were administered only tail vein injections of PBS, SWNT (7.14 mg/kg), SWNT/DOX
(SWNT 7.14 mg/kg, DOX 4 mg/kg), and LIPO-DOX (4 mg/kg) without electro-pulses.
All the injections were IV and all the groups were administered three times at 1, 4, and 8
days. Tumor volumes and body weight were measured twice a week for 36 days. The
tumor sizes were calculated by the formula: volume = length × width2/2. The mice were
sacrificed after 36 days, and the tumors were extracted to weight. Tissues from the tumors
were dissected from the HT-29 tumor-bearing mice at 24 h after treatment and fixed with
4% formaldehyde solution at room temperature for 48 h. Hematoxylin and eosin (H&E)
staining was performed, and the tissues were observed under bright field microscopy
(Olympus).
Statistical analysis
All the data were expressed as mean ± SD. ANOVA was used to determine the
significant differences in tumor volume in multiple groups. The significant difference
between the comparison of EP (+) and EP (-) group was analyzed by the Student’s t-test.
Asterisks * and ** indicate significance with p values of < 0.05 and < 0.01, respectively.
Chapter 3. Results and discussions
Part 1. Enhanced Cell Electro-permeabilisation Combined with Phototherapy to
Kill Cancer Cells by Using Single-walled Carbon Nanotube
In part 1, SWNT showed the promising ability to be a nanoelectrode to enhance the
LV stimulation for using in EP treatment and lead to effective drug delivery. We loaded
near infrared (NIR) dye vanadium naphthalocyanine (VNc, PDT agent) onto SWNT-PEG
(PHT agent) to achieve double photodynamic therapy (PDT) and photohyperthermia
(PHT) cancer phototherapy system. The HT-29 cells could be killed effectively during
the phototherapy after the EP treatment.
3.1.1 Functionalization and characterization of SWNT-PEG/VNc
SWNT-PEG/VNc was prepared according to the process in Scheme 1. Briefly, the
raw SWNT was oxidized by the acid mixture of H2SO4 and HNO3 (1:3 by volume). After
24 h, for shortening the oxSWNT, oxSWNT in HNO3 was reflux under 80°C during 48
h. The short oxSWNT with carboxyl group was covalently binding to the PEG (MW =
6000) via EDC/NHS for 24 h. After purification, the SWNT-PEG and VNc were added
into the DMF and sonicated for 30 min to obtain the well dispersion. After stirring 48 h,
DMF was evaporated, the membrane formed onto the glass bottle. We used DDW water
to dissolve the membrane into the greendish solution. The solution was then dialysis for
a week to obtain the purified SWNT-PEG/VNc. The more detailed process was in the
Materials and Methods section.
In Fig. 1 by the element analyzer, the weight percent of oxygen on the SWNT was
increased from 1.83% to 11.90% after acidic process. The result showed that the carboxyl
groups were successfully generated after acid treatment. The amount of COOH was
quantity by the positive dye THA, which could absorb on the acid site (COO-) of
oxSWNT due to the electrostatic force [63]. When THA mixed with oxSWNT, the
fluorophores were taken up by the oxSWNT and the blue color of solution would
obviously decreased (Fig. 2A). After removing oxSWNT by filtration, residue THA was
calculate by absorbance spectrum, the signal was significantly decreased compared to the
raw SWNT showed the amount of COOH group was 0.24 umol per mg of oxSWNT (Fig.
2B). The surface charge of oxSWNT was -43.1 mV due to the COO- (Fig. 3). After
binding with the PEG, the increased potential (-43.1 mV to -14 mV) of SWNT-PEG
showed the formation of the CONH bond. The covalent bonds between PEG and
oxSWNT were also confirmed by NMR peak at 3.5 ppm indicate attachment of PEG (Fig.
4).
Next, we used NIR dye VNc as our photosensitizer. VNc was hydrophobic and had
the well dispersion in the solvent such as DMSO or DMF (Fig. 5A). After attaching to
SWNT-PEG, SWNT-PEG/VNc had well suspension in water (Fig. 5B). The length of
SWNT-PEG /VNc approached to ~188.64 nm was calculated from the TEM image (Fig.
6). The structure images of SWNT-PEG and SWNT-PEG/VNc were obtained from the
high resolution TEM (Fig.7). Compared to the image of SWNT-PEG, SWNT-PEG/VNc
showed the aggregation of VNc molecules attached to the SWNT-PEG surface.
Furthermore, to investigate the relation of VNc with SWNT-PEG, the aggregation
on the SWNT-PEG/VNc was investigated by the energy-dispersive x-ray (EDX)
spectrometer. The EDX elemental spectrum images indicated that C, N, O and V were
present throughout the entire aggregation. The peaks corresponding to C (0.27 eV), N
(0.39 eV), O (0.52 eV), and V (4.94 eV) were visible (Fig. 8). The C, N, O atoms could
from SWNT, PEG and VNc, but the V atom was only from the VNc. The result confirmed
that VNc was attached with SWNT. We also used X-ray diffraction (XRD) analysis of
dried SWNT, SWNT-PEG/VNc and VNc. There showed the peak from the SWNT at 25
angle, but there was no peak from the VNc crystalline either SWNT-PEG/VNc (Fig. 9).
3.1.2 Photodynamic and Photothermal Properties of SWNT-PEG/VNc
Absorption spectrum of the aqueous solution of SWNT-PEG/VNc showed
absorption peak at 808 nm, which were characteristic of VNc. The data also indicated the
VNc remained properties absorb the NIR at 808 nm (Fig. 10). The amount of attached
VNc calculated from absorption spectrum was 10%. To test properties of VNc as an agent
for photodynamic therapy (PDT), production of singlet oxygen (1O2) was evaluated. After
treatment with laser diode (808 nm), the result of Singlet Oxygen Sensor Green to 1O2,
which was induced by photochemical reaction of the VNc plus light in DMSO solution
(Fig.11). The fluorescence intensity of Singlet Oxygen Sensor Green increased
significantly in VNc with the increasing time. (Fig. 11). Thus, VNc within the developed
SWNT nanoparticles is capable of an efficient 1O2 generation to act as a PDT agent. The
previous studies have demonstrated that VNc is a suitable photosensitizer because of its
high quantum yield. Olena et al showed that the quantum yield of SiNc-loaded
nanoparticles (ΦF = 11.8) was much higher than indocyanine green (ICG) (ΦF = 2.7%)
were excited at 750 nm [63]. We also monitor the temperature evaluation of VNc with
irradiation at a power density of 1.3 W/cm2 for 5 min, but there showed no obvious
increased temperature (Fig. 12).
SWNT also exhibit strong optical absorption in the broad NIR offer unique
advantages for photothermal cancer therapy [29]. To confirm the photothermal effect, we
monitored the temperature of PBS solutions with dispersed SWNT-PEG/VNc and
exposure under 808 nm laser at a power density of 1.3 W/cm2. A temperature elevation
of approximately 23°C resulted from 3 min NIR irradiation on 20 ug/ml SWNT-
PEG/VNc. The results indicated that SWNT possessed a strong capacity of light-heat
conversion under NIR laser irradiation. The SWNT-PEG/VNc solution showed a rapid
increase of temperature when exposed to the laser within a short time (Fig. 13). It is
known the hyperthermia treatment that heating to 40–43°C can destroy the tumor cells.
Therefore, it appears that SWNT-PEG/VNc is suitable to act as PHT agents.
3.1.3 Enhanced cellular uptake by the combination of LV pulses with SWNT.
Since the effective treatment of phototherapy is highly depend on the amount of
photosensitizer delivered into cancer cells, we used low voltage stimulation to enhance
the cellular uptake due to the pore formation in the cell membrane. We expected that
SWNT-PEG/VNc would be readily taken up by HT-29 cells after EP. For pore formation
testing, we used PI dye to identify the cell electro-permeabilization. We used pulsing
buffer with (PI/SWNT/LV and PI/SWNT/HV group) or without SWNT (PI/HV and
PI/LV group) during the pulsation to assess the ability of SWNT to induce pore formation
in the cell membrane by enhancing the LV electrical stimulation. In Fig. 14, the PI signal
was increasing obviously in the cells at 24 h after giving HV pulses (50 V, 40 ms, 10
pulses), but the signal between the PI/SWNT/HV (63.50%) and PI/HV (70.48%) group
showed no obviously difference. This is because the high voltage stimulation could
induce aggressive electric field, the irreversible pore formed in the cell membrane and
lead to cell death. Compare PI (16.28%) with PI/LV (17.39%) groups, the PI signal
showed no obviously increase by the LV pulses (1600 V, 10 ms, 3 pulses), the result
indicate the LV stimulation was not enough to induce the cell electroporation. But in the
PI/SWNT/LV group by using the SWNT pulsing buffer, the PI signal increase from
17.39% to 31.34% indicating the enhanced LV stimulation was attributed to SWNT, so
that cell electroporation could be induced (Fig. 15). According to the PI test, we
demonstrated that the enhanced LV stimulation was attributed to the SWNT.
Next, to investigate the cellular uptake of SWNT-PEG/VNc, we separated the HT-
29 cells into EP and no EP groups. For the no EP group, HT-29 cells were incubated in
medium containing SWNT-PEG/VNc (20-50 ug/ml, 2-5 ug/ml) for 24 h without any
electro-stimulation (Fig. 16A). For the EP group, HT-29 cells trypsinized, and
resuspended in SWNT-PEG/VNc solution (20 ug/ml, 2 ug/ml). The cell exposure to the
HV and LV pulses and then incubated for 24 h. After incubation, VNc fluorescence in
cells was detected by flow cytometry. In Fig. 16A, the measurements revealed that only
15.32% and 19.31% of the cells took up SWNT-PEG/VNc. But for the EP group, the
measurements revealed that 31.03 % (LV) and 47.43 % (HV) of the cells took up SWNT-
PEG/VNc, a much larger percentage than for the no EP group (Fig. 16B). The result
indicated that SWNT combined with LV simulation could increase the cellular uptake
effectively.
3.1.4 SWNT-PEG/VNc mediated Electro-Phototherapy efficiently kills cancer cells.
The most concern issue towards the medical applications of functionalized SWNT
is their impact on cell viability. For this reason, the cytotoxicity of the SWNT was
evaluated. The HT-29 cells were incubated with SWNT-PEG and SWNT-PEG/VNc at
concentrations ranging from 5 to 50 ug/ml for 24 h. At the end of the incubation time,
cells were collected, the results displayed in Fig. 17 showed that the cell viability of both
SWNT/PEG and SWNT-PEG/VNc was preserved at increasing concentrations.
To test the double phototherapy, we incubated HT-29 cells with SWNT-PEG and
SWNT-PEG/Nc for 24 h, then 808 nm laser was used to irradiate the cells for 3 min. In
Fig. 18 and 19, cell cytotoxicity assay demonstrated that combined with NIR irradiation
(808 nm, 1.3 W/cm2) induced stronger cytotoxicity compared with either SWNT or NIR
light irradiation alone. But compare SWNT-PEG/Nc (60.64%) to SWNT-PEG (58.44%),
the cell viability show no obvious difference indicated that the effective treatment may
attribute to the SWNT due to the photothermal effect.
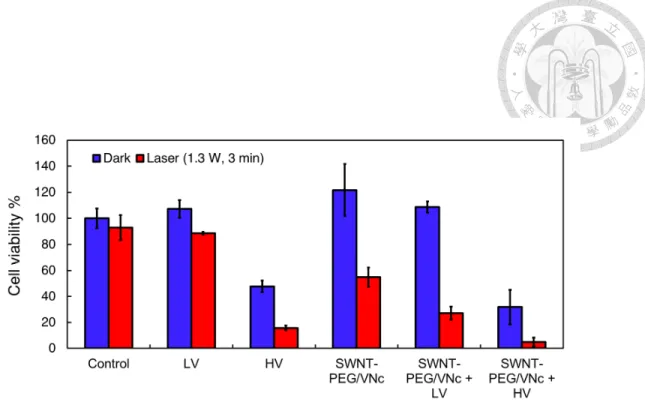
Then, we combined the electro-stimulation with the phototherapy to kill the HT-29
cells. We separated the cells into laser and without laser groups. Both groups were treated
with LV, HV, SWNT-PEG/Nc, SWNT-PEG/Nc + LV and SWNT-PEG/Nc + HV.
Without laser irradiation, the photothermal effect could not be induced so that no cell
death was founded except the cell treated with HV pulses (HV, SWNT-PEG/Nc + HV).
For the laser group, cells exposure to the LV pulses showed no obvious harmful effect,
the cells viability could remained 88.58%. Compare to the LV pulses, the cells treated
with HV pulses showed the decreased cell viability (15.76%). The result revealed that
HV pulses could induce irreversible pore formation on the cell membrane and cause cell
death. Compare SWNT-PEG/Nc + LV to SWNT-PEG/Nc groups, the cell viability of the
cells with electro-stimulation before laser irradiation was 27.17 %, while that without
electro-stimulation was approximately 54.89 %. Therefore, the SWNT combined LV
pulses before phototherapy could cause an obvious increase in toxicity.
Part II. Effect of the LV stimulation on Cell Membrane Poration Enhanced by the
SWNT
Effective delivery of biomolecules or functional nanoparticles into target sites has
always been the primary objective for cancer therapy. In Part II, we demonstrated that by
combining single-walled carbon nanotubes (SWNTs) with low-voltage (LV) electrical
stimulation, biomolecule delivery can be effectively enhanced through reversible
electroporation (EP). Clear pore formation in the cell membrane is observed due to LV
(50 V) pulse electrical stimulation amplified by SWNTs. The cell morphology remains
intact and high cell viability is retained. This modality of SWNT + LV pulses can
effectively transfer both small molecules and macromolecules into cells through
reversible EP.
3.2.1 SWNTs combined with LV pulses induced cell electropermeabilization
We used a pulsing buffer with (LV/SWNT group) or without SWNTs (HV and LV
group) during the pulsation to assess the ability of SWNTs to induce pore formation in
the cell membrane by enhancing the LV electrical stimulation. In addition, we used PI to
identify cell electropermeabilization. PI fluorescence was observed in the cells at 5 min
after HV (1600 V, 10 ms, 3 pulses) pulses, and the signal increased at 15 min (Fig. 21A).
However, at 60 min, the IOD was not significantly increased (Fig. 21B). In real-time
observation, acceleration of the signal appeared in the cells after HV pulses, the cell
cytoplasm was immediately brightened, and the fluorescence was uniformly distributed
throughout the cell (Movie S1, Fig. 22). This result indicated that most of the PI dye was
introduced into the cells at the beginning of EP. PI transfer was accompanied with a
significant driving force due to the HV pulses. As time progressed, diffusion became the
primary process for PI delivery. However, no PI signal was observed in the cells during
the whole observation period after the cells were exposed to LV pulses (50 V, 40 ms, 100
pulses) (Fig. 21A and B). This is because the external electric field could not increase
the transmembrane potential to the threshold value due to which the cell membrane could
not be ruptured, resulting in the failure of EP. The required electric field pulse amplitude
is usually in the range of 103–104 V/cm to raise the transmembrane potential to 0.5–1.0
V, which can result in EP [45]. The effective pulses used for inducing cell
permeabilization are usually >1000 V [46].
Although there was no PI signal observed at 5 min after LV pulses in the cells of the
LV/SWNT group, as the incubation time increased, the PI signal started to escalate (at 15
min) (Fig. 21A). At 60 min, the IOD had no obvious difference between the HV and
LV/SWNT groups (Fig. 21B). In the real-time video, PI appeared slowly as the time
increased, and the signal was finally smeared around in the cell membrane during the 40
min observation period (Movie S2, Fig. 22). Compared with the HV group, PI was
introduced into the cells without any obvious driving force in the LV/SWNT group, and
the cellular uptake was totally attributed to the passive diffusion. Furthermore, the results
suggested that cell electropermeabilization is not induced by exposure to the LV pulses
unless the SWNT pulsing buffer is used. The pore formation was probably attributed to
the amplified electric field by SWNTs (Fig. 23). Rojas-Chapana et al had demonstrated
that the activation of CNTs was due to the “lightening rod” effect that occurred when
CNTs in a region of electric field caused a strong field enhancement at the tips [38]. The
cells with the CNTs attached to the surface and a stream of nanoparticles entered the cell
along with the CNTs [38]. Besides, the interaction in the region between the CNT tips
and cell membrane exit due to the electrostatic force could pull CNTs off the cell
membranes by rotation [41].
Therefore, we used high-magnification images obtained from a field emission
scanning electron microscope (FE-SEM) to investigate the surface of the cell membrane
after giving pulses immediately. In the LV group, we could not find pore formation in the
cell membrane; the surface was flat and similar to that of the no-treatment group (Fig. 24,
no-treatment and LV group). In the SWNT group, aggregated SWNT-like structures were
visible; a large fraction of the tubular structures attached to the surface without any
appearance of pores (Fig. 24, SWNT). However, in the LV/SWNT group, we not only
observed the SWNT-like structures within the cells but the apparent pores in the surface
could also be found easily and with the tubular structures nearby (Fig. 24, LV/SWNT,