行政院國家科學委員會專題研究計畫 期中進度報告
療黴舒(Terbinafine)抑癌作用之分子機制探討(2/3)
計畫類別: 個別型計畫
計畫編號: NSC94-2320-B-038-032-
執行期間: 94 年 08 月 01 日至 95 年 07 月 31 日 執行單位: 臺北醫學大學生物醫學技術研究所
計畫主持人: 何元順 共同主持人: 楊國卿
計畫參與人員: 吳志雄 教授等
報告類型: 精簡報告
報告附件: 出席國際會議研究心得報告及發表論文 處理方式: 本計畫可公開查詢
中 華 民 國 95 年 6 月 15 日
行政院國家科學委員會專題研究計畫 期中進度報告
療黴舒(Terbinafine)抑癌作用之分子機制探討(2/3)
計畫類別: 個別型計畫
計畫編號: NSC 94-2320-B-038-032
執行期間: 94 年 08 月 01 日 至 95 年 07 月 31 日 執行單位: 臺北醫學大學生物醫學技術研究所
計畫主持人: 何元順 共同主持人: 楊國卿
報告類型: 精簡報告
報告附件: 出席國際會議研究心得報告及發表論文
處理方式: 本計畫可公開查詢
中 華 民 國 95 年 5 月 24 日
行政院國家科學委員會專題研究計畫 期中進度報告
計畫類別: 個別型計畫
計畫編號: NSC 93-2314-B-038-051
執行期間: 93 年 08 月 01 日 至 94 年 07 月 31 日 執行單位: 臺北醫學大學生物醫學技術研究所
計畫主持人: 何元順 共同主持人: 楊國卿 一、中文摘要
摘要: Terbinafine (TB)是目前市售抗黴菌 藥物,廣泛應用於皮膚表淺黴菌感染症狀。
有關它的抗癌作用在本實驗中首度探討。
本實驗利用人類皮膚癌細胞(A431)作為研 究材料,發現TB 可以造成細胞週期停滯 於G0/G1 phase,與細胞週期相關之調控蛋 白 p21/Cip1明顯地被誘發,同時CDK2,與 CDK4 kinase活性亦大幅被抑制。本研究證 實TB可以誘發A431細胞分化,並大量分泌 keratin,另外,在高劑量(40-60 μM)TB處 理下,可誘發A431細胞凋亡。 可以明顯 地觀察到細胞內DNA斷片(Ladder)與流式 細胞儀分析之sub-G1族群大量增加。與細 胞凋亡相關的蛋白分析則發現caspases 3, 8和9的表現有被活化。利用裸鼠之致癌模 式,證實TB對人類A431癌細胞有明顯地抗 癌作用,這樣的作用可以應用於臨床上皮 膚癌抗癌治療目的。
關鍵詞: Terbinafine, 抗癌作用, G0/G1 細胞週期停滯,細胞凋亡作用。
Abstract
Terbinafine (TB, lamisil®), a promising world widely used oral-antifungal agent, has been used in the treatment of superficial mycosis. In this study, we found that apoptosis but not cell growth arrest was induced by TB (1 μM, for 24h) in human epidermoid carcinoma (A431) cells. The apoptotic effect induced by TB in the A431 cell was not through the general differentiation mechanisms evidenced by evaluation of three recognized markers,
including CD11b, CD33, and morphological features. In addition, our results also revealed that TB-induced apoptosis was not through the cellular surface CD 95 receptor-mediated signaling pathway. We found that the mitochondria membrane in the TB-treated HL 60 cells was dissipated by decreasing of the electrochemical gradient (ΔΨm) led to leakage of cytochrome c from mitochondria into cytosol. Such effects were completely blocked by in vitro transfection of the A431 cells with Bcl-2 overexpression plasmid (A431/Bcl-2). However, our data found that TB-mediated apoptosis could not be completely prevented in the Bcl-2 over expressed (A431/Bcl-2) cells. Such results implied that additional mediators (such as caspase-9) other than mitochondria membrane permeability might contribute to the TB-induced cellular apoptosis signaling.
This hypothesis was supported by the evidence that administration of caspases-9 specific inhibitor (z-LEHD-fmk) blocked the TB-induced apoptosis. Our studies highlight the molecular mechanisms of TB-induced apoptosis in human epidermoid carcinoma (A431) cells.
Key words: Terbinafine, Anti-cancer, G0/G1 cell cycle arrest, Apoptosis.
二、緣由與目的
Terbinafine (TB) (lamisil®), a promising world widely used oral-antifungal agent, is a newly synthesized oral antimycotic drug in the allylamines class: a
fungicidal agent that inhibits ergosterol synthesis at the stage of squalene epoxidation (Petranyi et al., 1984). TB shows a good safety profile and relatively few drug interactions (Abdel-Rahman and Nahata, 1997). The cream form and oral tablet of TB have been approved for clinical uses in the United States (Gupta and Shear, 1997).
Our recent studies have shown that a number of anti-fungal agents exert antiproliferative and/or apoptotic activities in various malignant cells in vitro and in vivo (Chen et al., 2000; Ho et al., 2001; Ho et al., 1998). The anti-proliferative effect of TB has not been reported until our recent studies demonstrating that TB induced cell cycle arrest at the G0/G1 phase of the cell cycle in hepatoma and colon cancer cells (Lee et al., 2003). We also showed that TB at a range of concentrations (0–120 μM) dose-dependently decreased cell number in cultured human umbilical vascular endothelial cells (Ho et al., 2004). These findings suggest the potential application of TB in anti-angiogenic therapy for clinical anticancer purpose.
Previously, we have demonstrated that TB at a range of concentrations (1 to 30 μM) induces apoptosis in cultured A431 cells (Lee et al., 2003). However, the mechanism underlying of TB-induced the occurrence of apoptosis is not clear. The effector caspases, including caspase-3, may be activated via mitochondria-independent or -dependent pathways (Shi, 2002). The mitochondria independent pathway is activated through binding of the ligands (the tumor necrosis-factor receptor family, such as Fas and TNF) to their receptors and requires the direct cleavage of caspase-3 by activated caspase-8 (Stennicke et al., 1998). On the other hand, caspase-3 can also be activated through the mitochondria-dependent signaling proteins by releasing cytochrome c from its intermembrane space into the cytoplasm (Reed, 1997). In the cytoplasm, cytochrome c, in the presence of ATP or dATP, associates with a complex of apoptotic protease activating factor 1 (Apaf-1) and caspase-9, and leads to
autocatalytic cleavage and activation of caspase-9 in this complex (Qin et al., 1999;
Saleh et al., 1999). Caspase-9 can directly cleave and activate the procaspase-3.
Recent studies have demonstrated that antitumor therapeutic agents-induced A431 cells apoptosis was through the caspases 2, 3, 8, and 9 independent release of cytochrome c into the cytosol (Perchellet et al., 2004).
Such results implied that accumulation of cytosolic cytochrome c level may play some important roles in anticancer drug-induced apoptosis in the A431 cells. Although the mechanisms by which cytochrome c translocated from mitochondria into the cytosol are not fully understood, recent studies clearly demonstrated that members of the Bcl-2 family proteins regulate the mitochondria membrane functions and control the release of cytochrome c (Wang et al., 2004). This family is subdivided into two classes: antiapoptotic members, such as Bcl-2 and Bcl-xL, which protect cells from apoptosis, and proapoptotic members, such as Bax and Bak, which trigger or sensitize the cells for apoptosis (Borner, 2003).
Our recent studies have demonstrated that the antitumor effects of TB in the solid (COLO 205, p53 wild type) and leukemia (HL 60, p53 null) cancer cells were through p53-dependent and p53–independent mechanisms (Ho et al., 2004; Lee et al., 2003). However, these cancer cells have different sensitivities in terms of the occurrence of apoptosis and cell cycle arrest in response to TB treatment. These findings promoted us to investigate the molecular mechanisms of apoptosis induced by TB.
The human epidermoid carcinoma cell (A431, with nulled p53) was served as a research model for investigation of the mechanisms of TB-induced apoptosis. Our results show that TB induces apoptosis by altering mitochondrial transmembrane potential, which causes the release of cytochrome c into the cytosol, and leads to activation of the Apaf-1/caspase-9 apoptosome.
.
三、研究報告內容
Chemicals and reagents
Protease inhibitors (phenylmethyl sulfonyl fluoride (PMSF), pepstatin A, leupeptin, and aprotinin) were acquired from Sigma Chemical Company (Sigma Aldrich Chemie GmbH, Steinheim, Germany). Caspase-8 inhibitor (zIETD-fmk), caspase-9 inhibitor (zLEHD-fmk), caspase-3 inhibitor (zDEVD-fmk), and the general caspase inhibitor (zVAD-fmk) were obtained from Alexis Corporation (Switzerland).
Dulbecco’s modified Eagle’s medium (DMEM), Fetal calf serum (FCS), penicillin/streptomycin solution, and fungizone were purchased from Gibco-Life Technologies (Paisley, UK).
Antibodies
The following polyclonal or monoclonal antibodies were obtained from various sources as indicated: anti-caspase-8, anti-cytochrome c, anti-Bax, anti-Apaf-1, and anti-Bcl-2 antibodies (Santa Cruz Biotechnology, CA), anti-caspase-9, and anti-caspase-3 antibodies (Stressgen Biotechnologies, Victoria, British Columbia, Canada), anti-cytochrome c oxidase, (Research Diagnostics, Flanders, New Jersey, USA), and anti-actin mAb (Sigma Aldrich Chemie GmbH, Steinheim, Germany). CD11b leu™-15 antibody, and CD33 antibody (rabbit anti-human) were purchased from Becton Dickinson (Cambridge, UK).
Transfection of Bcl-2 with expression plasmid
A431 cells were transfected with pBcl-2 plasmid (pcDNA3-Bcl-2; Science Reagent, El Cajon, CA) using the Lipofectin reagent (Life Technologies, Inc., Gaithersburg, MD).
Briefly, 0.8 ml of the cell suspension (3x10⁶ cells/ml) was added to each well in six-well plates. Two μg of pBcl-2 plasmid DNA were diluted in 98 μl of OPTI-MEM1 medium, and 16 μl of Lipofectin reagent were diluted in 84 μl of OPTI-MEM1 medium. The vector plasmid without Bcl-2 gene was used as a negative control. After a 45-min incubation at room temperature, the DNA and Lipofectin diluents were combined and incubated for 15 min at room
temperature. Then, 200 μl of the DNA/Lipofectin mixture were added to each well, and cells were incubated for 12 h at 37°C. Cells were allowed to express Bcl-2 for 2 days. Bcl-2 expression was confirmed by Western blotting analysis.
Cells and culture conditions
The COLO 205 cell line was isolated from human colon adenocarcinoma (CCL-222;
American Type Culture Collection, ATCC).
The A431 cell line was derived from human myeloid leukemia cells (59170;ATCC). The cell line #76 KhGH (CRL 8858; ATCC) was composed of keratinocytes derived from normal human epidermis (Lee et al., 2003).
The cell lines were grown in RPMI 1640 (for COLO 205 and A431 cells) supplemented with 10% FCS, 50 μg/mL gentamycin and 0.3 mg/mL glutamine in a humidified incubator (37°C, 5% CO2). A 3:1 mixture of Ham’s F12 medium and DMEM medium (for #76 KhGH cells) supplemented with 10% FCS, 40 ng/ml hydrocortisone, 0.01 mg/ml cholera toxin, 0.005 mg/ml insulin, and 10 ng/ml epidermal growth factor. HL-60 cells were differentiated into mature neutrophil-like cells by treating with 1μM retinoic acid (RA) for 5 days.
For the caspase inhibitors studies, the A431 cells were seeded onto plastic six-well culture plates or 100-mm culture dishes at 5 x10⁵ cells/ml and allowed to grow for 2–3 days. Following this, they were incubated with various concentrations (10-60 μM) of inhibitors specific to caspase-8 (zIETD-fmk), or caspase-9 (zLEHD-fmk) or with 50 μM of the general inhibitor of caspases (zVAD-fmk) for 4 h. The cells were then exposed to TB at a concentration of 30 μM for 24 h. Following the treatment, cells were harvested by centrifugation at 500 xg for 5 min, washed with PBS, and subsequently used for various biochemical investigations.
Determination of cell viability
Cell viability was determined based on the trypan blue exclusion method as described previously (Ho et al., 2001; Lee et al., 2003). The viability percentage was calculated based on the percentage of unstained cells.
Wright–Giemsa stain
For Wright–Giemsa staining to monitor the extent of cellular differentiation, cells were cytospun onto ethanol-cleaned SuperFrost glass slides as described previously (Rice et al., 2004), fixed with methanol (RT, 15 min), air-dried, and stained with Wright–Giemsa stain solution (Sigma Chemical Co., St.
Louis, MO), following the manufacturer’s instructions.
Flow cytometry analysis
The cell cycle stages in the TB- or DMSO-treated groups were determined by flow cytometry analysis (Ho et al., 2004; Ho et al., 2001; Lee et al., 2003). Nuclear DNA was stained with a reagent containing propidium iodine (50 μg/ml) and DNase-free RNase (2 U/ml) and measured using a fluorescence-activated cell sorter (FACS). The population of nuclei in each phase of the cell cycle was determined using established CellFIT DNA analysis software (Becton Dickenson, San Jose, CA).
Protein extraction, immunoprecipitation and Western blotting analysis
The A431 cells treated with DMSO or TB were harvested, washed twice with PBS, lysed, and electroblotted onto a PVDF membrane (Millipore) using standard techniques as described in our recent publications (Ho et al., 2004; Lee et al., 2003). The PVDF membrane were blocked by incubation for 2 h in PBS buffer containing 5% nonfat dry milk and 0.1%
Tween-20, and then probed with antibodies:
anti-caspase-8 (1:1,000), anti-caspase-9 (1:3,000), anti-caspase-3 (1:2000), anti-cytochrome c (1:2,000), anti-Bcl-2 (1:1,000), anti-Bax (1:500), or anti-cytochrome c oxidase (1:500). The blots were then incubated with horseradish peroxidase-conjugated secondary antibodies (1:2,000 dilution) (N20; Santa Cruz, California, USA). The antigen–antibody complex was detected by SuperSignal chemiluminescence kit as described in the manufacturer’s protocol (Pierce Biotechnology, Rockford, IL) and visualized by autoradiography. To confirm equal loading of proteins, the blots were also immunoprobed with a rabbit polyclonal antibody against the cytoskeletal protein
β-actin (1:2,500 dilution). The consistent equal signals of β-actin from the different extracts also indicate that TB and the caspases inhibitors do not interfere with protein synthesis in A431 cells (data not shown). Immunoprecipitation was performed as described in our studies (Ho et al., 2004; Lee et al., 2003). Equal amounts of protein were immunoprecipitated with saturating amounts of anti-caspase-9 antibody. The caspase-9-immunoprecipitated Apaf-1 protein was then measured by Western blot analysis. Isolation of mitochondria and cytosolic fractions of cell lysates were performed as described previously (Ashktorab et al., 2004).
Analysis of apoptosis
Apoptosis in the A431 cells subjected to various treatments was determined by using the Annexin V-FITC (fluorescein isothiocyanate) staining kit from BD Biosciences (Franklin Lakes, NJ). PI was used to differentiate apoptotic cells with preserved membrane integrity (Annexin+, PI-) from necrotic cells that lost membrane integrity (Annexin-, PI+). The assay was performed following the manufacturer’s procedure. After staining, the percentage of apoptotic cells under various treatments was analyzed by flow cytometry (FACS Calliber, BectonDickinson) as described previously (Tseng et al., 2002). Analysis of DNA fragmentation was performed as previously described (Ho et al., 1996).
Caspase Activity Assay
Caspase activity was measured by using caspases 3 (Promega, Madison, WI) and 9 (Chemicon, Temecula CA) colorimetric activity assay kits as previous described (Ho et al., 2003; Lin et al., 2001). Briefly, HL 60 cells were lysed by addition of cell lysis buffer and protein concentration was measured. Caspase activity was assayed at 37 oC in 100 μl of assay buffer containing 50 μg (for caspase 3) or 30 μg (for caspase 9) of the indicated colorimetric peptide.
Caspase activity was measured by the release of p-nitroaniline (pNA) from the labeled substrates Ac-DEVD-pNA and Ac-LEHD-pNA for caspase 3 and 9, respectively, and the free pNA was
quantified at 405 nm.
Quantification of cell-surface antigen expression
The expression of CD11b and CD33 antigen on the surface of differentiating HL-60 cells was measured by flow cytometry. Cells (1x10⁵)/100 μl RPMI were treated with 10 μl anti-CD11b/CD33 antibody and incubated at 4°C for 20 min. The cells were washed twice with 400 μl cold PBS at 1,100 rpm for 10 min, and finally resuspended in 400 μl Isoton II solution on ice before they were analyzed by using flow cytometric analysis.
Mitochondrial transmembrane potential assay
To assess the mitochondrial transmembrane potential (ΔΨm), HL-60 cells (1x10⁶) were seeded in a 6-well plate washed twice with PBS and then loaded with the cationic lipophilic fluorochrome JC-1 (5 µg/ml) for 10 min at 37°C. Cells were washed twice with PBS and submitted to FACS-analysis.
The red fluorescence of JC-1 aggregates corresponds to the mitochondrial membrane potential whereas the green fluorescence of JC-1 monomers is indicative for the mitochondrial mass. Active mitochondria with high ΔΨm accumulate JC-1 aggregates, which are red, whereas, in the mitochondria with low ΔΨm, JC-1 stays in a monomeric, green form. This renders the red/green ratio, a sensitive indicator of the mitochondrial ΔΨm changes. In addition, carbonyl cyanide
m-chlorophenylhydrazone (CCCP;
Calbiochem) or valinomycin (Val, Sigma) were dissolved in 100% acetone and diluted in complete medium; the acetone concentration in the medium did not exceed 1%. Both of the CCCP and Val were added at a final concentration of 200 μM as a positive control, and the fluorescence was assessed for each time point, a red/green fluorescence ratio was then calculated. The mean red fluorescence of drug-treated cells was measured at 0, 2, 4, 6, 8, 10, and 12 h after TB treatment, and presented as a ratio of the absorbance in 590/535 nm (Maianski et al., 2004).
Statistics
Statistical analysis was carried out using
analysis of variance (ANOVA)—one way analysis of variance with Student—Newman correction, and the Student’s t-test.
Significance was assumed for values of P <
0.05.
Results:
Cytotoxic effects of TB in human cancer cells
To investigate the cellular regulatory mechanisms of apoptosis induced by TB, human A431 cells were selected as a research model. As shown in Fig. 1, the viability of A431 cells was dose-dependently decreased at 24 hr after exposure to various concentrations of TB (0-30 M), but was not affected by DMSO (0.05%, v/v) treatment. Figs. 1A and C showed that the human A431 cell was the most susceptible to TB-induced cytotoxic effects as compared to human untransformed keratinocytes and colon cancer (COLO 205) cells.
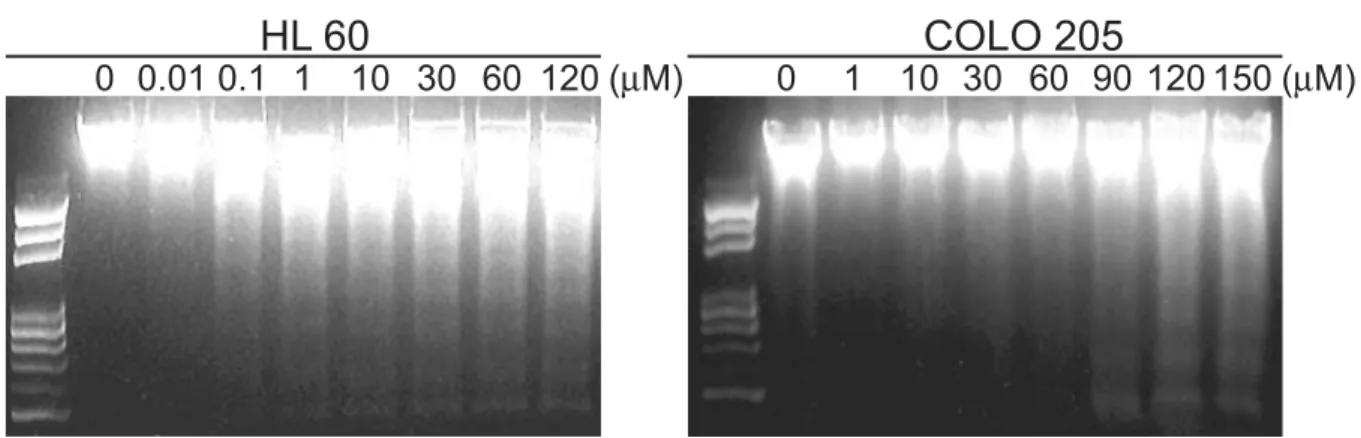
TB-induced apoptosis in human A431 cells DNA fragmentation was observed in the A431 cells treated with 1 μM TB for 24 h (Fig. 2A, left), whereas a concentration higher than 90 μM TB was required for induction of DNA laddering fragmentation in the COLO205 cells (Fig. 2A, right). In consistent to Fig. 2A, a significant sub-G1 peak determined by flow cytometric analysis was observed in the A431 cells after TB treatment for 24 hr (Fig. 2B, left). In the same conditions, the COLO 205 cells were arrested at the G0/G1 phase (Fig. 2C, left).
TB-induced the occurrence of apoptosis in A431 cells was not through differentiation signaling pathways
To further confirm whether TB-induced apoptosis was through differentiation processes as described previously (Martin et al., 1990; Olins et al., 2000), three recognized markers including the CD11b, CD33, and morphological changes were assessed (Stabellini et al., 2004). As shown in Fig. 3A, characteristic segmented nuclei and morphological features characteristic of blastic leukemic cell like was observed in the RA (1 μM, 48 hrs)-treated A431 cells (Fig. 3A, middle, arrow). However, apoptotic but not differentiated cell like morphology was observed in TB (1 μM, 48 h)-treated A431 cells (Fig. 3A, right, arrow).
Consistently, RA treatment resulted in an increase in the percentage of cells expressing CD11b (Fig. 3B), and a
time-dependent decrease in the percentage of CD33 expression (Fig. 3C).
Flow cytometric analysis of DNA content revealed that TB (1 μM) treatment resulted in a well-characterized and time-dependent increase in the percentage of apoptotic cells as early as after 24 h treatment (Fig. 3D). In contrast, as shown in Fig. 3D, apoptotic cells were not detected in the A431 cells until 3 days after RA (1 μM) treatment.
TB-induced A431 cells apoptosis was not through protein synthesis and CD95 receptors signal pathways.
Preincubation of A431 with cycloheximide (CHX, 1 μg/ml, 1 h), a protein synthesis inhibitor (Maianski et al., 2004; Mezzanzanica et al., 2004), had no influence on TB-mediated cell death (data not shown), indicating that protein synthesis was not pre-requested for TB-induced apoptosis. We then examine whether a potential signaling of TB-induced apoptosis in the A431 cells was via the cell surface CD95/Fas death receptor. Preincubation of the A431 cells with ZB4 (1 μg/ml), a neutralizing anti-CD95 antibody (Woo et al., 2004), showed a significant reduction in apoptosis induced by soluble CD95/FasL (100 ng/ml) when compared with the cells treated with CD95/FasL only (Fig. 4A, lanes 5 and 6). In contrast, ZB4 was unable to reduce TB (1 μM, 24 hr)-triggered apoptosis (Fig. 4A, lane 4).
TB treatment caused the changes of mitochondria membrane permeability in HL 60 cells
Since the CD95 death receptor seems to be not required for TB-induced apoptosis in A431 cells (Fig. 4A), we then examined whether cytochrome c release from mitochondria into the cytosol and dissipation of the electrochemical gradient (ΔΨm) was involved in the TB-mediated apoptosis. A real-time plate reader assay showed that ΔΨm stayed relatively stable in untreated A431 cells, while it was rapidly (within 6 hrs) dissipated by 1 μM TB treatment (Fig. 4B). The ΔΨm was rapidly (within 2 hrs) dissipated by the uncoupled CCCP or by the K+ ionophore Val and
served as a positive control (Fig. 4B). As shown in the Figs. 4B and C, TB (1 μM) increased outer (cytochrome c release) and inner (loss of ΔΨm) mitochondria membrane permeability. The release of cytochrome c (Fig. 4C) kinetically paralleled a decreased of mitochondria membrane potential (Fig.
4B). These observations suggest that TB-induced apoptosis may be initiated with early alterations in mitochondrial membrane stability.
Bcl-2 protein plays an important role in protection of TB-induced apoptosis in HL 60 cells
We further investigated whether the observed dysfunction of mitochondria is responsible for the TB-triggered apoptosis in A431 cells. We found that the Bcl-2 protein level was significantly decreased in the A431 cells at 6 h after treatment with 10 μM TB (Fig. 5A). To examine whether cytochrome c release was biologically functioning in initiating apoptosome assembly, immunoprecipitation was performed with cytosolic preparation from TB-treated cells by using antibody specifically against the cytochrome c. As shown in Fig. 5A, a significant increase of Apaf-1 protein level in cytochrome c co-precipitates was detected from A431 cells treated with TB for 12 h.
We therefore treated the Bcl-2 over-expressed A431 cells with TB (0.1-30 μM) for 24 h (Fig. 5B). In response to lower dose (0.1-1 μM) of TB, the A431/Bcl-2 cells, but not control (A431/PcDNA3) cells, were prevented from the occurrence of apoptosis (Fig. 5B), suggesting that down-regulation of Bcl-2 protein might be involved in the TB-induced apoptosis through a mitochondria-dependent pathway. However, the apoptosis was not completely prevented in the A431/Bcl-2 cells treated with higher dose TB (> 10 μM) (Fig. 5B). As shown in the Fig. 5C, over-expression of Bcl-2 protein completely inhibited the TB-induced release of cytochrome c from mitochondria into cytosol in the A431/Bcl-2 cells (Fig. 5C, lanes 2 and 3). However, the results from the time-dependent experiments revealed that higher dose (10 μM) TB-induced apoptosis
could not be completely prevented in the A431/Bcl-2 cells (Fig 5D). These findings suggest that the results from cytochrome c release assay do not always correlate with the results from Annexin V staining.
Additional signaling proteins other than Bcl-2 might be involved in the TB-induced the occurrence of apoptosis in A431 cells.
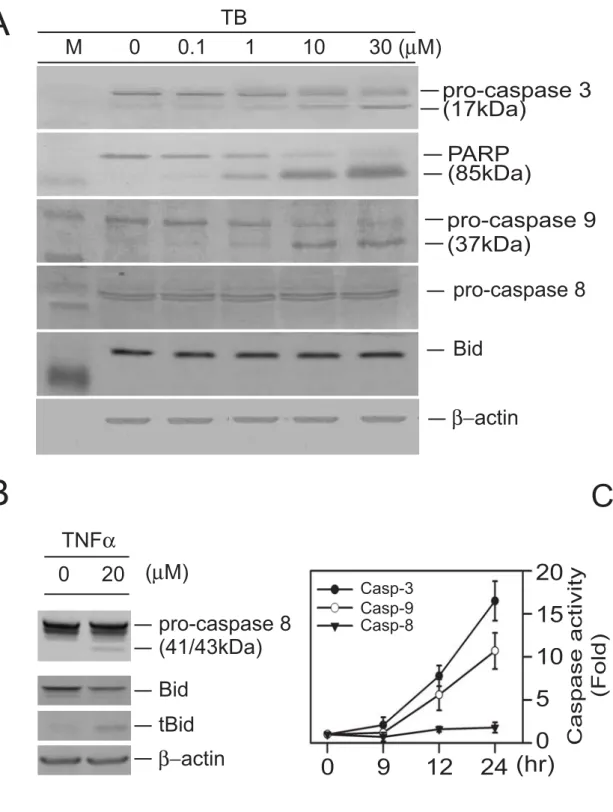
TB-induced apoptosis in A431 cells is through activation of caspases-3 and -9, but not caspase-8.
The A431 cells were treated with various concentrations of TB (0.1-30 μM) for 24 h. TB at a lower dose (1 μM) caused activation of the caspase-3 and degradation of the poly-ADP-ribose polymerase, the substrate for caspase-3 (Fig. 6A). To further elucidate the apoptotic pathways involved in the activation of caspase-3, we examined the changes of the protein levels of caspases 8 and 9 in the TB-treated A431 cells.
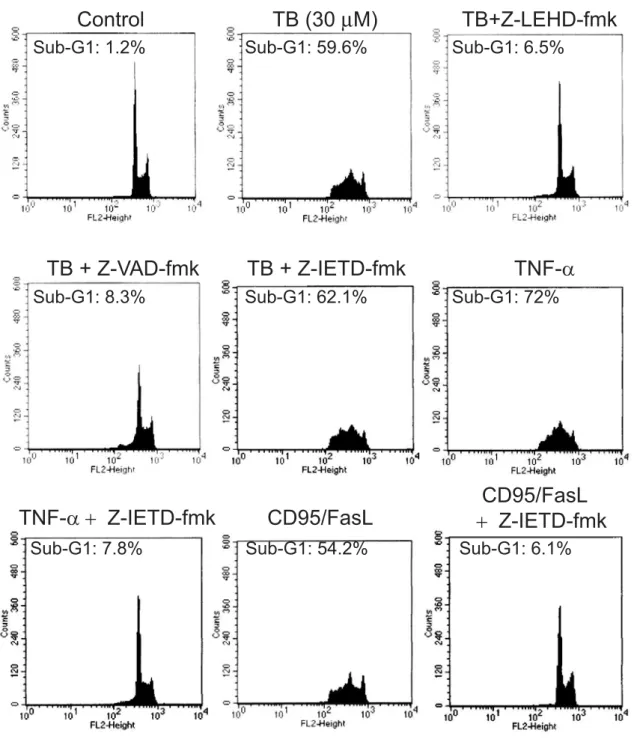
Treatment of A431 cells with TB (> 1 μM) activated caspase-9, but not caspase 8, evidenced by degradation of the procaspases 9 as well as the appearance of its cleavage product (Fig. 6A). To confirm that the absence of caspase-8 activation was not due to technical problem, TNFα (20 μM)-treated A431 cells showing the cleavage of procaspase-8 as well as cleavage of its substrate, Bid protein, was served as a positive control (Fig. 6B). Caspase activity assays showed that treatment of HL 60 cells with high dose TB (30 μM) significantly increased caspases-3 (7.8 fold) and -9 (5.6 fold) activity as early as 12 hr after drug treatment as compared with DMSO-treated group, while the caspase 8 activity was not changed significantly even at a long-term (24 h) TB treatment (Fig. 6C). To further confirm these findings, the A431 cells were pre-incubated for 4 h with or without the caspase-8-specific inhibitor z-IETD-fmk, caspase-9-specific inhibitor z-LEHD-fmk, or the broad range inhibitor of caspases z-VAD-fmk, followed by TB (30 μM) treatment for 24 h. The percentages of apoptotic cells were analyzed by flow cytometric assay. As shown in Figure 7, both the caspase-9-specific inhibitor (z-LEHD-fmk) and the caspase general
inhibitor (zVAD-fmk) reduced the TB-induced apoptosis to a same extent. In the absence of caspase inhibitors, TB caused a 59.6% apoptotic cell death. In the presence of z-LEHD-fmk (60 μM) and zVAD-fmk (50 μM), however, the percentage of TB-induced apoptotic cell death was decreased to 6.5 and 8.3%, respectively. In contrast, the caspase-8 inhibitor (z-IETD-fmk) at a concentration of 60 μM had no effect on the TB-induced apoptosis (62.1%). The caspase-8 inhibitor at a concentration as high as 100 μM still did not cause any decrease in TB-induced apoptosis (data not shown). The TNF-α- and CD95/FasL-induced apoptosis was completely suppressed by caspase-8 inhibitor, suggesting that z-IETD-fmk at a concentration of 60 μM is sufficient to inhibit caspase-8 activity. The specificity of these inhibitors was demonstrated by showing that vehicle (DMSO) treatment had no effect on TB-stimulated apoptosis. Taken together, our results suggest that TB-induced apoptosis is dependent on caspase-9 activation.
Discussion:
The ability of chemotherapeutic agents to initiate apoptosis plays an important determinant of their therapeutic response.
However, significant toxicity at high doses has precluded the use of chemotherapeutic agents as a monotherapy for cancers.
Combination therapy is one potential method to help in reducing a compound with undesirable toxic effects but still maintain or enhance its anti-tumor efficacy. Recently, we have demonstrated that griseofulvin, an oral antifungal agent, potentiates the anti-cancer activities of nocodazole (ND) (Ho et al., 2001). Moreover, we showed an enhancement of TB on the ND-induced colon cancer cells apoptosis (Lee et al., 2003). TB has been used as an orally active broad-spectrum antifungal drug, especially active in patients with histoplasmosis or nonmeningeal cryptococcosis (Caceres-Rios et al., 2000; Rademaker and Havill, 1998).
A previous study has demonstrated that approximately 70% of TB is absorbed after an oral dose (250 mg) (Jensen, 1989) and the maximum plasma concentrations of 0.5-1.5 μg/mL are reached within 2 h (Humbert et al., 1995; Kovarik et al., 1992;
Kovarik et al., 1995). Another report in a human study showed that the plasma level of TB after daily oral receiving of 250 mg TB for 4 weeks was 1.7±0.77 μg/ml (5.83 μM) (Kovarik et al., 1995). Here, we showed that administration of TB at a concentration as low as 1 μM for 24h induced significant apoptosis in the HL 60 cells (Figs. 3D, 4A, and 4C). We further demonstrated that the TB-induced the occurrence of apoptosis in the A431 cells was not mediated through differentiation process (Fig. 3A). Such results implied that administration of lower dose (1 μM) TB could reach the therapeutic concentrations in plasma. Importantly, cytotoxicity analysis showed that TB at the doses (0.01-30 M) used in our in vitro studies was not cytotoxic for the cultured untransformed human keratinocyte. Moreover, the dose (50 mg/Kg body weight) used in our previous in vivo study performed in the nude mice model was not cytotoxic for the vital organs
(Lee et al., 2003).
The caspase 8/ FADD (extrinsic) and mitochondrial (intrinsic) pathway are the two major signal pathways regulating apoptosis process. Both of the apoptosis routes were activated during erythroid cell differention (Testa, 2004) and cancer chemotherapy (Hajra and Liu, 2004). Recent studies have demonstrated that both CD95- and B cell receptor (BCR)-mediated apoptosis depend on Bax activation and cytochrome C release, although the timing and caspase-dependence of mitochondrial membrane depolarization differed considerably after CD95- or BCR-triggering (Mackus et al., 2002). However, some other death receptors in the TNF receptor family (such as TNFR1, DR3/Apo3, DR4/DR5, etc,) have been reported to be a mediator in response to cancer chemotherapy. For example, it has been shown that clinically applied anticancer drug, cisplatin, induced apoptosis of solid tumor cells through the CD95 and DR5-dependent pathways (Han et al., 2003; Lacour et al., 2004). Another study revealed that camptothecin or etoposide (VP-16) in combination with tumor necrosis factor-related apoptosis-inducing ligand (TRAIL) substantially accelerated kinetics of apoptosis in human leukemia (HL 60) cells.
The authors suggested that DR4 aggregation mediated by camptothecin or VP-16 could represent as an important mediator that accelerates TRAIL-induced apoptosis (Bergeron et al., 2004). In contrast, tumors resistant to cytotoxic drugs may occur through altered expression of death receptors DR4 and DR5 (Zhang and Fang, 2005), resistance to TRAIL-mediated apoptosis (Zhang and Fang, 2005), or sequestration of Fas/caspase-8 signaling pathways (Barnhart et al., 2005; Kim et al., 2001). In this study, although only one death receptor CD95/Fas has been examined to explore the eventual effect of TB on the extrinsic (non mitochondrial) pathway of apoptosis. These findings suggested that TB might be a useful salvage agent in the management of chemotherapy resistant cancer.
We have previously demonstrated that TB
induced cell growth arrest at the G0/G1 phase through a p53-dependent signaling pathway (Ho et al., 2004; Lee et al., 2003).
The TB-induced apoptosis, however, was through a p53-independent signaling pathway. Our data suggest that intracellular regulatory proteins other than p53 may be involved in TB-induced apoptosis.
Accordingly, we investigated the p53-independent mechanisms in TB-induced apoptosis. Our results showed that preincubation of the A431 (p53-null) cells with CHX (1 μg/ml, 1 h) had no influence on TB-mediated cell death (data not shown), suggesting that de novo protein synthesis is not a prerequisite for TB-induced apoptosis.
In turn, decrease of Bcl-2 protein expression may result in excess Bax homodimers, which will be translocated to the mitochondrial outer membrane (Fig. 5A), and then led to leakage of cytochrome c through its pore-forming activity (Wei et al., 2001). Our study provide evidences showed that Bcl-2 protein significantly prevented cytochrome c release, but cannot completely prevent the TB-treated A431/Bcl2 cells undergoing apoptosis (Figs. 5B and 5D), suggesting that additional apoptotic factors other than Bcl2/Bax family proteins are involved in the TB-induced the occurrence of apoptosis in A431.
In this study, our results first demonstrated that TB induced promyelocytic (HL 60) cell apoptosis via a signaling pathway independent of cell growth arrest. We further examined the sequence of the molecular events involved in the activation of mitochondria-mediated signaling pathways during the process of TB-induced apoptosis. Our results indicate that the leakage of cytochrome c was preceded by the translocation of Bax to mitochondria.
Our data suggest that translocation of Bax to mitochondria, which lead to release of cytochrome c, is dependent on amplification of the specific caspase cascade and entry of the cell into the execution phase of apoptosis.
This hypothesis is supported by our results showing that translocation of the Bax to mitochondria, release of cytochrome c into cytosol, and the occurrence of cell apoptosis
were clearly inhibited by the caspase-9-specific inhibitor (Z-LEHD-fmk) (Fig. 7). The caspase-9 might therefore play an important role in mitochondria signaling pathways for TB-induced apoptosis. Similar results described by previous report showed that activation of caspase-9 usually occurs downstream of cytochrome c release from mitochondria (Saleh et al., 1999). Assembly of the apoptosome complex might represent the initiating step for the TB-mediated caspase cascade activation (Saelens et al., 2004). However, whether this apoptosome directly causes the release of the different mitochondrial apoptogenic factors simultaneously is currently unknown (Martin et al., 2004). Further studies are required to understand how the compositions of the apoptosome active Bax translocation to the mitochondria and trigger the mitochondrial release of cytochrome c.
References:
Abdel-Rahman, S.M., Nahata, M.C., 1997.
Oral terbinafine: a new antifungal agent. Annals of Pharmacotherapy 31 (4), 445-456.
Ashktorab, H., Frank, S., Khaled, A.R., Durum, S.K., Kifle, B., Smoot, D.T., 2004. Bax translocation and mitochondrial fragmentation induced by Helicobacter pylori. Gut 53 (6), 805-813.
Barnhart, B.C., Pietras, E.M., Algeciras-Schimnich, A., Salmena, L., Sayama, K., Hakem, R., Peter, M.E., 2005. CD95 apoptosis resistance in certain cells can be overcome by noncanonical activation of caspase-8. Cell Death Differ 12 (1), 25-37.
Bergeron, S., Beauchemin, M., Bertrand, R., 2004. Camptothecin- and etoposide-induced apoptosis in human leukemia cells is independent of cell death receptor-3 and -4 aggregation but accelerates tumor
necrosis factor-related apoptosis-inducing ligand-mediated
cell death. Mol Cancer Ther 3 (12), 1659-1669.
Borner, C., 2003. The Bcl-2 protein family:
sensors and checkpoints for life-or-death decisions. Mol Immunol 39 (11), 615-647.
Caceres-Rios, H., Rueda, M., Ballona, R., Bustamante, B., 2000. Comparison of terbinafine and griseofulvin in the treatment of tinea capitis. Journal of the American Academy of Dermatology 42 (1 Pt 1), 80-84.
Chen, R.J., Lee, W.S., Liang, Y.C., Lin, J.K., Wang, Y.J., Lin, C.H., Hsieh, J.Y., Chaing, C.C., Ho, Y.S., 2000.
Ketoconazole induces G0/G1 arrest in human colorectal and hepatocellular carcinoma cell lines.
Toxicology & Applied Pharmacology 169 (2), 132-141.
Gupta, A.K., Shear, N.H., 1997. Terbinafine:
an update. Journal of the American Academy of Dermatology 37 (6), 979-988.
Hajra, K.M., Liu, J.R., 2004. Apoptosome
dysfunction in human cancer.
Apoptosis 9 (6), 691-704.
Han, J.Y., Hong, E.K., Choi, B.G., Park, J.N., Kim, K.W., Kang, J.H., Jin, J.Y., Park, S.Y., Hong, Y.S., Lee, K.S., 2003. Death receptor 5 and Bcl-2 protein expression as predictors of tumor response to gemcitabine and cisplatin in patients with advanced non-small-cell lung cancer. Med Oncol 20 (4), 355-362.
Ho, P.Y., Liang, Y.C., Ho, Y.S., Chen, C.T., Lee, W.S., 2004. Inhibition of human vascular endothelial cells proliferation by terbinafine. Int J Cancer 111 (1), 51-59.
Ho, Y.S., Duh, J.S., Jeng, J.H., Wang, Y.J., Liang, Y.C., Lin, C.H., Tseng, C.J., Yu, C.F., Chen, R.J., Lin, J.K., 2001.
Griseofulvin potentiates antitumorigenesis effects of
nocodazole through induction of apoptosis and G2/M cell cycle arrest in human colorectal cancer cells. Int J Cancer 91 (3), 393-401.
Ho, Y.S., Duh, J.S., Jeng, J.H., Wang, Y.J., Liang, Y.C., Lin, C.H., Tseng, C.J., Yu, C.F., Chen, R.J., Lin, J.K., 2001.
Griseofulvin potentiates antitumorigenesis effects of
nocodazole through induction of apoptosis and G2/M cell cycle arrest in human colorectal cancer cells.
International Journal of Cancer 91 (3), 393-401.
Ho, Y.S., Ma, H.Y., Chang, H.Y., Wei, B.L., Lee, C.C., Ho, S.Y., Guo, H.R., Wu, T.P., Chang, W.H., Wang, Y.J., 2003.
Lipid peroxidation and cell death mechanisms in rats and human cells induced by chloral hydrate. Food Chem Toxicol 41 (5), 621-629.
Ho, Y.S., Tsai, P.W., Yu, C.F., Liu, H.L., Chen, R.J., Lin, J.K., 1998.
Ketoconazole-induced apoptosis through P53-dependent pathway in human colorectal and hepatocellular carcinoma cell lines. Toxicology &
Applied Pharmacology 153 (1), 39-47.
Ho, Y.S., Wang, Y.J., Lin, J.K., 1996.
Induction of p53 and
p21/WAF1/CIP1 expression by nitric oxide and their association with apoptosis in human cancer cells. Mol Carcinog 16 (1), 20-31.
Humbert, H., Cabiac, M.D., Denouel, J.,
Kirkesseli, S., 1995.
Pharmacokinetics of terbinafine and of its five main metabolites in plasma and urine, following a single oral dose in healthy subjects.
Biopharmaceutics & Drug Disposition 16 (8), 685-694.
Jensen, J.C., 1989. Clinical pharmacokinetics of terbinafine (Lamisil). Clinical & Experimental Dermatology 14 (2), 110-113.
Kim, P.K., Mahidhara, R., Seol, D.W., 2001.
The role of caspase-8 in resistance to cancer chemotherapy. Drug Resist Updat 4 (5), 293-296.
Kovarik, J.M., Kirkesseli, S., Humbert, H., Grass, P., Kutz, K., 1992.
Dose-proportional pharmacokinetics of terbinafine and its N-demethylated metabolite in healthy volunteers.
British Journal of Dermatology 126 (Suppl 39), 8-13.
Kovarik, J.M., Mueller, E.A., Zehender, H., Denouel, J., Caplain, H., Millerioux, L., 1995. Multiple-dose pharmacokinetics and distribution in tissue of terbinafine and metabolites.
Antimicrobial Agents &
Chemotherapy 39 (12), 2738-2741.
Lacour, S., Hammann, A., Grazide, S., Lagadic-Gossmann, D., Athias, A., Sergent, O., Laurent, G., Gambert, P., Solary, E., Dimanche-Boitrel, M.T., 2004. Cisplatin-induced CD95 redistribution into membrane lipid rafts of HT29 human colon cancer cells. Cancer Res 64 (10), 3593-3598.
Lee, W.S., Chen, R.J., Wang, Y.J., Tseng, H., Jeng, J.H., Lin, S.Y., Liang, Y.C., Chen, C.H., Lin, C.H., Lin, J.K., Ho, P.Y., Chu, J.S., Ho, W.L., Chen, L.C., Ho, Y.S., 2003. In vitro and in vivo studies of the anticancer action of terbinafine in human cancer cell lines: G0/G1 p53-associated cell cycle arrest. Int J Cancer 106 (1),
125-137.
Lin, S.Y., Chang, Y.T., Liu, J.D., Yu, C.H., Ho, Y.S., Lee, Y.H., Lee, W.S., 2001.
Molecular mechanisms of apoptosis induced by magnolol in colon and liver cancer cells. Mol Carcinog 32 (2), 73-83.
Mackus, W.J., Lens, S.M., Medema, R.H., Kwakkenbos, M.J., Evers, L.M., Oers, M.H., Lier, R.A., Eldering, E., 2002. Prevention of B cell antigen receptor-induced apoptosis by ligation of CD40 occurs downstream of cell cycle regulation. Int Immunol 14 (9), 973-982.
Maianski, N.A., Geissler, J., Srinivasula, S.M., Alnemri, E.S., Roos, D., Kuijpers, T.W., 2004. Functional characterization of mitochondria in neutrophils: a role restricted to apoptosis. Cell Death Differ 11 (2), 143-153.
Maianski, N.A., Roos, D., Kuijpers, T.W., 2004. Bid truncation, bid/bax targeting to the mitochondria, and caspase activation associated with neutrophil apoptosis are inhibited by granulocyte colony-stimulating factor. J Immunol 172 (11), 7024-7030.
Martin, A.G., Nguyen, J., Wells, J.A., Fearnhead, H.O., 2004. Apo cytochrome c inhibits caspases by preventing apoptosome formation.
Biochem Biophys Res Commun 319 (3), 944-950.
Martin, S.J., Bradley, J.G., Cotter, T.G., 1990.
HL-60 cells induced to differentiate towards neutrophils subsequently die via apoptosis. Clin Exp Immunol 79 (3), 448-453.
Mezzanzanica, D., Balladore, E., Turatti, F., Luison, E., Alberti, P., Bagnoli, M., Figini, M., Mazzoni, A., Raspagliesi, F., Oggionni, M., Pilotti, S., Canevari, S., 2004. CD95-mediated apoptosis is impaired at receptor level by cellular FLICE-inhibitory protein (long form) in wild-type p53 human ovarian carcinoma. Clin Cancer Res 10 (15), 5202-5214.
Olins, A.L., Herrmann, H., Lichter, P., Olins,
D.E., 2000. Retinoic acid differentiation of HL-60 cells promotes cytoskeletal polarization.
Exp Cell Res 254 (1), 130-142.
Perchellet, E.M., Wang, Y., Weber, R.L., Lou, K., Hua, D.H., Perchellet, J.P., 2004. Antitumor triptycene bisquinones induce a caspase-independent release of mitochondrial cytochrome c and a caspase-2-mediated activation of initiator caspase-8 and -9 in HL-60 cells by a mechanism which does not involve Fas signaling. Anticancer Drugs 15 (10), 929-946.
Petranyi, G., Ryder, N.S., Stutz, A., 1984.
Allylamine derivatives: new class of synthetic antifungal agents inhibiting fungal squalene epoxidase. Science 224 (4654), 1239-1241.
Qin, H., Srinivasula, S.M., Wu, G., Fernandes-Alnemri, T., Alnemri, E.S., Shi, Y., 1999. Structural basis of procaspase-9 recruitment by the apoptotic protease-activating factor 1.
Nature 399 (6736), 549-557.
Rademaker, M., Havill, S., 1998.
Griseofulvin and terbinafine in the treatment of tinea capitis in children.
New Zealand Medical Journal 111 (1060), 55-57.
Reed, J.C., 1997. Cytochrome c: can't live with it--can't live without it. Cell 91 (5), 559-562.
Rice, A.M., Li, J., Sartorelli, A.C., 2004.
Combination of all-trans retinoic acid and lithium chloride surmounts a retinoid differentiation block induced by expression of Scl and Rbtn2 transcription factors in myeloid leukemia cells. Leuk Res 28 (4), 399-403.
Saelens, X., Festjens, N., Vande Walle, L., van Gurp, M., van Loo, G., Vandenabeele, P., 2004. Toxic proteins released from mitochondria in cell death. Oncogene 23 (16), 2861-2874.
Saleh, A., Srinivasula, S.M., Acharya, S., Fishel, R., Alnemri, E.S., 1999.
Cytochrome c and dATP-mediated oligomerization of Apaf-1 is a
prerequisite for procaspase-9 activation. J Biol Chem 274 (25), 17941-17945.
Shi, Y., 2002. Mechanisms of caspase activation and inhibition during apoptosis. Mol Cell 9 (3), 459-470.
Stabellini, G., Brugnoli, F., Calastrini, C., Vizzotto, L., Vertemati, M., Baroni, T., Caramelli, E., Marinucci, L., Pellati, A., Bertagnolo, V., 2004.
Ornithine decarboxylase, polyamines and CD11b expression in HL-60 cells during differentiation induced by retinoic acid. Biomed Pharmacother 58 (6-7), 401-406.
Stennicke, H.R., Jurgensmeier, J.M., Shin, H., Deveraux, Q., Wolf, B.B., Yang, X., Zhou, Q., Ellerby, H.M., Ellerby, L.M., Bredesen, D., Green, D.R., Reed, J.C., Froelich, C.J., Salvesen, G.S., 1998. Pro-caspase-3 is a major physiologic target of caspase-8. J Biol Chem 273 (42), 27084-27090.
Testa, U., 2004. Apoptotic mechanisms in the control of erythropoiesis.
Leukemia 18 (7), 1176-1199.
Tseng, C.J., Wang, Y.J., Liang, Y.C., Jeng, J.H., Lee, W.S., Lin, J.K., Chen, C.H., Liu, I.C., Ho, Y.S., 2002.
Microtubule damaging agents induce apoptosis in HL 60 cells and G2/M cell cycle arrest in HT 29 cells.
Toxicology 175 (1-3), 123-142.
Wang, J., Wei, Q., Wang, C.Y., Hill, W.D., Hess, D.C., Dong, Z., 2004.
Minocycline up-regulates Bcl-2 and protects against cell death in mitochondria. J Biol Chem 279 (19), 19948-19954.
Wei, M.C., Zong, W.X., Cheng, E.H., Lindsten, T., Panoutsakopoulou, V., Ross, A.J., Roth, K.A., MacGregor, G.R., Thompson, C.B., Korsmeyer, S.J., 2001. Proapoptotic BAX and BAK: a requisite gateway to mitochondrial dysfunction and death.
Science 292 (5517), 727-730.
Woo, S.H., Park, I.C., Park, M.J., An, S., Lee, H.C., Jin, H.O., Park, S.A., Cho, H., Lee, S.J., Gwak, H.S., Hong, Y.J., Hong, S.I., Rhee, C.H., 2004.
Arsenic trioxide sensitizes
CD95/Fas-induced apoptosis through ROS-mediated upregulation of CD95/Fas by NF-kappaB activation.
Int J Cancer 112 (4), 596.
Zhang, L., Fang, B., 2005. Mechanisms of resistance to TRAIL-induced apoptosis in cancer. Cancer Gene Ther 12 (3), 228-237.
Figure Legends:
Figure 1.
Cytotoxic effects of TB in human normal and cancer cells. (A) Human normal keratinocyte (CCD 922SK), (B) A431, or (C) COLO 205 cells were treated with various concentrations of TB (0.01 to 30 μM). The cell viability was determined by trypan blue exclusion assay at the indicated time points after exposure to TB. Results are the means
± S.E.M. of three independent experiments.
Figure 2.
Effects of TB on DNA fragmentation in human A431 and COLO 205 cancer cells.
(A) Human A431 (left) and COLO 205 cells (right) were treated with various doses of TB for 24 h and then assayed for DNA fragmentation. Effect of TB on cell cycle in human A431 (B) and COLO 205 (C) cells determined by flow cytometric analysis. The cells were treated with various concentrations of TB for 24 h. Percentage of cell population in the different phase of the cell cycle were determined using established CellFIT DNA analysis software. Three samples were analyzed in each group, and values represent the mean ± S.E.M.
Figure 3.
Effects of RA and TB on the differentiation and apoptosis of HL-60 cells. (A) HL-60 cells were treated with RA (1 μM, middle) or TB (1 μM, right) for 48 h. Cells were cytospun, and then stained by Wright–Giemsa method. Magnification:
500x; scale bar: 20 μm. (B-C) HL-60 cell differentiation was determined at the indicated time points by monitoring of the CD11b and CD33 expression on the cell surface after exposure to TB or RA (1μM).
(D) For apoptosis assay, the cells were harvested, stained with Annexin V-FITC and PI, and analyzed by flow cytometric analysis as described in “Materials and Methods”. *, P < 0.05 versus day 0.
Figure 4.
Involvement of the CD95 receptor in TB-induced apoptosis. (A) The A431 cells were pre-incubated for 1 h in the presence of PBS, antagonistic anti-Fas ZB4 mAb (10 μg/mL) or agonistic CD95L (1 μg/mL), supplemented with either vehicle (control)
or TB (1 μM), and then incubated for an additional 24 h. The apoptotic cells were determined by annexin V staining and analyzed by flow cytometry. The number of the apoptotic cells was expressed as a percentage of total cells. The values are means ± S.E.M. of three independent experiments. (B) The top insets represent the microscopic observations of the immunofluoresencent staining in A431 cells treated with TB (1μM). Mitochondria membrane depolarization in TB-treated HL-60 cells was measured by JC-1 staining.
In the lower panel, HL-60 cells were treated with TB (1 μM), RA (1 μM), Valinomycin (Val, 200 μM), or CCCP (200 μM) for the indicated time points. After drug treatment, the A431 cells were stained with JC-1 (1 μg/ml). Results were expressed as a change in the ratio between red JC-1 fluorescence (Em 590 nm), and green JC-1 fluorescence (Em 535 nm) over time. Each point represents the mean ± S.E.M. from three experiments. (C) The A431 cells were treated with TB (1 μM) for the indicated time points. The protein levels of the cytochrome c released from mitochondria into cytosol and the percentage of apoptotic cells were then determined. Annexin V-stained cells were counted as apoptotic cells and expressed as a percentage of total cells. The values are means ± S.E.M. of three independent experiments. Top inset:
the representative bands of cytochrome c detected by Western blot analysis.
Figure 5.
Effects of TB on the expression levels of mitochondria Bcl-2, Bax, and the caspase-9-associated Apaf-1 proteins. (A) The A431 cells were treated with 10 μM TB at the indicated time points for 24 hr. Protein extracts from the cytosolic and mitochondrial fractions were isolated from the TB-treated A431 cells followed by immunoblotting analysis. Expression of the Bcl-2 and the caspase-9-associated Apaf-1 protein were determined by Western blot analysis, and the β-actin expression was served as a protein loading control. (B-D) Protection effect of Bcl-2 overexpression on the TB-induced apoptosis in the A431 cells.
(B) The inset shows a representative Western blot result of Bcl-2 protein in A431 cells transfected with Bcl-2 (pBcl-2) or control (pcDNA3) plasmid. The A431/Bcl-2 and A431/pcDNA3 were then treated with TB in a dose-dependent (0.1-30 μM) manner for 24 hr. Annexin V-stained cells were counted as apoptotic cells and expressed as a percentage of total cells. The values are means ± S.E.M. of three independent experiments. Significant results were compared to the control group by statistic analysis described in the “Materials and Methods” as indicated as * P < 0.05. (C) The Bcl-2 overexpressed (A431/Bcl-2) and the control (A431/pcDNA3) cells were treated with 10 μM TB for 24 h, and the protein levels of the cytochrome c in cytosolic and mitochondria fractions were determined by Western blot analysis. The β-actin protein level was determined and represented as a protein loading control. (D), In vitro study of the effect of Bcl-2 overexpression on TB-induced apoptosis.
Apoptotic cells were quantified by Annexin V-FITC/PI stain and analyzed by flow cytometry as described in the “Materials and Methods.” section. Data points, the mean ± S.E.M. of three independent experiments.
Figure 6.
Dose-dependent activation of caspases in TB-induced apoptosis in A431 cells. (A) A431 cells were treated with TB (0.1-30 μM) for 24 h and the expression of caspase-associated proteins were detected by Western blot analysis. The expression of β-actin protein was examined and served as a loading control. (B) A431 cells were treated with 20 μM TNFα for 48 h. The protein levels of the caspase and Bid were detected by Western blot analysis. (C) TB-induced caspase activities in COLO 205 cells. Cells were treated with 30 μM of TB for various time periods. Caspase activities were measured as described in Materials and Methods. Data represent means ± S.E.M. for three determinations.
Figure 7.
Effects of caspase activation on mitochondria-mediated apoptosis in the TB-treated A431 cells. For the caspase
inhibitors studies, the A431 cells were incubated with 50 μM of inhibitors specific to caspase-8 (zIETD-fmk), caspase-9 (zLEHD-fmk), or the general inhibitor of caspases (zVAD-fmk) for 4 h as indicated at the top of each profile. The HL 60 cells treated with TNFα (20 μM) and FasL (100 ng/ml) in the presence of zIETD-fmk were performed as a positive control. The cells were then exposed to TB at a concentration of 30 μM for an additional 24 h. The control cells were incubated with DMSO without TB or caspase-specific inhibitors. The DNA contents were monitored by flow cytometry as described in the Materials and Methods section.
(Hrs)
0 6 12 24 48
Viability (%)
0 20 40 60 80 100
Figure 1
A
B
C
Control 0.01 µM 0.1 µM 1 µM10 µM 30 µM
(Hrs)
0 6 12 24 48
Viability (%)
0 20 40 60 80 100
(Hrs)
0 6 12 24 48
Viability (%)
0 20 40 60 80 100
Keratinocyte
HL 60
COLO 205
Figure 2
HL 60 COLO 205
0 0.01 0.1 1 10 30 60 120 (µM) 0 1 10 30 60 90 120 150 (µM)
COLO205 COLO205
0 20 40 60 80 100
%
0 1 10 30 60 90 120(µM)
G0/G1 S G2/M Sub G1
0 (µM)
6090120 1030
1
G2/M G0/G1
S
HL 60 HL 60
0 0 20 40 60 80 100
%
0.01 0.1 1 10 30 60 (µM)
(µM) 30
0
10 60 0.11
0.01
G2/M G0/G1 Sub-G1
S
A
B
C
Control RA TB
A
B C
D
% CD11b % apoptosis % CD33
0
0 1 2 3 4 5 (Days) 0 1 2 3 4 5 (Days)
0 1 2 3 4 5 (Days) 5
10 15 20 25
0 20 40 60 80 100
0 20 40 60 80 100 120
RA 1 µM TB 1 µM Control
Figure 3
*
* *
*
* *
* *
* *
*
* *
* *
*
* *
RA Val CCCP TB DMSO
C
TB ZB4 CD95L
- -
- - - -
- - - + + - + - +
+ + +
A
0 10 20 30 40 50 60
% Apoptosis cellsJC-1 590/535 nm
0 6 12 24 48(hrs)
Cytochrome C (Mitochondria) Cytochrome C (Cytosol)
0 0
0 2 4 6 8 10 12 hr 0.5
1 1.5 2 2.5 3
20 40 60 80
TBDMSO
% Apoptosis cells
Figure 4
B
1 2 3 4 5 6
0 hr 3 hr 6 hr 12 hr
TB
Bcl-2
M 0 3 6 12 24
TB (10 µM)
(hrs)
0
0 1 2 3 4 5 Days
0.1 1 10 30 (µM)
Bcl-2
Bax (Cytosol)
Bax
(Mitochondria)
Cytochrome C (Cytosol) Cytochrome C (Mitochondria)
β-Actin β-Actin
Cyto.C (I.P.) Apaf-1 (W.B.)
TB
A
B
Bcl-2
pcDNA3
Bcl-2 pcDNA3
pcDNA3
pcDNA3 Bcl-2
0 10 20 30 40 50
0 20 40 60 80 100 60
% Apoptosis cells
Figure 5
D
C
% Apoptosis
cells
pcDNA3 (TB 10 µM) Bcl-2 (TB 10 µM) pcDNA3 (Control)
TB (10 µM)
Cyto. C oxidase (Mitochondria) Cyto. C oxidase (Cytosol)
1 2 3
+
+
+
+
Figure 6
A
B
Bid
β−actin
pro-caspase 8 TB
pro-caspase 8 (41/43kDa) Bid
tBid
M 0 0.1 1 10 30 (µM)
0 20 (µM) TNFα
pro-caspase 9 (37kDa)
(17kDa)
pro-caspase 3
PARP(85kDa)
β−actin
C
0 9 12 0
10 5
Caspase activity (Fold) 15 20
24 (hr)
Casp-3 Casp-9 Casp-8
Figure 7.
Control TB (30 µM)
Sub-G1: 1.2% Sub-G1: 59.6%
TB + Z-VAD-fmk TB + Z-IETD-fmk
Sub-G1: 8.3% Sub-G1: 62.1%
TB+Z-LEHD-fmk
Sub-G1: 6.5%
TNF-α
TNF-α + Z-IETD-fmk CD95/FasL CD95/FasL + Z-IETD-fmk
Sub-G1: 72%
Sub-G1: 7.8% Sub-G1: 54.2% Sub-G1: 6.1%