86
Designing a Cardiovascular Image and Information Management System for Today’s Healthcare
Jui-Kun Chen, Ph.D.
Department of Computer Science & Computer Security East Stroudsburg University of Pennsylvania
200 Prospect Street East Stroudsburg, PA 18301-2999
jchen@po-box.esu.edu Abstract
Heart-related disease is one of the leading causes of death in the U.S. Will a well-engineered CIIMS assure better services at a cardiology department? What are the major components of a CIIMS? In this paper, the design of a CIIMS system that meets today’s healthcare environment is described in detail. This CIIMS contains four major components: image viewing and manipulation, image analysis, reporting, and integrity checking, each of which is described in sequence in the paper. Remarks on implementation and performance are also briefly included.
Keywords:Medical Informatics, Cardiovascular Image and Information Management System, HL7, DICOM 1. Introduction
Today’s hospitals are networked with neighboring hospitals composing a hospital campus, connecting clinics, government health agencies, insurance companies, hospital information systems, and so on.
Patient data, diagnostic images, measurement results, and final reports should be made available, quickly and correctly, to necessary parties, possibly including patients, nurses, referring doctors, and reading doctors.
Because in remote areas there may not be enough reading doctors to be present at each clinic site to perform examinations in person, doctors are mobile.
Thus, there is a need for the doctors to be able to access the exam data remotely to perform the reading. With these goals in mind, a CIIMS should use healthcare information technologies to provide better services for
today’s healthcare environment [1].
Current healthcare IT technologies can answer only some of the needs specified above. HL 7 and DICOM [2]
are two technologies most used in today’s healthcare. HL 7 is an ASCII-based messaging format for communicating non-image based medical data, such as insurance billing, sharing examination results, and scheduling. DICOM, on the other hand, provides a standard format for storing image files of various modalities, including Ultrasound, Nuclear Medicine, Magnetic Resonance, Catheterization, and so on.
DICOM also provides a communication protocol for transmitting medical images. The image transmitted is organized as a relational-based DICOM information model, which is an ER model. Recent developments in DICOM include DICOM Structured Reporting where a standard format for reports is established.
A CIIMS is an object-oriented software used in a cardiology department by cardiologists or cardiac technologists. HL7 and DICOM alone are not enough to build a comprehensive CIIMS. This paper describes the CIIMS the author helped architect and engineer between 2001 and 2004. However, the paper describes only the structure of the CIIMS, but not the implementation details. The CIIMS consists of the following components:
image viewing and manipulation, image analysis, reporting and integrity checking.
87 2. Modalities
The CIIMS manages patient database records that contain, besides patient demographics, the following types of images: 2-D echo, M-Mode, Doppler, Color Doppler, Vascular, Nuclear, CT, MRI, Cath, and ECG [3].
3. Image Viewing & Manipulation
The CIIMS uses a viewing module to display patient records, including patient demographics and study images. The module:
• Supports DICOM as well as non-DICOM images, be it single frame or multiple frames (called a loop),
• Maintains aspect ratio,
• Calibrates images using either DICOM tags or using a software-assisted calibration process that depends on the type of images,
• Provides quad-view, and synchronizes the loop while displaying the quad-view,
• Can display multiple images side-by-side,
• Is able to open multiple studies at the same time for comparison,
• Uses a thumbnail window to visualize the structure of an exam study,
• Is able to change the display setting,
• Is able to export images to other formats, such as JPEG, TIFF, BMP, AVI, or MPEG I, II, (video stream only)
• Provides region of interest (ROI), and
• Is able to display in dual monitors.
Here is a short note on exporting images to MPEG. A software-based MPEG encoder is used because it offers hardware independence. MSSG [4] MPEG encoder, MPEG Software Simulation Group, is a good implementation and publicly available for free. The software is able to encode in MPEG 1 and MPEG 2 formats.
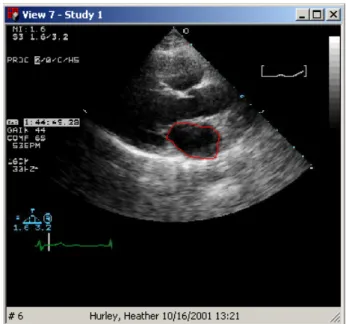
4. Analysis
The CIIMS provides an analysis module that allows users to perform measurements on study images. The measurement is designed to obtain quantitative information from cardiovascular images. Examples of such information are Aortic Valve (AV) Peak Velocity, Left Ventricle (LV) Diastolic Diameter Base LX, and LV Systolic Volume. Measurement methods are provided for 2D, Doppler, M-Mode, Vascular and Color Doppler images. All of these measurements involve using the mouse to position the cursor over the image and left clicking when appropriate. Basic types of measurements include: 2D Length, 2D Polyline Length, 2D Area, Volume, Doppler Velocity, Doppler Time, Doppler Slope, Velocity Time Integral, M-Mode Length, M-Mode Time, M-Mode Slope, Manual Percent Stenosis, Automatic Artery Trace, and Manual Artery Trace. Table 1 describes the measurement methods in more detail. The CIIMS also provides a math calculator module that allows users to define a math equation for a variable.
After measurement is done, the CIIMS calculates the value of the variable based on the equation. There are hundreds of equations built in the CIIMS.
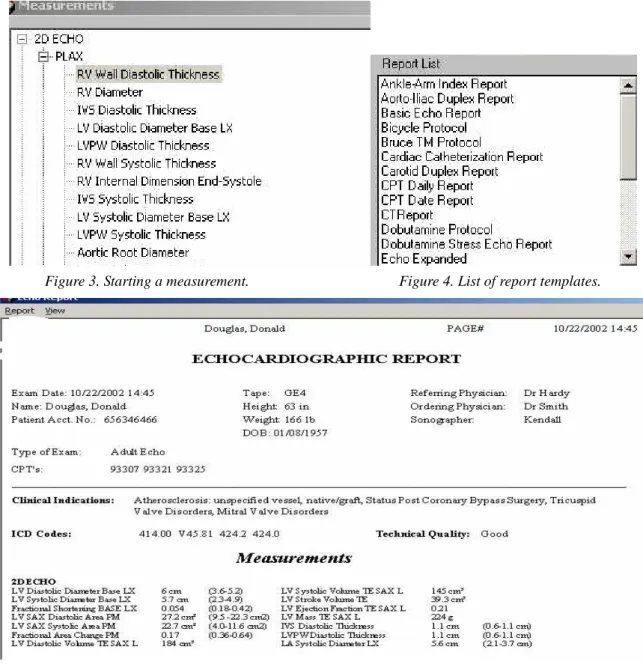
5. Reporting
Reports provide a summary of the measurement done on a particular study. Measurements are included in the report. There are many different types of reports available, and the user has the option of creating a customized report to meet their specific needs. A typical echocardiographic report will begin with header information and patient demographic information. A list of specific indications and the corresponding ICD codes are also included. They are followed by sections that correspond to the major categories appearing in Table 1.
The measurements are followed by a comment section.
After the measurement is done, the user can choose to view a report by selecting one of several report templates provided. At this stage, the “real” report is
88 generated. The user can then interact with the report and choose to save the report. When the report is saved, so too is a snapshot of the report; meaning the values for each control in the window is saved.
6. Data Integrity
Integrity of patient records (including patient demographics and study images) are major concerns in medical software. There are several situations where computerized patient records might not maintain its integrity. For examples: medical images belonging to patient A might have been misplaced in patient B’s record; exam reports for patient C is misplaced in patient D’s record. These are easy mistakes to make because medical images as well as reports are just files in the file system. Anyone who has access to the computer can move the files to other directories easily. The CIIMS has two ways of performing integrity checking: on-line and off-line. The off-line one is a standalone utility that runs at a site and checks every record for every type of data integrity that it is programmed to check. Any integrity violation is then dealt with separately. The on-line mode works as follows. When a study is opened, any existing reports for the study will be checked for integrity. If there is an integrity violation, the report generation for the study will not work until the integrity problem is fixed.
Types of integrities include: same name confirmation between demographics and DICOM images in a record.
Same Medical Record Numbers (MRN) between demographics and DICOM images in a record. These integrity checks consider typo, and as well as words that sound similarly. If two strings are the same except one typo between them, then the two strings are considered the same. If two words sound similarly, then they are considered the same. Dynamic programming is used to compute typos, while Soundex coding [5] is used to encode how a word sounds.
7. Implementation Remarks
The CIIMS is implemented with the class library Microsoft Foundation Class and various relational database servers, including Access, SQL Server, and Oracle Server. Windows file systems are used to store study images. Database programming is done in Microsoft ADO class library. The CIIMS is written in C++.
8. Discussions and Conclusions
A complex, efficient, and secure CIIMS was described in this paper. The four major components are: viewing and manipulation, analysis, reporting, and integrity. Viewing and analysis not only emulate what’s provided by image acquisition devices, but also provide more powerful functionalities that are too cumbersome to perform on ultrasound machines, such as performing a measurement based on a new equation recently designed by a medical doctor at a research hospital.
Because the performance of this CIIMS is only limited by the workflow at a specific practice, the CIIMS provides a better turn-around time for the reports to arrive at relevant parties. Even though a scientific analysis has not been conducted to compare the performance of a CIIMS-based with a non-CIIMS cardiology department, a workflow that involves a well-engineered CIIMS will certainly have positive impacts on reducing the turn-around time for the exam reports.
9. References
1. H.K. Huang (2004), PACS and Imaging Informatics, 2nd ed., Portland, Ore, Wiley-Liss.
2. H. Oosterwijk (2002), DICOM Basics, 2nd ed., Aubrey, TX, OTech.
3. H. Feigenbaum (1993), Echocardiography, 5th ed., Philadelphia, PA, Lippincott Williams & Wilkins.
4. MSSG MPEG, http://www.mpeg.org/MPEG/MSSG/.
5. Soundex, http://www.archives.gov/
research_room/genealogy/census/soundex.html
Figure 1. A 2-D echo image. Measurement is in progress.
Figure 2. A cath image.
Name Image Type
Units Purpose
Length 2D Distance Measure the distance between two points
Polyline Length 2D Distance Measures the distance of a polyline, a line made up of several line segment
Area 2D Area Measures the area encompassed within a set of points forming an enclosed area
Volume 2D Volume Measure the volume encompassed within a set of points forming an enclosed area given a length, or within perpendicular areas
Velocity Trace Doppler Velocity Traces the outline of a Doppler echo. Used for measuring velocity as a function of time
Doppler Time Doppler Time Measures the time between two points on a Doppler image Doppler Slope Doppler Acceleration Measures the rate of change of a velocity profile, or acceleration Velocity Time
Integral
Doppler Velocity Given a Doppler trace, measures the velocity-time integral
M-Mode Length M-Mode Distance Measures the distance (vertical) between two points on an M-Mode image.
M-Mode Time M-Mode Time Measures the time horizontal between two points on an M-Mode image
M-Mode Slope M-Mode Velocity Measures the rate of change of a distance, or a velocity Artery Trace 2D Distance and
area
Given the outlines of the sides of an artery, measure the length, the area and the percent stenosis
Table 1. Types of measurement methods.
89
Figure 3. Starting a measurement. Figure 4. List of report templates.
Fig. 5. A sample echo report. Note the measurement section.
Fig. 6. Select a patient.
90