Preparation and Characterization of Nanostructured Tin Oxide
Films by Electrochemical Deposition
S. T. Chang, I. C. Leu,zand M. H. Hon
Department of Materials Science and Engineering, National Cheng Kung University, Tainan, Taiwan
In this study, a novel process for depositing tin oxide thin films by electrodeposition has been developed. Amorphous phase of the as-deposited film was obtained at the temperature of 85°C. Nanocrystalline SnO2having tetragonal structure with a grain size in the range of 4 to 7 nm was obtained by heat-treatment at 400°C in a vacuum for 4 h. Porous, dense, and uniform morphologies for the deposits can be obtained by controlling current density during deposition. Results of infrared spectra, X-ray diffraction, scanning electron microscopy, and transmission electron microscopy analyses were described and correlated with the process of deposition and characteristics of the resulting SnO2films.
© 2002 The Electrochemical Society. 关DOI: 10.1149/1.1485808兴 All rights reserved.
Manuscript submitted February 3, 2002; revised manuscript received March 26, 2002. Available electronically May 22, 2002.
Electrodeposition is a powerful and interesting process that can be applied in numerous fields. Films and powders can be synthe-sized at a low temperature by electrodeposition because of the high energy density accumulated in solution near the electrode surface. The advantages of electrodeposition compared with other techniques include low process temperature, low cost for raw materials and equipment, capability of controlling composition and morphology by electrochemical parameters, and the ability to deposit films on a complex surface. Electrodeposition has already been commonly em-ployed to prepare metallic coatings for more than one hundred years. In recent years, metal oxides synthesized by electrodeposition including zinc oxide,1,2zirconium oxide,3bismuth oxide,4tungsten oxide,5and metal oxide composites6have been an active research area. In particular, through proper parameter control, deposited ma-terials from nanostructured coatings to even epitaxial films7 with superior properties can also be achieved.
Tin oxide is one of the ceramic materials that is widely used because of its excellent properties for catalysis, gas sensor as anode materials of secondary lithium batteries, and as transparent conduc-tive films for displays and solar cells. The interesting characteristics and related applications were dominated by several factors, such as morphology, grain size, crystallinity, and so on. For the electrodepo-sition of metal oxides, it is necessary for the hydroxyl ions or O⫺ radicals to be present near the electrode surface. Previous research reported several oxygen sources, including hydrogen peroxide,2 ni-tric acid,1and blown oxygen,8which are the necessary components for electrodepositing metal oxides. If nitric acid is chosen as the oxygen source, the half-reaction on the cathode electrode surface is expressed as follows9
NO3⫺⫹ H2O⫹ 2e⫺→ NO2⫺⫹ 2 OH⫺ 关1兴 or
NO3⫺⫹ 7H2O⫹ 8e⫺→ NH4⫹⫹ 10 OH⫺ 关2兴 The hydroxyl groups are formed on the electrode surface and con-tact with metal ions coming from the solution to synthesize metal hydroxide or metal oxide according to Reaction 3
Mn⫹⫹ nOH⫺→ M共OH兲
n→ MOn/2⫹ n/2H2O 关3兴 Because of low solubility, the metal hydroxide precipitates on the electrode surface rapidly. If the deposition temperature is higher than a critical temperature, metal hydroxide dehydrates and then metal oxide is synthesized. Because Sn is an amphoteric element,10 stannic or stannous ions react with hydroxyl groups to form SnO3
2⫺
or Sn共OH兲62⫺or other tin-based salts instead of metal oxide共or metal hydroxide兲. Therefore, the mechanism of electroplating tin oxide may be more complex than that mentioned above.
Although electrodeposition has been successfully employed for the preparation of coatings and powders of many metal oxides, to our knowledge, no electrodeposition process has been reported that is able to prepare the tin oxide films. The advantages of electrodepo-sition mentioned above, such as low cost, low temperature, and capability of obtaining nanocrystalline microstructures, also can be expected in electrodepositing tin oxide. Therefore, a novel process to deposit tin oxide by electrodeposition was conducted in this study. The structure characterization and phase identification were performed by X-ray diffraction共XRD兲, the bondings of the product in electrochemical reaction were determined by Fourier transform infrared 共FTIR兲 spectroscopy, the morphology was observed by scanning electron microscopy共SEM兲, and the grain size was deter-mined by transmission electron microscopy共TEM兲.
Experimental
The solutions for electrodeposition were composed of 20 mM tin dichloride共Riedel-de Hae¨n, 99.8%兲, 100 mM sodium nitrate 共99%兲, 75 mM nitric acid 共J. T. Backer, A.C.S. reagent兲, and redistilled water. The mixed solutions were held at a bath temperature of 85°C for 3 h in order to obtain a stabilized solution. The working elec-trode was a copper disk共Alfa Aesar, 99.8%兲 of 1 cm diam, which was cleaned with acetone and dilute hydrochloride acid solution. The electrochemical cell for deposition was a conventional three-electrode cell in which a tin metal plate共Aldrich, 99.9%兲 was used as the counter electrode with a separation from the working elec-trode by 2 cm. An Ag/AgCl elecelec-trode in a 3 M NaCl solution was used as the reference electrode. Films were deposited using a poten-tiostat共EG&G, model 263A兲 with current densities ranging from 1 to 15 mA cm⫺2. Duration of 10-200 min for electrodeposition has been chosen. The deposits were washed with water and then im-mersed in deionized water to leach the remaining chloride impurity. The specimens were dried at room temperature and some of them were heat-treated at 200 and 400°C, respectively, for 4 h. Samples were heat-treated in vacuum to inhibit the oxidation of the copper substrates and then were analyzed further in order to reveal the phase evolution and characteristics of the deposits.
Infrared analysis of the samples was performed on a Jasco FTIR 460 spectrometer. The deposited films were scraped off as powders from the substrate and mixed with potassium bromide powders as reference for FTIR analysis. Spectra were obtained at a resolution of 4 cm⫺1. Phase of the films was characterized by XRD 共Rigaku, model D/MAS III. V兲 with a monochromatic Cu K␣ radiation 共1.5405 Å兲. Surface morphology and structure of the coatings were analyzed by means of SEM共Philips XL-40FEG兲 and TEM 共JEOL AEM 3010 microscopy兲, respectively. Grain size was calculated by the X-ray line broadening method using the Scherrer formula of D
zE-mail: [email protected]
Electrochemical and Solid-State Letters, 5共8兲 C71-C74 共2002兲 0013-4651/2002/5共8兲/C71/4/$7.00 © The Electrochemical Society, Inc.
C71
⫽ 0.89/ sin , in which D is crystallite size, is wavelength of X-ray, and is diffraction peak angle,11 and film thickness was controlled at about 10 m. Samples for XRD, FTIR, and TEM analysis were prepared at a current density of 10 mA cm⫺1.
Results and Discussion
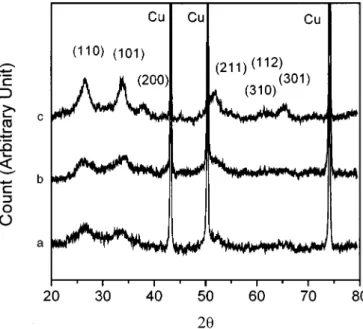
Figure 1 shows the X-ray diffractograms of the films prepared at a current density of 10 mA cm⫺2 before and after heat-treatment. Pattern a in Fig. 1 shows the characteristic peaks of the as-deposited sample, and patterns b and c represent the peaks for samples heat-treated at 200 and 400°C, respectively, for 4 h. Except for the peaks of copper substrate, all the peaks in pattern a could be indexed as the tetragonal SnO2. Stannous ions in nitric acid solution were oxidized by nitric acid ions or oxygen to stannic ions, which were the source of metal ions for the as-deposited SnO2. These broad peaks in pat-tern a indicate the possibility of either the low degree of crystallinity of SnO2or the ultrafine particle size of the deposits. Patterns a and b are almost the same, which indicates that essentially no significant crystallization occurred as the sample was heated at 200°C. When the heat-treating temperature was raised to as high as 400°C, peaks of SnO2 became more sharp, possibly because the crystallinity of the deposits was promoted. In pattern c, the tetragonal structure of SnO2can be determined more clearly and no other crystalline im-purity peak can be observed. The mean grain size for the sample after the 400°C heat-treatment as calculated by the Scherrer formula is about 5.1 nm; however, there is no significant difference about the size of the grains for the coatings obtained under different current density. Because we still could not know exactly whether the as-deposited film is a mixture of oxide and hydroxide or oxide with adsorbed water molecules, the FTIR analysis could be a powerful tool for chemical bonding determination.
Figure 2 shows the FTIR patterns of the as-deposited specimen and the samples heat-treated at 200 and 400°C for 4 h, respectively. In spectrum a, the adsorption peak at 593 cm⫺1is characterized as the vibration absorption of the Sn-O bond in SnO2. Since the stretching adsorption of the O-H bond appears at 3363 cm⫺1, the composition of the as-deposited film could be both stannic oxide and stannic hydroxide. Because there is no Sn-OH bond adsorption peak located at 530 cm⫺1共labeled by an arrow兲,12the O-H peak could be attributed to the adsorption of water molecules on tin oxide. Accord-ing to the analysis, the as-deposited film is stannic oxide with
ad-sorbed water molecules. The peak at 3169 cm⫺1was characterized as the adsorption of N-H bond in ammonium ion, because the elec-trochemical reaction described by Eq. 2 and the oxidation of stan-nous ion by nitric acid could be the source of ammonium ions. The number and position of N-H adsorption peaks can reflect the possi-bilities of hydrogen bonding within the crystal.13A broad N-H ad-sorption peak in the range from 3100 to 3200 cm⫺1shows some degree of hydrogen bonding, which can be attributed to the adsorp-tion of ammonium ions on tin oxide as described in a former report.14Heat-treatment at 200°C for 4 h results in the partial de-sorption of adsorbed ammonium ions and water molecules. When the heat-treating temperature was 400°C, spectrum c shows an ab-sence of NuH and OuH bonds, and SnO2 was the only product after 400°C heat-treatment. The adsorption peak of SnO2shifts from 593 to 656 cm⫺1gradually when the heat-treating temperature was increased from 200 to 400°C. Besides, the presence of the adsorp-tion peak appearing at about 2350 cm⫺1in spectra b and c indicates the interference of nitrogen gas.
The TEM micrograph and diffraction rings for electron diffrac-tion from SnO2films as heat-treated at 400°C for 4 h in vacuum are shown in Fig. 3. The bright field image shows equiaxial and even spherical grains with a dimension between 4 and 7 nm. The ultrafine grains were observed in all specimens deposited at different current density. The result of grain size measurement from TEM observation is similar to that from X-ray line broadening method. It is interesting to find that for the electrodeposition of tin oxide, the grain size is much smaller than most of the other oxides prepared by different processes.15,16 Under the condition of ultrafine grain size, oxide coatings could still be observed as well-defined crystallites, and te-tragonal structure of the SnO2also can be characterized by indexing the ring pattern. In the bright field image for the as-deposited sample, the shape of grains is similar to that shown in Fig. 3, but with rather different characteristics. An amorphous phase was ob-tained because of the presence of a hollow ring instead of a diffrac-tion ring or a spot pattern. According to the shape and crystallinity of the as-deposited SnO2, it is suggested that the SnO2might pre-cipitate from a process similar to a chemical reaction involving the formation of SnO2; meanwhile, the amorphous grains might be formed from the hydrolysis of stannic ions. The ultrafine particles
Figure 1. X-ray diffractograms of SnO2films prepared at a current density of 10 mA cm⫺2for共a兲 as-deposited, and heat-treated in vacuum at 共b兲 200
and共c兲 400°C. Figure 2. Infrared spectra of SnO2films prepared at a current density of 10
mA cm⫺2for共a兲 as-deposited, and heat-treated in vacuum at 共b兲 200 and 共c兲 400°C.
Electrochemical and Solid-State Letters, 5共8兲 C71-C74 共2002兲 C72
can be attributed to a repeated nucleation process on the electrode surface. SnO2nuclei then aggregated into larger particles, and later stacked to form the SnO2coatings.
The morphologies of as-heat-treated SnO2films prepared at dif-ferent current densities are shown in Fig. 4. Even for samples ob-tained from different current densities, the morphologies of the as-heat-treated and the as-deposited samples are almost the same, except for the formation of some cracks. The sample prepared at 1 mA cm⫺2is a smooth and transparent film observed by the naked eye and under lower SEM amplification, but under higher magnifi-cation of 20,000 times, the surface exhibits a bit of roughness. As the current density was higher than 5 mA cm⫺2, fine grains aggre-gated and formed a porous surface. For deposition current density at 5, 10 and 15 mA cm⫺2, larger nodules resulting from aggregation of fine particles were obtained with the average sizes of 60, 100, and 150 nm, respectively, as shown in Fig. 4b, c, and d. When the current density was higher than 15 mA cm⫺2, the voltage was raised to higher than⫺0.7 V, the nitric acid ions near the electrode were
consumed and then hydrogen gas formed. As a consequence, SnO2 coatings with cracks then started to peel off the substrate because of the evolution of hydrogen gas.
A region of higher pH value was formed when hydroxyl groups were produced from nitric acid. As far as we know, in the absence of complex ions in aqueous solution, stannic ions tend to give a pre-cipitate of hydrous tin共IV兲 oxide, which is easier to precipitate with increasing pH value.10 Because of the phenomenon mentioned above, the region of higher pH value near electrode surface, which can contribute to the formation of hydroxyl groups, is the precipita-tion zone for tin oxide. When the current density was as low as 1 mA cm⫺2, the rate of hydroxyl group generation was too slow to substantially promote pH value of the precipitation zone, and tin oxide precipitated at these positions very near the electrode surface. Therefore, a dense and smooth film gradually formed as shown in the Fig. 4a. Larger current densities resulted in formation of more hydroxyl groups on the electrode surface and pH value of the pre-cipitation zone was higher. As a result of the rate of hydroxyl group generation and mass transport the regions suitable for hydroxide precipitation was wider than that for lower current density. There-fore precipitation of SnO2 was easier and faster, which consumed more stannic ions near the electrode, and a gradient of stannic ions was thus formed. It is possible for SnO2to precipitate far from the electrode surface because of higher pH value and the presence of a stannic ion concentration gradient. Under such a situation, many protrusions of SnO2were formed on the electrode surface, and more hydroxyl groups were generated near them. The protrusions of SnO2 were expected to contact the zone with more hydroxyl groups and stannic ions than that in the other areas. Therefore, most SnO2 par-ticles deposited on protrusions preferentially and then the SnO2film tended to grow toward the bulk solution from such places. Because of the above-mentioned behavior, morphologies turned from a smooth surface into a porous surface with increasing current density as shown in Fig. 4b, c, and d. Since tin is an amphoteric element, its chemical state is quite complex in a solution having varied pH value near the cathode during the electrodeposition process. The mecha-nism for the electrodeposition of tin oxide requires further study, and the work is under progress.
Conclusion
Nanostructured SnO2was prepared successfully on copper sub-strate by electrochemical deposition. The results of FTIR, XRD, TEM, and SEM are used to characterize the electrodeposition pro-cess and the resulting oxide films. The ultrafine grains, ranging be-tween 4 and 7 nm, can be attributed to the repeated nucleation events of precipitation of SnO2 on the electrode surface. At a low temperature of 85°C, the as-deposited films were synthesized with only a low degree of crystallinity, but it can be greatly promoted by heat-treatment at 400°C. Absorbed ammonium ions and water mol-ecules can be burned out by heat-treatment at 400°C in a vacuum, and the tetragonal SnO2was the only product. Both dense and po-rous SnO2 could be prepared by changing current density, and a porous surface can be prepared at the current density range of 5-15 mA cm⫺2. When the current density was higher than 15 mA cm⫺2, SnO2film started to peel off due to the evolution of hydrogen gas.
Acknowledgments
The authors gratefully acknowledge the financial support by the National Science Council of Taiwan, Republic of China共grant no. 89-2216-E-006-072兲.
National Cheng Kung University assisted in meeting the publication costs of this article.
References
1. M. Izaki and T. Omi, J. Electrochem. Soc., 143, L53共1996兲. 2. S. Peulon and D. Lincot, Adv. Mater., 8, 3817共1996兲. 3. I. Zhitomirsky and L. Gal-Or, J. Mater. Sci., 30, 15共1995兲.
4. E. W. Bohannan, C. C. Jaynes, M. G. Shumsky, J. K. Barton, and J. A. Switzer, Solid State Ionics, 131, 97共2000兲.
Figure 3. TEM micrograph and diffraction rings of SnO2film prepared at a
current density of 10 mA cm⫺2and heat-treated at 400°C for 4 h in vacuum.
Figure 4. SEM micrographs of SnO2 films electrodeposited at a current
density of共a兲 1 mA cm⫺2,共b兲 5 mA cm⫺2,共c兲 10 mA cm⫺2, and共d兲 15 mA cm⫺2.
Electrochemical and Solid-State Letters, 5共8兲 C71-C74 共2002兲 C73
5. J. N. Yao, P. Chen, and A. Fujishoma, J. Electroanal. Chem., 406, 223共1996兲. 6. A. Dierstein, F. Mater, H. Natter, H. O. Stephan, Ch. Kropf, and R. Hempelmann,
Scr. Mater., 44, 2209共2001兲.
7. Th. Pauporte´ and D. Lincot, Appl. Phys. Lett., 75, 3817共1999兲. 8. Th. Pauporte´ and D. Lincot, Electrochim. Acta, 45, 3345共2000兲. 9. G. Helen, A. Therese, and P. V. Kamath, Chem. Mater., 12, 1195共2000兲. 10. P. J. Smith, Chemistry of Tin, 2nd ed. p. 63, Blackie, London共1998兲.
11. H. Klug and L. Alexander, X-Ray Diffraction Procedures for Polycrystalline and Amorphous Materials. p. 618, John Wiley & Sons, New York共1974兲.
12. Handbood of Inorganic Compounds D. L. Perry and S. L. Philips, Editors, p-4170, CRC Press, New York,共1995兲.
13. L. J. Bellamy, The Infra-red Spectra of Complex Molecules, 2nd ed., p. 536, Meth-uen, London共1958兲.
14. F. Berger, M. Fromm, A. Chambaudet, and R. Planade, Sens. Actuators B, 45, 175 共1997兲.
15. S. C. Nam, Y. S. Yoon, W. I. Cho, B. W. Cho, H. S. Chun, and K. S. Yun, Electrochem. Commun., 3, 6共2001兲.
16. A. Gamard, O. Babot, B. Jousseaume, M.-C. Rascle, T. Toupance, and G. Campet, Chem. Mater., 12, 3419共2000兲.
Electrochemical and Solid-State Letters, 5共8兲 C71-C74 共2002兲 C74