A Low Computationally Intensive PEM Fuel Cell Dynamic Model: Membrane Water Content Dynamics Effect Under Square Wave Load Steps
Marcos García-Arregui and Vassilios G. Agelidis, Senior Member, IEEE
School of Electrical and Information Engineering, The University of Sydney, NSW, 2006, Australia Email: [email protected]; [email protected]
Abstract—Computational fuel cell dynamic (CFCD) modeling
is considered the most accurate tool for a better FC design and understanding. CFCD models have already proved the effect of the water membrane content in the dynamic response of a proton exchange membrane (PEM) FC. However, these models require high computational resources and they are not easy to interconnect with the usual electrical circuit simulation software packages. This paper presents a dynamic PEM FC model that takes into account the main phenomena involved in a PEM FC reaction and proves the need to consider the membrane water content dynamics when the FC is excited through square wave load steps. This approach is verified through experimental results with a 1.2 kW Nexa Ballard hydrogen PEM FC system.
Index Terms — Fuel Cell, Proton Exchange Membrane,
Membrane Water Content Dynamics, Dynamic model.N
OMENCLATUREc
O ,Concentration of O
2in the channel mol/m
3c
O ,Concentration of O
2in the reaction
site mol/m
3Cdiff GDL
GDL diffusion equivalent capacitor F
Cdl
Double layer capacitor F
D
eqGDLGDL diffusion coefficient m
2/s
Water diffusion coefficient within the
membrane m
2/s
d
1Water transfer fitting parameter m
2/s E
thEquilibrium potential V EW Equivalent membrane weight kg/mol
Henry’s constant for gas solubility Pa m
3/mol
I Current A
I
0Exchange current A
I
limLimit current A
i Current density A/m
2i
limLimit current density A/m
2F Faraday constant C/mol
k
pHydraulic permeability m
2Oxygen mass flow kg/s
Oxygen molar mass kg/mol
Water molar flux density mol/m
2s N Number of cells stacked in series - n Number of moles of electrons
exchanged -
p
iPressure of gas i Pa
R Ideal gas constant J/K mol
R
actEquivalent activation resistance Ω R
diffEquivalent diffusion resistance Ω
T Temperature K
δ Thickness m
α Activation transfer coefficient - β
GDLDiffusion fitting coefficient -
ρ
memMembrane density kg /m
3ξ Stoichiometric rate -
λ Membrane water content - φ Water transfer coefficient -
σ Conductivity Ω/cm
γ GDL water transfer coefficient m/s
τ Water membrane content time
constant sec
η
actActivation overvoltage V η
diffDiffusion overvoltage V
η
ohmOhmic overvoltage V
Water viscosity N/s m
2ψ Relative humidity -
Molar fraction of component i - Average molar fraction of component
i -
I. I
NTRODUCTIONFuel cells (FCs) are considered as the 21
stcentury energy- conversion devices for transportation, stationary energy generation, and power supplies for portable equipment to mention just few [1]. The need to condition the output of the FC with electronic circuits requires an understanding of all the internal phenomena [2]. It is therefore important to develop FC modeling and different levels of model complexity would be necessary depending upon the application.
The science of the FCs cuts across multiple disciplines,
including material science, interfacial science, transport
phenomena, electrochemistry, and catalysis. Due to the
diversity and complexity of all the phenomena involved,
computational fuel cell dynamic (CFCD) models are currently
the most accurate models available. An excellent review of
CFCD models was presented in [3]. Interesting parametric
studies, where the FC performances were evaluated with the
variation of some FC design parameters, such as the membrane
thickness, gas diffusion layer (GDL) porosity and the thermal
conductivity were proposed in [4] and [5]. A dynamic model
that takes into account the gas dynamics within the FC and
explains the current overshoot and undershoot exhibited by a
FC during voltage step changes was presented in [6]. In a thermal study, it was confirmed that the GDL thermal conductivity, the fed gas relative humidity and the supplied current are the three parameters that control the thermal behavior of an FC [7].
Although the usefulness and accuracy of CFCD models have already been proven, the models remain very complex and require substantial computational resources. In CFCD models, numerical methods such as finite elements and iterative solving loops must be applied. Moreover, the finite element software packages are not adapted to be interconnected with the typical software programs to design electronic circuits, making CFCD models unsuitable for a power system and/or power electronic analysis and design software environment.
In order to solve this problem, three main types of models strategies are available in the technical literature.
One type of models consists of reproducing the FC polarization curve using the properties of some electronic devices available in electrical circuit simulation software packages such as PSPICE [8-10]. The advantages of these models are their simplicity, low computational requirements and the easy interconnection with other electrical devices available in the software package library. However, these models remain valid only under given operating conditions, and they cannot reproduce the polarization curve for changing pressure or varying stoichiometric rate values. Finally, these models have no ability to describe, in physical sense, all the electrochemical phenomena occurred within the FC. These models will be given no further consideration in this paper.
The second type consists of a set of empirical equations that have been proposed to predict the FC polarization curve [11],[12]. The advantage of this approach is the relatively simple way to predict a particular polarization curve. However, on the other hand, the model parameters have to be recalculated for any change in the operating conditions
Finally, the third type of models can be found in [13], [14]
and [15] where the FC polarization curve is calculated taking into account the activation, diffusion and ohmic losses in the FC. These types of models are usually combined with a series of non-linear RC dipoles that reproduce the FC dynamics. The importance of the dynamic introduced by the double layer capacitor when considering the design of power converters was studied [2] and was extended in [16] to include the gas diffusion through the GDL in a pure-hydrogen pure-oxygen fed FC [17]. A similar approach by modeling the FC dynamics with series of non-linear RC impedances was followed in [18].
No other dynamics associated to the FC behavior have been reported in this type of models.
Nevertheless, other technical papers [19],[20] have reported experimental measurements where transient overvoltages following square-wave load current steps occurred. In reference [19] this phenomenon was related to the membrane water content evolution with current variations through CFCD models, and it was proved that the water requires some time to flow from the membrane towards the exhausting channels.
Hence, this seems to confirm the existence of another dynamic neglected by [16-18], where the FC models have been mostly tested under steady-state operating conditions through impedance spectroscopy [17],[18],[21] (same operating points
where dynamics associated to high amplitude current variations are not exhibited).
The objective of this paper is to present a model for a hydrogen-air fed PEM FC that takes into account phenomena such as: the membrane water content, gas transport, and electrochemical phenomena. Specifically, the insertion of the water membrane dynamic in the proposed model reproduce results similar to the ones obtained in [19] and confirms the relation between the voltage overshoots and the membrane water content dynamics. The model requires reasonable computational intensity and remains easy to interconnect with widely available electrical circuit simulation packages.
Experimental results taken with a 1.2 kW Ballard Nexa PEM FC power module are provided and confirm the validity of the proposed approach.
The paper is organized as follows. Section II presents the static FC model. Section III considers the FC dynamic modeling and Section IV presents the simulation and experimental results. Finally, conclusions are summarized in Section V.
II. S
TATIC FUEL CELL MODELThe main assumptions made for the static FC model are as follows:
1) The model is one-dimensional (1-D).
2) The stack is considered isothermal, which implies that the whole stack has the same temperature.
3) No parasitic reaction is taken into account.
4) The gas transportation losses through the channel are neglected.
5) The gas diffusion is considered in steady state.
6) No aging of the stack is considered.
The FC stack voltage V
FC STACKis described as the equilibrium voltage E
th(termed as Nerst voltage) from which losses η are deducted. These losses are commonly called as overvoltages in the electrochemical community [16]. The model can be described as follows:
(1) where N is the number of cells stacked in series. This model assumes the equivalent average cell principle [16] where the whole stack is modeled with a single cell.
A) Equilibrium potential
The equilibrium potential is determined using the Nernst equation [20]. It represents the chemical energy conversion into electricity. It depends on the gas pressure p and the stack temperature T.
1.229 0.83 10 298.15
4.38 10 (2)
B) Activation losses
The activation overpotential translates in simple way the
chemical reaction kinetics laws for both electrodes. The
activation overpotential is associated with the activation energy
required to initiate a charge transfer. The charge transfer can be
represented with a Butle-Volmer law relating the current
density in a redox reaction to the corresponding overpotential at
a given electrode as a function of the reference exchange current I
0. The expression for the activation losses is presented in eqn. (3) [22].
η (3)
where α is the transfer coefficient of the electrochemical reaction. The temperature dependence of I
0can be expressed as follows [23]:
I
0T
I
0353 K =exp 0.014189 T-353 (4)
C) Ohmic losses
The ionic overpotential is due to the resistance in proton transport within the polymer electrolyte membrane. However, through the membrane protons and water molecules flow.
Furthermore, the membrane ionic resistance depends on the number of water molecules available in the membrane. The Nafion 117
©membrane needs to be hydrated in order to be an ionic conductor. The water content λ of a substance in contact with a humid atmosphere identifies the value of the overall membrane resistivity. The estimation of λ is further developed in the following section F entitled Water management). For the Nafion 117
©, experimental results obtained by [24] give the membrane conductivity as a function of λ and T expressed as:
0.5139 0.326 1268 1
303
1 (5)
which yields to
(6)
D) Diffusion losses
The diffusion overvoltage represents the losses due to the gas diffusion through the electrode. Most papers in the technical literature present the diffusion overvoltage being dependant on the limit current I
lim[13],[14],[2].In this model, only the cathode diffusion losses are considered.
η
diff= RT
nF ln 1- I
I
lim(7)
where β
GDLis one parameter introduced by [2] that allows model fitting to measurements obtained through the experimental results.
If the convection driven from the gas channel to the GDL phenomenon is neglected, the gases transfer from the gas channel to the activation layer involves two distinct transport mechanisms [25]:
− The gas diffuses from the GDL region adjacent to the gas channel towards the reaction site (Fick’s law).
− The gas dissolves into the membrane phase-water mixture covering the reaction site (Henry’s law).
Applying Fick’s law, the oxygen concentration in the GDL is expressed as
, ,
(8)
If the dissolution losses are considered, the gas concentration in the reaction site s is:
, ,
(9)
The limit current density i
limis the current density that can be obtained before the oxygen concentration drops to zero in the reaction site. Hence, this yields to
,
(10)
Using eqn. (10) into eqn. (9) yields
, ,
1 (11)
It is now possible to write the cathode diffusion overvoltage expression as a function of the gas concentration in the gas channel as follows:
,
,
(12)
E) Mass balance
Eqns. (11) and (12) calculate the diffusion losses as a function of the oxygen concentration in the cathode reaction site and in the gas channels. Thus, one expression relating the inlet gas mass flows and the gas concentration in the channels must be established.
The stoichiometric rate ξ can be defined as the amount of reactant in the chamber gas fed divided by the amount required by the electrochemical reaction.
(13) The cathode inlet gas composition is defined as follows:
(14)
0.2 1 (15)
0.8 1 (16)
where p
satis the water saturation pressure for a given temperature T and p
Lis the overall pressure.
The membrane is imperious to gases, and therefore, hydrogen and oxygen only flows from the bipolar plates to the anode and to the cathode, respectively. Only water can flow through the entire FC. Water fluxes are defined as:
1 2 (17)
2 (18) References [25] and [26] introduce the water transfer coefficient φ. This value measures the water crossing from the anode to the cathode as a function of the water production in the cathode.
2 (19)
Assuming that there is no gas storage in the gas channel, a mass balance on the different species flow rate allows the determination of the average fraction of all species species in the gas channel as a function of the water transfer coefficient φ.
,
1 5 1
1 1 5 0.5
(20)
,
0.5
1 1 5 0.5 (21)
,
4
1 1 5 0.5 (22)
F) Water management
The water content membrane depends on three different phenomena:
− Water transport by diffusion due to a different gradient concentration through the membrane.
− Water transport by convection due to a pressure difference across the membrane.
− Electro-osmotic drag due to electric field and proton flux.
The expression of the water flux across the membrane can be found in [25], [26]
2.5 22
1
(23)
The exact solution to equation (23) can only be obtained by applying numerical methods that will increase the complexity of the model. References [27] and [28] proposed a method to determine the value of the water flux across the membrane as a function of the water content λ in the cathode-membrane and anode-membrane interfaces. The equation typically requires an iterative procedure which is unsuitable for a real-time implementation. The approach proposed in [25] reduced this equation into a third order equation, where analytical solutions are available. Hence, the average membrane water content λ
and the membrane water transfer coefficient φ can be determined as a function of the GDL water transfer coefficient γ and a fitting parameter d
1whose values are determined through experimental procedures. Further information can be found in [26]. Fig. 1 shows the modeled evolution of the water transfer coefficient φ, the membrane water content λ and the membrane resistance as a function of the current.
Figure 1: Evolution of the modeled water transfer coefficient φ, the membrane water content λ and the membrane resistance vs. current.
III. F
UEL CELL DYNAMIC MODELThe main approach for FC dynamic modeling reported in the technical literature is based on the well-known use of the Warburg impedance [21],[17]. However this option cannot be easily implemented in the MatLab/Simulink
®environment. A more suitable approach for the purposes of the modeling considered in this paper was presented in [2], where the FC dynamic model uses a series of RC dipoles. The dynamic behavior associated with the double layer capacitor and the gas diffusion is considered separately. In this paper, a membrane water content dynamic is also introduced.
A) Double layer capacitor
The double layer capacitor C
dlis the equivalent double layer capacitor of the two capacitors which physically exist at each interface between the electrode and the electrolyte. No charge carrier transfer theoretically exists at this interface. The double layer capacitor phenomenon is closely related to the activation phenomenon. Its value is typically determined experimentally.
B) Gas diffusion dynamics
The double layer capacitor is not enough to represent the FC dynamic behavior at low frequencies as shown in [16].
Moreover, experimental results confirmed the impact of the diffusion dynamics in aged FCs. The diffusion dynamic is introduced by C
diff GDLC) Membrane water content dynamics
According to eqn. (22), the membrane water content is a
function of the current supplied by the FC. The membrane
water content evolution with current variations through CFCD
models was analyzed in [19], and it was also proved that the
water requires some time to flow from the membrane towards
the exhausting channels [19]. Moreover, [19] identified
experimentally transient overshoots in the FC voltage when
subjected to negative load steps. The CFCD model explains the
overshoots due to the slow dynamics of the excess water removal from the cathode catalyst layers. Thus, a dynamic behavior must be associated to this phenomenon. In this paper, a first order transfer function with a time constant τ is arbitrarily chosen to describe the variation of the membrane water content λ as it can be observed in Fig. 2.
Figure 2: Proposed FC dynamic model
In order to simplify the model and due to the experimental test bench characteristics, a non dissociated electrodes model is proposed. The experimental installation does not enable to test the FC electrodes separately (only the potential difference at the cell terminals can be measured), and therefore, a model with non-dissociated electrodes (in terms of contribution of the different phenomena to the voltage) is proposed. The proposed FC dynamic model is presented in Fig. 2.
The activation and diffusion losses are modeled with two non-linear current sources which are controlled by the overvoltage expressions presented in eqns. (3) and (12) respectively. The ohmic resistor is function of the membrane water content λ, expressed by eqn. (22). The capacitors C
dland C
dif GDLintroduce the double layer and GDL diffusion dynamics respectively. The model is implemented in MatLab/Simulink
®[29].
IV. S
IMULATIONA
NDE
XPERIMENTALR
ESULTSThe laboratory experimental bench used for this paper is shown in Fig. 3. One HG30 electrolyzer is connected to the AC mains and produces hydrogen that is stored in three solid hydrogen storage canisters. The canisters supply hydrogen to a Ballard Nexa 1.2 kW PEM FC system that is connected to an
active load that plays the role of a programmable current source. The active load imposes the desired current waveform to the FC. A monitoring PC recovers the system measurements and controls the active load through a dSPACE interface [30].
Impedance spectroscopy is the most widely used technique for FC testing and performance evaluation. The accuracy of the RC dipole models while was evaluated through impedance spectroscopy was reported in [21]. However, during impedance spectroscopy, the FC is being tested under constant operating conditions, and therefore, the airflow, the stoichiometric rate and the supplied current remain constant through the duration of the entire test, and thus, not showing their associated dynamics.
Hence, in this case, the FC will be tested under high amplitude square wave load steps in order to observe different dynamic behavior than the one observed through impedance spectroscopy. The FC is connected to an active load which is programmed to impose high amplitude load steps to the FC.
The aim of this experiment is to verify the results obtained by [19] and [20] and check the behavior of the proposed model.
Figure 4: Measured current, airflow and stoichiometric rate during load steps.
As it can be observed in Fig. 4, the FC system compressor cannot supply the required amount of air instantaneously, hence creating overshoots in the stoichiometric rate evolution.
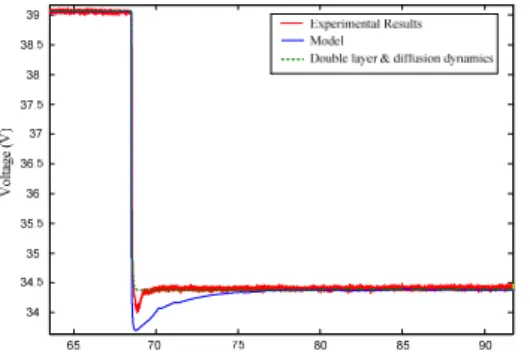
Experimental results presented in Fig. 5 confirm the presence of a voltage overshoot after a negative current step.
As it can be observed, the proposed model (blue line) is capable to reproduce the overshoot behavior. The green dashed line represents the model response to a negative load step if the membrane water content and the airflow dynamics are neglected. This fact confirms again the importance of considering both dynamics.
Figure 3: Experimental set up.
τs + 1
1
10 20 30 40
460 480 500 520 540 560 580 600 620
2 4 6 8
Time (s)
Airflow (slpm) Current (A)
Figure 5: Simulation and experimental voltage evolution after a negative current step.
Finally, Fig. 6 presents the experimental results and the modeled FC behavior after a positive load step. In this case, another overshoot can be observed. However, the FC time response is much faster (1.5 s) than the response time predicted by the model (5 s). In a similar way, the overshoot magnitude is slightly over predicted by the model. This might be explained as the Nexa FC system does not allow to measure the air pressure variation through square wave load steps, and thus, the starvation phenomenon already observed in [20] has not been considered.
Figure 6: Simulation and experimental voltage evolution after a positive current step.
V. C
ONCLUSIONA low computationally intensive dynamic model valid for different operating conditions of a PEM FC has been developed and reported in this paper. The proposed model is easy to interconnect with the most commonly available electrical circuit simulation software packages.
The membrane water content dynamics, a phenomenon that was typically ignored until now, has been introduced into the proposed model. The need of considering the membrane water content dynamic behavior when the FC faces square wave loads has been proved. Simulation and experimental results obtained from a 1.2kW hydrogen-air fuelled PEM FC laboratory system have been presented and are in close agreement.
VI. R
EFERENCES[1] J.H. Scott, “The development of fuel cell technology for electric power generation: from NASA’s manned space program to the hydrogen economy”, in
[2] G. Fontes, C. Turpin, S. Astier, T. A. Meynard, “Interactions between fuel cells and power converters: influence of current harmonics on a fuel cell stack”, in IEEE Transactions on Power Electronics, Vol. 22 No. 2, pp.670-678, March 2007.
[3] C. Wang, “Fundamental models for fuel cell engineering”, in Chemical Reviews, Vol. 104, No. 10, 2004.
[4] T. Berning, N. Djilali, “Three-dimensional computational analysis of transport phenomena in a PEM fuel cell – a parametric study” in Journal of Power Sources Vol. 124440-452, 2003.
[5] M. A. R. Sadiq Al-Baghadadi, H. A. K. Shahad Al-Janabi, “Parametric and optimization of a PEM fuel cell performance using three-dimensional computational fluid dynamics model”, in Renewable Energy Vol. 32 1077- 1101, 2007.
[6] Y. Wang, C. Wang, “Transient analysis of polymer electrolyte fuel cells”, in J.
Electrochemica Acta, Vol 50, 1307-1315, 2005.
[7] H. Ju, H. Meng, C. Wang, “A single phase, non isothermal model for PEM fuel cells”, in International Journal of Heat and Mass Transfer, Vol. 48, 1303-1315, 2005.
[8] K. Stanton, “A thermally dependent fuel cell model for power electronics design”, in Proc. of IEEE Power Electronics Specialists Conference 2005, pp.1647-1651, 2005.
[9] D. Yu, S. Yuvarajan, “A novel circuit model for PEM fuel cells”, in Proc. of IEEE APEC, Anaheim, CA, Vol.1, pp 362-366, Feb. 2004.
[10] J. Lai, “A low-cost DC/DC converter for SOFC”, SECA Annual Review Meeting, Boston, MA, May 2004.
[11] J.C. Amphlett, R. F. mann, B. A. Peppley, P. R. Roberge, A. Rodrigues “A model predicting responses of proton exchange membrane fuel cells” in Journal of Power Sources, 183-188, 1996.
[12] J. C. Amphlett, R. M. Baumert, R. F. Mann, B. A. Peppley, P. R. Roberge, A.
Rodrigues, “Parametric modeling of the performances of a 5 kW proton exchange membrane fuel cell stack”, in Journal of Power Sources, 49 349-356, 1994.
[13] A. R. Balkin, B. J. Holland, and J. G. Zhu, “Modeling polymer electrolyte membrane fuel cells,” in Proc. Australasian Universities Power Engineering Conf., Melbourne, Australia, 29-2 Oct. 2002.
[14] S Pasricha, S.R.D. Shaw, “A dynamic PEM fuel cell model”, in IEEE Transactions on Energy Conversion, Vol. 21, June 2006 ,pp. 484 – 490.
[15] M. Garcia-Arregui, C. Turpin, S. Astier, ”Direct connection between a fuel cell and ultracapacitors” in Proc. International Conference on Clean Electrical Power , 20-23 May 2007, pp. 474 – 479, 2007.
[16] G. Fontes. “Modelisation et caracterisation de la pile PEM pour l’etude des interactions avec les convertisseurs statiques”, PhD Dissertation, Institute Nationale Polytechnique de Toulouse, Toulouse, France, 2004.
[17] E. Laffly,M-C. Pera, D. Hissel, “Polymer electrolyte membrane fuel cell modeling and parameters estimation for ageing consideration” in Proc. IEEE International Symposium on Industrial Electronics, 2007, pp 180 – 185.
[18] S. Garnier, M-C. Pera, D. Hissel, A. De Bernardinis, J-M. Kauffmann, G.
Coquery, “Dynamic behavior of a proton exchange membrane fuel cell under transportation cycle load”, in Proc. of International Symposium on Industrial Electronics, Vol. 1, 4-7 May 2004, pp.329–333.
[19] M. Ceraolo, C. Miulli, A. Pozio, “Modeling static and dynamic behavior of proton exchange membrane fuel cells on the basis of electro-chemical description”, in Journal of Power Sources” 113 (2003), pp. 131-144.
[20] K. P. Adzakpa, K. Agbossous, Y. Dube, M. Dostie, M. Fournier, A. Poulin,
“PEM fuel cells modeling and analysis through current and voltage transients behaviors” in IEEE Transactions on Energy Conversion, Vol. 23, No. 2, pp.581-591, June 2008.
[21] S. Garnier, M-C. Pera, D. Hissel, F. Harel, D. Candusso, N. Glandut, J. P.
Diard, A. De Bernardinis, J-M. Kauffmann, G. Coquery; “Dynamic PEM fuel cell modeling for automotive applications”, in Proc. of IEEE Vehicular Technology Conference, 2003, pp.3284 - 3288.
[22] S. Um, C. Y. Wang, K. S. Chen, “Computational fluid dynamics modeling of proton exchange membrane fuel cells”, in Journal of Electrochemical Society, Vol. 147, 4485-4493, 2000.
[23] A. Parthasarathy, S. Srivivasan, J. Appleby, in Journal of Electrochemistry Society Vol.139, 2530, 1992.
[24] T. E. Springer, T. A. Zawondzinski, S. Gottesfeld, “ Polymer electrolyte fuel cell model”, in Journal of Electrochemistry Society, Vol. 138, 2331-42, 1991.
[25] F. Grasser, “An analytical, control-oriented state-space model for a PEM fuel cell system,” Ph.D. Dissertation, Ecole Polytechnique Fédérale de Lausanne, Lausanne, Switzerland, 2005.
[26] F Grasser, A. Rufer, “A fully analytical PEM fuel cell system model for control applications”, in IEEE Transactions on Industry Applications, vol. 43, no. 6, pp.
1499-1506, November/December 2007.
[27] J. Ramousse, J. Deseure, O. Lottin, S. Didierjean, D. Maillet, “Modelling of heat, mass and charge transfer in a PEMFC single cell”, in Journal of Power Sources, Vol. 1456 416-427, 2005.
[28] M. Hinaje, D. Nguyen, S. Rael, B. Davat, ”Modelling of the proton exchange membrane fuel cell in steady state”, in Proc. of IEEE Power Electronics Specialists Conference 2008, pp. 3550–3556.
[29] http://www.mathworks.com
[30] http://www.dspace.com. DS1104 R&D Controller Board.