行政院國家科學委員會專題研究計畫 成果報告
革蘭氏陽性菌細胞壁成分 Peptidoglycan 刺激巨噬細胞前發 炎物質釋放之訊息傳遞探討(3/3)
計畫類別: 個別型計畫
計畫編號: NSC94-2320-B-038-033-
執行期間: 94 年 08 月 01 日至 95 年 07 月 31 日 執行單位: 臺北醫學大學醫事技術學系
計畫主持人: 林建煌 共同主持人: 陳炳常
計畫參與人員: 詹雅璇、康如鈞、廖皎君
報告類型: 完整報告
處理方式: 本計畫可公開查詢
中 華 民 國 95 年 9 月 18 日
行政院國家科學委員會補助專題研究計畫 █成果報告 期 中 進度 報 告
革蘭氏陽性菌細胞壁成分 Peptidoglycan 刺激巨噬細胞前發炎物質 釋放之訊息傳遞探討(3/3)
計畫類別:▓ 個別型計畫 整合型計畫 計畫編號:NSC 94-2320-B-038-033-
執行期間: 94 年 8 月 1 日至 94 年 7 月 31 日
計畫主持人:林建煌 共同主持人:陳炳常
計畫參與人員:詹雅璇、康如鈞、廖皎君
成果報告類型(依經費核定清單規定繳交):□精簡報告 █完整報告
本成果報告包括以下應繳交之附件:
□赴國外出差或研習心得報告一份
□赴大陸地區出差或研習心得報告一份
□出席國際學術會議心得報告及發表之論文各一份
□國際合作研究計畫國外研究報告書一份
處理方式:除產學合作研究計畫、提升產業技術及人才培育研究計畫、
列管計畫及下列情形者外,得立即公開查詢
□涉及專利或其他智慧財產權,□一年□二年後可公開查詢
執行單位:台北醫學大學醫事技術學系
中 華 民 國 95 年 9 月 7 日
關 鍵 字 : Inflammation, Transcription Factors, Cytokines, Lipid Mediators, Monocytes/Macrophages。
In this study, we investigated the signaling pathway involved in interleukin-6 (IL-6) production caused by peptidoglycan (PGN), a cell wall component of the gram-positive bacterium, Staphylococcus aureus, in RAW 264.7 macrophages. PGN caused concentration- and time-dependent increases in IL-6, PGE2 and cAMP production.
PGN-mediated IL-6 production was inhibited by a non-selective cyclooxygenase (COX) inhibitor (indomethacin), a selective COX-2 inhibitor (NS398), an EP2 antagonist (AH6809), an EP4 antagonist (AH23848), and a protein kinase A (PKA) inhibitor (KT5720), but not by a non-selective nitric oxide synthase inhibitor (NG-nitro-arginine methyl ester). Furthermore, PGE2, an EP2 agonist (butaprost), an EP2/EP3/EP4 agonist (misoprostol), and misoprostol in the presence of AH6809 all induced IL-6 production, whereas an EP1/EP3 agonist (sulprostone) did not. PGN caused time-dependent activations of IκB kinase α/β and p65 phosphorylation at Ser276, and these effects were inhibited by NS398 and KT5720. Both PGE2 and8-bromo-cAMP, also caused IKKα/β phosphorylation. PGN resulted in two “waves” of the formation of NF-κB-specific DNA-protein complexes. The first wave of NF-κB activation occurred at 10~60 min of treatment, while the later wave occurred at 2~12 h of treatment. The PGN-induced increase in κB-luciferase activity was inhibited by NS398, AH6809, AH23848, KT5720, a PKC inhibitor (Ro31-8220), and a p38 MAPK inhibitor (SB203580). These results suggest that PGN-induced IL-6 production involves COX-2-generated PGE2, activation of the EP2 and EP4 receptors, cAMP formation, and the activation of PKA, PKC, p38 MAPK, IKKα/β, p65 phosphorylation, and NF-κB. However, PGN-induced nitric oxide release is not involved in the signaling pathway of PGN-induced IL-6 production.
關 鍵 字 : Inflammation, Transcription Factors, Cytokines, Lipid Mediators, Monocytes/Macrophages。發炎;轉錄因子;細胞激素巨;脂質媒介物質;單核球/噬細胞。
在本研究中,我們將探討革蘭氏陽性菌細胞壁成分peptidoglycan (PGN)誘導RAW 264.7巨噬細胞IL-6產生之訊息傳遞路徑。PGN依劑量及時間相關曲線增加IL-6、PGE2
及cAMP的產生。PGN媒介IL-6產生可被非選擇性COX抑制劑(indomethacin)、選擇性 COX抑制劑(NS398)、PGE2 (EP2)拮抗劑(AH6809)、EP4拮抗劑(AH23848)及protein kinase A 抑 制 劑 (KT5720) 所 抑 劑 , 但 不 受 非 選 擇 性 NO synthase 抑 制 劑 (NG-nitro-arginine methyl ester)所抑制。更進一步PGE2、EP2作用劑(butaprost)、
EP2/PGE3 (EP3)/EP4作用劑(mioprostol)及具有AH6809與mioprostol共同存在下皆可 誘導IL-6產生,然而EP1/EP3作用劑(sulprostone)則不會。PGN可以依照時間曲線活化 IκB kinase α/β (IKKα/β)及p65之Ser276之磷酸化,這些作用可被NS398及KT5720所抑 制。PGE2及8-bromo-cAMP二者也可以誘導IKKα/β之磷酸化。PGN可以依二項增加 NF-κB-特異DNA-蛋白複合物的形成,第一項NF-κB的活化發生在10-60分,而第二 項則發生在2-12小時。PGN增加κB-luciferase的活性可被NS398、AH6809、AH23848、
KT5720、protein kinase C抑制劑(Ro31-8220)及p38 MAPK抑制劑(SB203580)所抑制。
經由以上的結果發現PGN誘導IL-6的產生其中包含COX-2產生PGE2、活化EP2/EP4 受體、cAMP形成、活化PKA、PKC、p38 MAPK、IKKα/β、p65磷酸化及NF-κB。
然而PGN誘導NO釋放並不參與在PGN誘導IL-6的產生。
報告內容[前言及文獻探討、研究目的、研究方法、結果與討論(含結論與建議)]
本研究計劃第一年的成果目前已經發表在The Journal of Biological Chemistry (2004) Vol. 279, No. 20, Issue of May 14, pp20889-20897的期刋中,請見所附之期刊內容。第 二年的成果目前已經在Molecular Immunology期刋 revised中。第三年的成果目前已 經發表在The Journal of Immunology (2006) 177:681-693的期刋中,請見所附之期刊內 容。經由本計劃之執行與研究,必定能清楚明暸在革蘭氏陽性菌感染時所產生的發 炎現象。因此,藉由本計劃的完成將能尋找出治療革蘭氏陽性菌的治療方針。
Peptidoglycan-Induced IL-6 Production in RAW 264.7
Macrophages Is Mediated by Cyclooxygenase-2, PGE 2 /PGE 4 Receptors, Protein Kinase A, I B Kinase, and NF-B 1
Bing-Chang Chen,* Chiao-Chun Liao,
†Ming-Jen Hsu,
‡Yi-Ting Liao,
‡Chia-Chin Lin,
§Joen-Rong Sheu,
‡and Chien-Huang Lin
2‡In this study, we investigated the signaling pathway involved in IL-6 production caused by peptidoglycan (PGN), a cell wall component of the Gram-positive bacterium, Staphylococcus aureus, in RAW 264.7 macrophages. PGN caused concentration- and time-dependent increases in IL-6, PGE2, and cAMP production. PGN-mediated IL-6 production was inhibited by a nonselective cyclooxygenase (COX) inhibitor (indomethacin), a selective COX-2 inhibitor (NS398), a PGE2(EP2) antagonist (AH6809), a PGE4 (EP4) antagonist (AH23848), and a protein kinase A (PKA) inhibitor (KT5720), but not by a nonselective NO synthase inhibitor (NG-nitro-L-arginine methyl ester). Furthermore, PGE2, an EP2 agonist (butaprost), an EP2/PGE3(EP3)/EP4 agonist (misopros- tol), and misoprostol in the presence of AH6809 all induced IL-6 production, whereas an EP1/EP3 agonist (sulprostone) did not.
PGN caused time-dependent activations of IB kinase ␣ (IKKd) and p65 phosphorylation at Ser276, and these effects were inhibited by NS398 and KT5720. Both PGE2and 8-bromo-cAMP also caused IKKd kinase ␣ phosphorylation. PGN resulted in two waves of the formation of NF-B-specific DNA-protein complexes. The first wave of NF-B activation occurred at 10–60 min of treatment, whereas the later wave occurred at 2–12 h of treatment. The PGN-induced increase inB luciferase activity was inhibited by NS398, AH6809, AH23848, KT5720, a protein kinase C inhibitor (Ro31-8220), and a p38 MAPK inhibitor (SB203580).
These results suggest that PGN-induced IL-6 production involves COX-2-generated PGE2, activation of the EP2 and EP4 recep- tors, cAMP formation, and the activation of PKA, protein kinase C, p38 MAPK, IKKd, kinase ␣, p65 phosphorylation, and NF-B. However, PGN-induced NO release is not involved in the signaling pathway of PGN-induced IL-6 production. The Journal of Immunology, 2006, 177: 681– 693.
B
acteria stimulate the innate immune system of a host and the release of inflammatory molecules such as cytokines and chemokines as a response to infections (1, 2). LPS is a well-known activator of the innate immune system in Gram- negative infections (3). During Gram-positive infections, when no endotoxin is present, peptidoglycan (PGN),3the major component of the cell wall of Gram-positive bacteria, activates the innate im- mune system of the host and induces the release of cytokines (TNF-␣, IL-1, and IL-6) and chemokines (IL-8/CXCL8, MIP-1, MIP-2, and MCP) (3–5). These inflammatory molecules are the major cause of the various signs and symptoms that occur during bacterial infections, including fever, inflammation, and acute phase responses (3–5).IL-6 is a multifunctional cytokine that plays a central role in both innate and acquired immune responses. IL-6 is the predom-
inant mediator of the acute phase response, an innate immune mechanism which is triggered by infection and inflammation (6, 7). IL-6 also plays multiple roles during the subsequent develop- ment of acquired immunity against incoming pathogens, including regulation of the expressions of cytokine and chemokine, stimu- lation of Ab production by B cells, regulation of macrophage and dendritic cell differentiation, and the response of regulatory T cells to microbial infection (6, 7). In addition to these roles in pathogen- specific inflammation and immunity, IL-6 levels are elevated in chronic inflammatory conditions, such as rheumatoid arthritis (8 – 10). Several consensus sequences, including those for NF-B, CREB, NF-IL-6, and AP-1 in the 5⬘ promoter region of the IL-6 gene, have been identified as regulatory sequences that induce IL-6 in response to various stimuli (11, 12). NF-B, a key transcription factor that regulates IL-6 expression, is a dimer of either transcrip- tion factor p65 or transcription factor p50 (13). In a resting state, this dimer is associated with IBs to retain NF-B in the cytosol (14). IB kinase (IKK), which is activated through stimulation by cytokines and bacterial products, phosphorylates IB␣ at Ser32and Ser36and IB at Ser19and Ser23(15–17), to produce ubiquiti- nation of IB␣ at lysine residues and degradation by the 26S proteasome (18). This process releases active NF-B, which is then translocated from the cytosol to the nucleus, to bind specific DNA enhancer sequences and induce gene transcription (13). Reg- ulation of IB degradation and the subsequent release of NF-B constitute a critical control point in the pathway. However, recent results suggest that an additional IB-independent pathway is ac- tivated, which causes the enhanced transactivation potential of NF-B once it is bound to its consensus sequence (19, 20).
Activation of the pathway has been shown to result in increased
*School of Respiratory Therapy, Graduate Institutes of†Biomedical Technology and
‡Medical Sciences, College of Medicine, Taipei Medical University, Taipei, Taiwan;
and§Graduate Institute of Nursing, College of Nursing, Taipei Medical University, Taipei, Taiwan
Received for publication May 19, 2005. Accepted for publication April 14, 2006.
The costs of publication of this article were defrayed in part by the payment of page charges. This article must therefore be hereby marked advertisement in accordance with 18 U.S.C. Section 1734 solely to indicate this fact.
1This work was supported by Grant NSC 93-2314-B-038-014 from the National Science Council of Taiwan.
2Address correspondence and reprint requests to Dr. Chien-Huang Lin, Graduate Institute of Medical Sciences, College of Medicine, Taipei Medical University, 250 Wu-Hsing Street, Taipei 110, Taiwan. E-mail address: [email protected]
3Abbreviations used in this paper: PGN, peptidoglycan; COX-2, cyclooxygenase 2;
EP, PGE2receptor; IKK␣, IB kinase ␣; iNOS, inducible nitric oxide synthase;
L-NAME, NG-nitro-L-arginine methyl ester; PDTC, pyrrolidine dithiocarbamate;
PKA, protein kinase A; PKC, protein kinase C; TP, thromboxane A2receptor.
Copyright © 2006 by The American Association of Immunologists, Inc. 0022-1767/06/$02.00
phosphorylation of the p65 (RelA) subunit of NF-B and to pro- mote interaction of p65 with the coactivator protein, p300/CBP (21–23).
PGs are ubiquitous compounds involved in a variety of homeo- static and inflammatory processes (24). They are formed by the combined action of phospholipase A2, which liberates arachidonic acid from the sn-2 position of cellular membrane phospholipids, and cyclooxygenase (COX), which converts arachidonic acid to the endoperoxide intermediate, PGH2. PGH2is then subsequently converted to various PGs by the action of cell-specific synthases (24). COX-2 is a COX isoform that is induced in a number of cells by proinflammatory stimuli and is thought to contribute to the generation of prostanoids at sites of inflammation (25, 26). It is considered to be responsible for the high production of PGs (27).
PGE2, one of the major PGs produced, exerts its biological effects by binding to specific cell surface receptors, designated PGE2re- ceptors (EPs). There are four different EPs that have been identi- fied, named EP1 to EP4, and several splice variants of EP3 are known (28). Activation of EPs leads to well-defined alterations in intracellular calcium and cAMP concentrations; e.g., Gs-coupled cAMP increases via adenylyl cyclase activation by EP2 and EP4, and intracellular calcium increases via phosphatidylinositol turn- over by EP1, whereas a Gi-coupled decrease in cAMP is effected by EP3 (29). Therefore, many different physiological processes are regulated by PGE2activation of specific receptor subtypes.
Previous studies have shown a positive association between en- dogenous PGE2production and IL-6 synthesis both in vitro (30 – 33) and in vivo (31, 34). However, the signaling pathway between COX-2 induction and IL-6 release by PGN stimulation is still un- known. A recent study from our laboratory showed that PGN in- duces TLR2, p85␣, and Ras complex formation and subsequently activates the Ras/Raf-1/ERK pathway, which in turn initiates IKK␣ and NF-B activation, and ultimately induces COX-2 ex- pression in RAW 264.7 macrophages (35). In the present study, RAW 264.7 macrophages were exposed to PGN, and the signaling pathway between COX-2 induction and IL-6 production was in- vestigated. Our studies demonstrated that in RAW 264.7 macro- phages, PGN stimulates IL-6 production by a COX-2/PGE2-de- pendent mechanism. We show that EP2/EP4, intracellular cAMP formation, and the activation of PKA, protein kinase C (PKC), p38 MAPK, IKK␣, p65 phosphorylation, and NF-B are involved in PGN-stimulated IL-6 production. However, PGN-induced NO re- lease is not involved in the signaling pathway of PGN-induced IL-6 production.
Materials and Methods
Materials
PGN (derived from Staphylococcus aureus) was purchased from Fluka.
LPS (derived from Escherichia coli), NG-nitro-L-arginine methyl ester (L- NAME), polymyxin B, AH23848, and misoprostol were purchased from Sigma-Aldrich. NS398, KT5720, Ro31-8220, SB203580, and 8-bromo- cAMP were obtained from Calbiochem. PGE2, AH6809, butaprost, sulpr- ostone, and the IL-6, PGE2, and cAMP enzyme immunoassay kits were obtained from Cayman. DMEM/Ham’s F-12, FCS, and penicillin/strepto- mycin were purchased from Invitrogen Life Technologies. Abs specific for COX-2 and ␣-tubulin were purchased from Transduction Laboratories.
Protein A/G beads, IB␣ protein (aa 1–317), and Abs specific for I⌲⌲␣
phosphorylated at Ser180/181and p65 phosphorylated at Ser276were pur- chased from Cell Signaling and Neuroscience. I⌲⌲␣, p65, p50, inducible NO synthase (iNOS), and anti-mouse and anti-rabbit IgG-conjugated HRP were purchased from Santa Cruz Biotechnology. Anti-mouse and anti- rabbit IgG-conjugated alkaline phosphatases were purchased from Jackson ImmunoResearch Laboratories. pGL2-ELAM-Luc (which is under the con- trol of one NF-B binding site) and pBK-CMV-LacZ were kindly provided by Dr. W.-W. Lin (National Taiwan University, Taipei, Taiwan).
[␥-32P]ATP (6000 Ci/mmol) was purchased from Amersham Pharmacia Biotech. IL-6 was purchased from PeproTech. Anti-IL-6 Ab was purchased
from eBioscience. GenePOPTER 2 was purchased from Gene Therapy System. All materials for SDS-PAGE were purchased from Bio-Rad. All other chemicals were obtained from Sigma-Aldrich.
Cell culture
The mouse macrophage cell line, RAW 264.7, was obtained from Amer- ican Type Culture Collection, and cells were maintained in DMEM/Ham’s F-12 nutrient mixture containing 10% FCS, 100 U/ml penicillin G, and 100
g/ml streptomycin in a humidified 37°C incubator. After reaching con- fluence, cells were seeded onto either 6-cm dishes for immunoblotting or kinase assays or 12- and 24-well plates for measurement by the IL-6, PGE2, cAMP, orB luciferase assays.
Measurements of IL-6 and PGE2production
RAW 264.7 macrophages were cultured in 24-well culture plates. After reaching confluence, cells were treated with various stimulators or pre- treated with specific inhibitors as indicated, followed by PGN, and then incubated in a humidified incubator at 37°C for 24 h. After incubation, the medium was removed and stored at⫺80°C until assay. IL-6 or PGE2in the medium was assayed using the IL-6 or PGE2enzyme immunoassay kits, respectively, according to the procedure described by the manufacturer.
Measurement of intracellular cAMP concentration
RAW 264.7 macrophages were cultured in 12-well culture plates. After reaching confluence, cells were treated with PGN (30g/ml) for various time intervals, or pretreated with specific inhibitors as indicated followed by PGN, and then incubated in a humidified incubator at 37°C for 6 h.
After incubation, the reaction was terminated by aspiration of the medium and the addition of 0.1 N HCl for 20 min. The cells were scraped into Eppendorf tubes, and the suspensions were centrifuged; the supernatants were then neutralized with 10 N NaOH. Samples were stored at⫺80°C until assay. cAMP levels were assayed using the cAMP enzyme immuno- assay kit according to the procedure described by the manufacturer.
Immunoblot analysis
To determine the expressions of IKK␣ phosphorylation at Ser180/181; IKK␣; and p65 phosphorylation at Ser276, p65, iNOS, COX-2, and␣-tu- bulin in RAW 264.7 macrophages, proteins were extracted, and Western blot analysis was performed as described previously (36). Briefly, RAW 264.7 macrophages were cultured in 6-cm dishes. After reaching conflu- ence, cells were treated with vehicle, PGN, PGE2, and 8-bromo-cAMP or pretreated with specific inhibitors as indicated followed by PGN. After incubation, cells were washed twice in ice-cold PBS and solubilized in extraction buffer containing 10 mM Tris (pH 7.0), 140 mM NaCl, 2 mM PMSF, 5 mM DTT, 0.5% Nonidet P-40, 0.05 mM pepstatin A, and 0.2 mM leupeptin. Samples of equal amounts of protein (100g) were subjected to SDS-PAGE and then transferred onto a polyvinylidine difluoride which was then incubated in 150 mM NaCl, 20 mM Tris-HCl, 0.02% Tween 20 (pH 7.4) buffer containing 5% BSA. Proteins were visualized by specific primary Abs and then incubated with HRP- or alkaline phosphatase-con- jugated second Abs. Immunoreactivity was detected using ECL or ni- troblue tetrazolium/5-bromo-4-chloro-3-indolyl phosphate following the manufacturer’s instructions. Quantitative data were obtained using a com- puting densitometer with scientific imaging systems.
Immunoprecipitation and IKK␣ activity assay
RAW 264.7 cells were grown in 6-cm dishes. After reaching confluence, cells were treated with 30g/ml PGN for the indicated time intervals.
After incubation, cells were washed twice with ice-cold PBS; lysed in 1 ml of lysis buffer containing 20 mM Tris-HCl (pH 7.5), 1 mM MgCl2, 125 mM NaCl, 1% Triton X-100, 1 mM PMSF, 10g/ml leupeptin, 10 g/ml aprotinin, 25 mM-glycerophosphate, 50 mM NaF, and 100 M sodium orthovanadate; and then centrifuged. The supernatant was immunoprecipi- tated with respective polyclonal Abs against IKK␣ in the presence of A/G-agarose beads overnight. The beads were washed three times with lysis buffer and twice with kinase buffer containing 20 mM HEPES (pH 7.4), 20 mM MgCl2, 1 mM NaVO4, and 2 mM DTT. The kinase reactions were performed by incubating immunoprecipitated beads with 20l of kinase buffer supplemented with 20M ATP and 3 Ci of [␥-32P]ATP at 30°C for 30 min. To assess the IKK␣ activity, 0.5 g of GST-IB␣
protein (aa 1–317) was added to the substrate. The reaction mixtures were analyzed by 12% SDS-PAGE followed by autoradiography.
Preparation of nuclear extracts and the EMSA
RAW 264.7 macrophages were cultured in 6-cm dishes. After reaching confluence, cells were treated with 30g/ml PGN for indicated time in- tervals; then cells were scraped and collected. The cytosolic and nuclear protein fractions were separated as described previously (37). Briefly, cells were washed with ice-cold PBS and pelleted. Cell pellets were resuspended in hypotonic buffer (10 mM HEPES (pH 7.9), 10 mM KCl, 0.5 mM DTT, 10 mM aprotinin, 10 mM leupeptin, and 20 mM PMSF) for 15 min on ice, and vortexed for 10 s. Nuclei were pelleted by centrifugation at 15,000⫻ g for 1 min. Supernatants containing cytosolic proteins were collected. A pellet containing nuclei was resuspended in hypertonic buffer (20 mM HEPES (pH 7.6), 25% glycerol, 1.5 mM MgCl2, 4 mM EDTA, 0.05 mM DTT, 10 mM aprotinin, 10 mM leupeptin, and 20 mM PMSF) for 30 min on ice. Supernatants containing nuclear proteins were collected by centrif- ugation at 15,000⫻ g for 30 min and then stored at ⫺70°C.
A double-stranded oligonucleotide probe containing an NF-B sequence (5⬘-AGTTGAGGGGACTTTCCCAGGC-3⬘; Promega) was purchased and end-labeled with [␥-32P]ATP using T4 polynucleotide kinase. The nuclear extract (2.5–5g) was incubated with 1 ng of a32P-labeled NF-B probe (50,000 –75,000 cpm) in 10 l of binding buffer containing 1 g of poly(deoxyinosinate-deoxycytidylate), 15 mM HEPES (pH 7.6), 80 mM NaCl, 1 mM EDTA, 1 mM DTT, and 10% glycerol at 30°C for 25 min.
DNA-nuclear protein complexes were separated from the DNA probe by electrophoresis on 4.5% polyacrylamide gels. Gels were vacuum dried and subjected to autoradiography with an intensifying screen at⫺80°C. For competition experiments, 1 ng of the labeled oligonucleotide was mixed with 50 ng of unlabeled competitor oligonucleotides before protein addi- tion. For the supershift experiments, 4g of anti-p65 or anti-p50 Ab were mixed with the nuclear extract proteins.
Transfection andB luciferase assays
For these assays, 2 ⫻ 105RAW 264.7 cells were seeded onto 12-well plates, and cells were transfected the next day using GenePORTER 2 with 0.3g of pGL2-ELAM-Luc and 0.3 g of pBK-CMV-LacZ. After 24 h, the medium was aspirated and replaced with fresh DMEM-Ham’s F-12 containing 10% FBS and was then pretreated with specific inhibitors as indicated followed by PGN (30g/ml) treatment for another 24 h. Lucif- erase activity was determined with a luciferase assay system (Promega), and was normalized on the basis of LacZ expression. The level of induction of luciferase activity was compared as the ratio of cells with and without stimulation.
Measurement of NO concentration
NO production was assayed by measuring nitrite (a stable degradation product of NO) in the supernatant of cultured RAW 264.7 cells using the Griess reagent. Briefly, RAW 264.7 macrophages were cultured in 24-well plates. After reaching confluence, the culture medium was changed to phe- nol red-free DMEM. Cells were then treated with PGN (30g/ml) for the indicated time intervals or pretreated with specific inhibitors as indicated, followed by PGN. After incubation, the supernatant was collected, mixed with an equal volume of Griess reagent (1% sulfanilamide, 0.1% N-(1- naphthyl)ethylenediamine, and 2% phosphoric acid), and incubated at room temperature for 10 min. The OD measured at 550 nm in a microplate reader was used as an indication of the nitrite concentration. Sodium nitrite was used to produce a standard curve of nitrite concentration.
Statistical analysis
Results are presented as the mean⫾ SE from at least three independent experiments. One-way ANOVA followed by, when appropriate, Bonfer- roni’s multiple range test was used to determine the statistical significance of the difference between means. p⬍ 0.05 was considered statistically significant.
Results
PGN induces macrophage IL-6 production
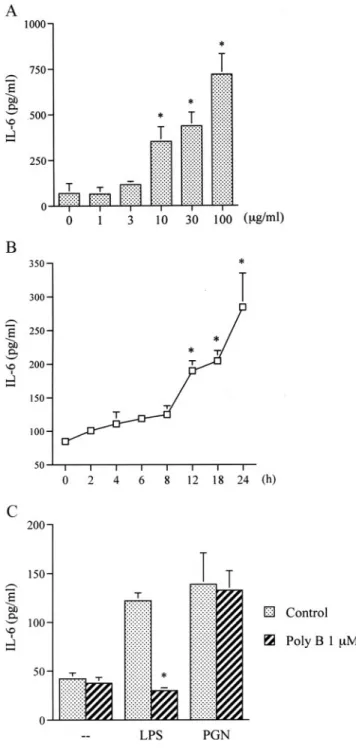
Murine RAW 264.7 macrophages were chosen to investigate the signal pathways of PGN in the production of IL-6, an inflamma- tory response gene. Treatment with PGN (1–100g/ml) for 24 h induced IL-6 production in a concentration-dependent manner (Fig. 1A), this induction occurred in a time-dependent manner (Fig.
1B). After 24 h of treatment with 30g/ml PGN, the amount of IL-6 released had increased by⬃235 ⫾ 64% (Fig. 1B). To further confirm this stimulation-specific mediation by PGN without LPS
contamination, polymyxin B, an LPS inhibitor, was tested. We found that polymyxin B (1M) completely inhibited LPS (1 g/
ml)-induced IL-6 release. However, it had no effect on PGN (30
M)-induced IL-6 release (Fig. 1C).
FIGURE 1. Concentration- and time-dependent increases in IL-6 pro- duction by PGN and effects of polymyxin B on LPS- and PGN-induced IL-6 production in RAW 264.7 macrophages. Cells were incubated with various concentrations of PGN for 24 h (A) or with 30g/ml PGN for 2, 4, 6, 8, 12, 18, or 24 h (B). Media were collected to measure IL-6. Results are expressed as the mean ⫾ SE of four independent experiments per- formed in triplicate.ⴱ, p ⬍ 0.05 as compared with the basal level. C, Cells were pretreated with polymyxin B (Poly B, 1 M) for 30 min before incubation with 1 g/ml LPS or 30 g/ml PGN for 24 h. Media were collected to measure IL-6. Results are expressed as the mean⫾ SE of three independent experiments performed in triplicate.ⴱ, p ⬍ 0.05 as compared with the LPS or PGN treatment groups, respectively.
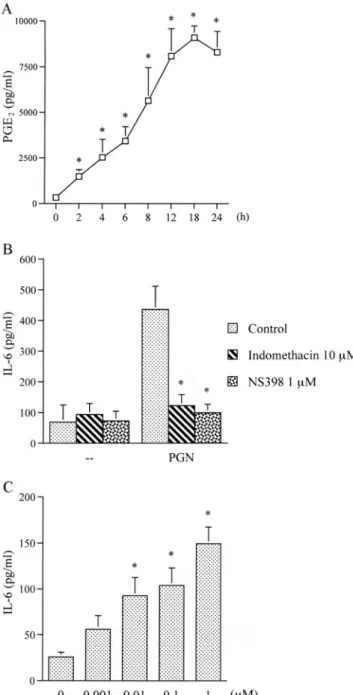
Involvement of PGE2formation in PGN-induced IL-6 release Our previous study showed that PGN can induce COX-2 expres- sion in RAW 264.7 macrophages (35). Next, we further examined PGE2formation by PGN stimulation in RAW 264.7 macrophages.
Treatment of cells with 30g/ml PGN for 2, 4, 6, 8, 12, 18, or 24 h induced PGE2formation in a time-dependent manner. PGE2for- mation increased at 2 h and peaked at 12⬃24 h (Fig. 2A). To examine whether COX-2-generated PGE2formation is involved in the signal transduction pathway leading to IL-6 production caused by PGN, the nonselective COX inhibitor indomethacin and the selective COX-2 inhibitor NS398 were used. Fig. 2B shows that PGN-induced IL-6 production was inhibited by indomethacin (10
M) and NS398 (1 M) by 92 ⫾ 10% and 93 ⫾ 7%, respectively.
Furthermore, stimulation of cells with PGE2(0.001–1 M) also resulted in IL-6 production in a concentration-dependent manner (Fig. 2C). When cells were treated with 1M PGE2for 24 h, IL-6 production increased by ⬃480 ⫾ 70% (Fig. 2C). These results suggest that COX-2-generated PGE2 formation is necessary for PGN-induced IL-6 release in RAW 264.7 macrophages.
Involvement of EP2 and EP4 receptors in PGN-induced IL-6 production
There are four types of EPs that have been defined and cloned, EP1, EP2, EP3, and EP4 (28). A previous study revealed that RAW 264.7 macrophages express EP2, EP3, and EP4, but not EP1, receptors (38). To identify the EP receptors involved in PGN- mediated IL-6 production, the EP2 receptor antagonist AH6809 and the EP4 receptor antagonist AH23848 were tested. As shown in Fig. 3A, pretreatment of RAW 264.7 macrophages with 3M AH6809 and 30 M AH23848 inhibited PGN-induced IL-6 re- lease by 49⫾ 10% and 62 ⫾ 12%, respectively. Treatment of cells with the combination of 3 M AH6809 and 30 M AH23848 caused a more arked inhibitory effect on the PGN-induced IL-6 release compared with each agent alone. Furthermore, treatment of RAW 264.7 macrophages with the EP2 agonist butaprost (5M) and the EP2/EP3/EP4 agonist misoprostol (100 nM) also resulted in IL-6 release from 75⫾ 10 pg/ml to 149 ⫾ 21 and 190 ⫾ 20 pg/ml, respectively, whereas the EP1/EP3 agonist sulprostone (1
M) had no effect (Fig. 3B). To identify the EP4-mediated effects of misoprostol, RAW 264.7 cells were treated with misoprostol in the presence of the EP2 antagonist AH6809. Treatment of cells with misoprostol in the presence of AH6809 also induced IL-6 production from 75 ⫾ 10 pg/ml to 134 ⫾ 23 pg/ml (Fig. 3B).
These results suggest that PGN-induced IL-6 release may occur via activation of EP2 and EP4 receptor signaling.
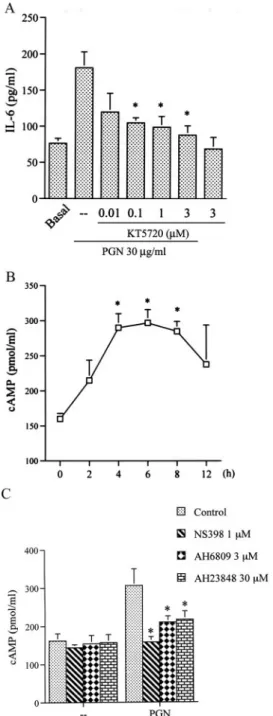
Involvement of cAMP formation and PKA activation in PGN-induced IL-6 production
To identify the cAMP-dependent PKA signaling pathways in- volved in PGN-mediated IL-6 production, RAW 264.7 macro- phages were treated with the PKA inhibitor, KT5720. Pretreatment of RAW 264.7 macrophages with KT5720 (0.01⬃3M) inhibited PGN-induced IL-6 production in a concentration-dependent man- ner (Fig. 4A). When cells were treated with 3M KT5720, PGN- induced IL-6 production was inhibited by 82⫾ 12% (n ⫽ 3). Next, we directly measured cAMP formation in response to PGN. Short term treatment of cells with 30g/ml PGN for 5, 10, 30, and 60 min did not cause an increase in cAMP formation (data not shown). However, long term treatment of RAW 264.7 cells with PGN for 2, 4, 6, 8, or 12 h induced cAMP formation in a time- dependent manner. The cAMP formation began at 2 h, peaked at 4 – 8 h, and then declined at 12 h after PGN treatment (Fig. 4B).
We next examined whether PGN-induced cAMP formation occurs through COX-2-generated PGE2 and EP2/EP4 activation. As shown in Fig. 4C, pretreatment of RAW 264.7 macrophages with NS398, AH6809, and AH23848 all inhibited PGN-induced cAMP formation by 90⫾ 9%, 61 ⫾ 11%, and 58 ⫾ 15%, respectively.
FIGURE 2. Involvement of PGE2formation in PGN-mediated IL-6 pro- duction in RAW 264.7 macrophages. A, Cells were incubated with 30
g/ml PGN for 2, 4, 6, 8, 12, 18, or 24 h. Media were collected to measure PGE2. Results are expressed as the mean⫾ SE of three independent ex- periments performed in triplicate.ⴱ, p ⬍ 0.05 as compared with the basal level. B, Cells were pretreated for 30 min with 10M indomethacin and 1
M NS398 and then stimulated with 30 g/ml PGN for 24 h. Media were collected to measure IL-6. Results are expressed as the mean⫾ SE of four independent experiments performed in triplicate.ⴱ, p ⬍ 0.05 as compared with the PGN treatment group. C, Cells were incubated with various con- centrations of PGE2for 24 h. Media were collected to measure IL-6. Re- sults are expressed as the mean⫾ SE of three independent experiments performed in triplicate.ⴱ, p ⬍ 0.05 as compared with the basal level.
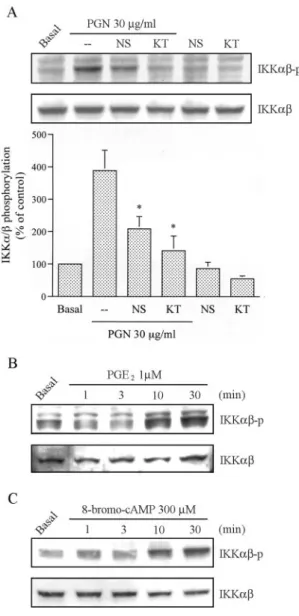
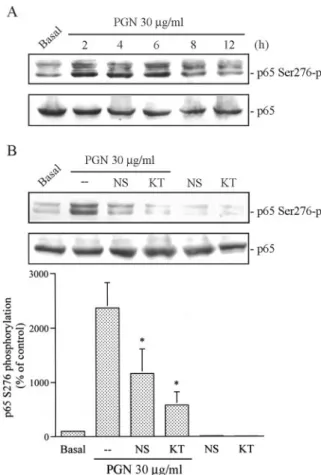
PGE2and PKA mediated PGN-induced IKK␣ activation We further examined whether activation of IKK␣ occurs through the COX-2-generated PGE2and PKA signaling pathway. Stimu- lation of cells with 30g/ml PGN for 2, 4, 6, 8, or 12 h induced an increase in IKK␣ phosphorylation and IKK␣ activity in time-dependent manners, reaching a maximum after 6 – 8 h of treatment (Fig. 5). Furthermore, pretreatment of cells for 30 min with NS398 (1M) and KT5720 (3 M) markedly attenuated the PGN-induced IKK␣ phosphorylation by 62 ⫾ 13% and 86 ⫾ 15%, respectively (Fig. 6A). None of these inhibitors affected the basal IKK␣ phosphorylation (Fig. 6A). In addition, treatment of RAW 264.7 macrophages with PGE2(1M) caused marked phos- phorylation of IKK␣, reaching maximums after 10–30 min of treatment (Fig. 6B, lower). Similarly, treatment of cells with the PKA activator, 8-bromo-cAMP (300M), also resulted in IKK␣
phosphorylation in a time-dependent manner, with a maximum effect at 10 –30 min of treatment (Fig. 6C). The protein level of IKK␣ was not affected by PGE2 or 8-bromo-cAMP treatment (Fig. 6, B and C, lower).
PGE2and PKA mediated PGN-induced p65 phosphorylation at Ser276
Next, we further examined p65 phosphorylation at Ser276by PGN stimulation in RAW 264.7 macrophages. Treatment of cells with FIGURE 3. Involvement of EP2 and EP4 receptors in PGN-mediated
IL-6 production in RAW 264.7 macrophages. A, Cells were pretreated for 30 min with 3M AH6809, 30 M AH23848, or 3 M AH6809 ⫹ 30 M AH23848 and then stimulated with 30g/ml PGN for 24 h. Media were collected to measure IL-6. Results are expressed as the mean⫾ SE of three independent experiments performed in triplicate.ⴱ, p ⬍ 0.05 as compared with the PGN treatment group. B, Cells were incubated with 1M butap- rost, 3M sulprostone, 1 M misoprostol, or 1 M misoprostol ⫹ 3 M AH6089 for 24 h. Media were collected to measure IL-6. Results are ex- pressed as the mean⫾ SE of three independent experiments performed in triplicate.ⴱ, p ⬍ 0.05 as compared with the basal level.
FIGURE 4. Involvement of cAMP formation and PKA activation in PGN-mediated IL-6 release in RAW 264.7 macrophages. A, Cells were pretreated for 30 min with various concentrations of KT5720 and then stimulated with 30g/ml PGN for 24 h. Media were collected to measure IL-6. Results are expressed as the mean⫾ SE of three independent exper- iments performed in triplicate.ⴱ, p ⬍ 0.05 as compared with the PGN treatment group. B, Cells were incubated with 30g/ml PGN for 2, 4, 6, 8, or 12 h. Cell lysates were collected to measure cAMP. Results are ex- pressed as the mean⫾ SE of four independent experiments performed in triplicate.ⴱ, p ⬍ 0.05 as compared with the basal level. C, Cells were pretreated for 30 min with 1 M NS398, 3 M AH6809, or 30 M AH23848 and then stimulated with 30g/ml PGN for 6 h. Cell lysates were collected to measure cAMP formation. Results are expressed as the mean⫾ SE of three independent experiments performed in triplicate. ⴱ, p⬍ 0.05 as compared with the PGN treatment.
30g/ml PGN for 2, 4, 6, 8, or 12 h induced p65 phosphorylation at Ser276in a time-dependent manner (Fig. 7A). The response be- gan at 2 h, was sustained to 4 – 6 h, and then declined at 8 –12 h after PGN treatment (Fig. 7A). We next examined whether PGN- induced p65 phosphorylation at Ser276occurs through the PGE2 and PKA signaling pathways. As shown in Fig. 7B, pretreatment of cells for 30 min with NS398 (1M) and KT5720 (3 M) mark- edly attenuated PGN-induced p65 phosphorylation at Ser276 at 53⫾ 20% and 79 ⫾ 11%, respectively. Neither of these inhibitors affected the basal p65 protein levels (Fig. 7B, lower).
COX-2-generated PGE2, EP2/EP4s, PKA, and IL-6 itself mediated PGN-induced NF-B activation
To examine whether COX-2-generated PGE2-induced NF-B ac- tivation is required for PGN-induced IL-6 production, pretreatment of RAW 264.7 macrophages with the NF-B inhibitor, pyrrolidine dithiocarbamate (PDTC, 50 M), inhibited PGN- and PGE2-in-
duced IL-6 production by 44⫾ 5% and 77 ⫾ 14%, respectively (Fig. 8A). Furthermore, the time course of NF-B activation after treatment with 30g/ml PGN was evaluated by a gel shift DNA binding assay. As shown in Fig. 8B, stimulation of cells with PGN for 10 and 30 min and 1, 2, 4, 6, 8, and 12 h resulted in a two waves of formation of the NF-B-specific DNA-protein complex. The first wave of NF-B activation occurred at 10–60 min of treatment and the later wave at 2–12 h of treatment. To identify the specific subunits involved in the formation of the NF-B complex, super- shift assays were performed using Abs specific for anti-p65 and anti-p50. Incubation of nuclear extracts with Abs specific for anti-p65 and anti-p50 attenuated NF-B-specific DNA-protein FIGURE 5. PGN induced IKK␣ activation in RAW 264.7 macro-
phages. A, RAW 264.7 macrophages were treated with 30g/ml PGN for 2, 4, 6, 8, or 12 h, and IKK␣ phosphorylation was shown by immuno- blotting with an Ab specific for phosphorylated IKK␣ (upper panel).
Equal loading in each lane is shown by the similar intensities of IKK␣
(lower panel). Typical traces are representative of three experiments with similar results. B, For evaluation of IKK␣ activity, cell lysates were in- cubated with 30g/ml PGN for 2, 4, 6, 8, or 12 h, and then lysates were immunoprecipitated with Abs specific for IKK␣ and IKK. One set of immunoprecipitates was subjected to the kinase assay (KA) as described in Materials and Methods using the GST-IB␣ fusion protein as a substrate (top panel). The other set of immunoprecipitates was subjected to 10%
SDS-PAGE and analyzed by immunoblotting (IB) with an anti-IKK␣ Ab (bottom panel). Equal amounts of the immunoprecipitated kinase complex present in each kinase assay were confirmed by immunoblotting for IKK␣. Typical traces are representative of three experiments with similar results, which are presented as the mean⫾ SE. ⴱ, p ⬍ 0.05 as compared with the basal level.
FIGURE 6. Involvement of PGE2formation and PKA activation in PGN-mediated IKK␣ phosphorylation in RAW 264.7 macrophages. A, Cells were pretreated with 1M NS398 (NS) and 3 M KT5720 (KT) for 30 min and then treated with 30g/ml PGN for 6 h. IKK␣ phosphory- lation was shown by immunoblotting with an Ab specific for phosphory- lated IKK␣ (top panel). Equal loading in each lane is shown by the similar intensities of IKK␣ (bottom panel). Typical traces are represen- tative of three experiments with similar results, presented as the mean⫾ SE.ⴱ, p ⬍ 0.05 as compared with the PGN treatment group. B and C, Cells were treated with 1M PGE2(B) or 300M 8-bromo-cAMP (C) for 1, 3, 10, or 30 min, and IKK␣ phosphorylation was shown by immunoblotting with an Ab specific for phosphorylated IKK␣ (upper panel). Equal load- ing in each lane is shown by the similar intensities of IKK␣ (lower panel).
Typical traces are representative of three experiments with similar results.
complex formation (Fig. 8C, lanes 3 and 4). These results indi- cated that the components of the NF-B complex are p65 and p50.
Formation of the NF-B complex was completely inhibited by the 50-fold cold NF-B consensus DNA sequence (Fig. 8C, lane 5), indicating that DNA-protein interactions are sequence specific. We further examined whether the COX-2-generated PGE2 and PKA signaling pathway are involved in the PGN-induced activation of NF-B in two waves. Pretreatment of cells with 1 M NS398 or 3 M KT5720 did not affect the first wave of NF-B-specific DNA-protein complex formation caused by short term (30 min) treatment (Fig. 8D), whereas both inhibited the later wave of NF-B activation caused by the long term (6 h) treatment of PGN (Fig. 8E). To directly determine NF-B activation after PGN treat- ment, RAW 264.7 macrophages were transiently transfected with pGL2-ELAM-B luciferase as an indicator of NF-B activation.
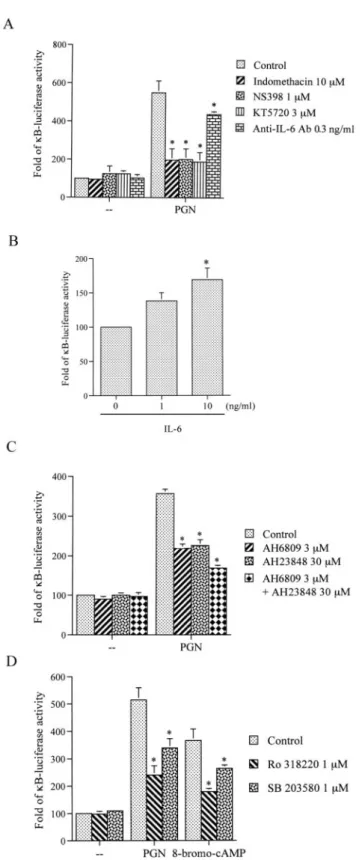
When cells were treated with 30 g/ml PGN for 24 h, the B luciferase activity increased by⬃550 ⫾ 62% (Fig. 9A). Further- more, we found that pretreatment of cells for 30 min with 10M indomethacin, 1M NS398, and 3 M KT5720 markedly atten-
uated the PGN-induced increase inB luciferase activity by 77 ⫾ 15%, 83⫾ 14%, and 86 ⫾ 10%, respectively (Fig. 9A). To test the possibility that IL-6 itself induced NF-B activation, an anti-IL-6 Ab was used. Pretreatment of RAW 264.7 macrophages with 0.3 ng/ml anti-IL-6 Ab inhibited the PGN-induced later wave of NF-
B-specific DNA-protein complex formation (Fig. 8E) as well as the increase inB luciferase activity (Fig. 9A). Furthermore, treat- ment of cells with IL-6 (1 and 10 ng/ml) also resulted in an in- crease inB luciferase activity of 169 ⫾ 17% with 10 ng/ml IL-6 treatment (Fig. 9B). Next, we wanted to identify whether EP2 and EP4 are involved in PGN-mediated NF-B activation. We found that 3 M AH6809 and 30 M AH23848 inhibited the PGN- induced increase inB luciferase activity by 51 ⫾ 4% and 50 ⫾ 6%, respectively (Fig. 9C). Furthermore, treatment of AH6809 and AH23848 in combination with RAW 264.7 macrophages resulted in a more marked inhibitory effect on the PGN-induced response compared with each agent alone (Fig. 9C). Taken together, these data suggest that COX-2-generated PGE2, EP2/EP4, PKA, and IL-6 itself are involved in the PGN-induced later wave of NF-B activation in RAW 264.7 macrophages.
PKC and p38 MAPK mediated PGN-induced NF-B activation To identify whether PKA regulates the activity of other signaling molecules that lead to NF-B activation caused by PGN, the PKC inhibitor Ro31-8220 and the p38 MAPK inhibitor SB203580 were used. Fig. 9D shows that pretreatment of cells with 1M Ro31- 8220 and 1M SB203580 inhibited the PGN-induced increase in
B luciferase activity by 66 ⫾ 8% and 45 ⫾ 8%, respectively.
Furthermore, 8-bromo-cAMP, a PKA activator, which induced an increase inB luciferase activity was also inhibited by both in- hibitors by 70⫾ 4% and 42 ⫾ 5%, respectively.
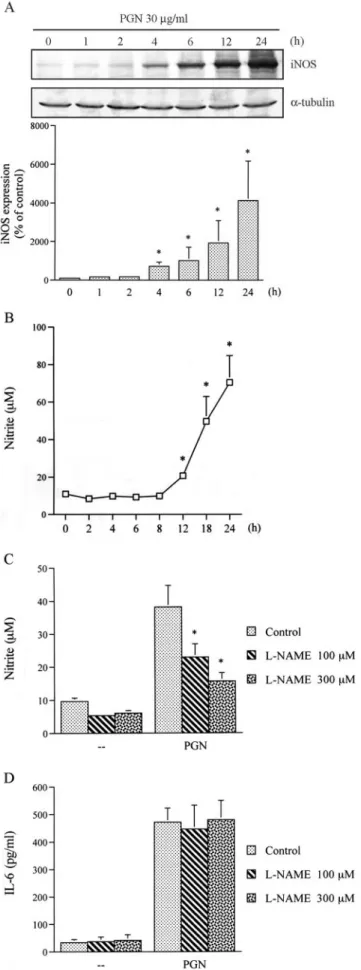
NO is not involved in PGN-induced IL-6 release
Treatment with 30g/ml PGN for various time intervals induced iNOS expression and nitrite release in a time-dependent manner (Fig. 10, A and B). After 24 h of treatment with 30g/ml PGN, the nitrite release had increased by ⬃539 ⫾ 131% (Fig. 10B). To explore whether NO might mediate PGN-induced IL-6 release, a nonselective inhibitor of NOS,L-NAME, was used. As shown in Fig. 10C, pretreatment of RAW 264.7 macrophages withL-NAME (100 and 300 M) markedly inhibited the PGN-induced nitrite release by 38 ⫾ 14% and 79 ⫾ 9%, respectively. However,L- NAME (100 and 300M) did not affect PGN-induced IL-6 release (Fig. 10D).
Positive feedback of COX-2-generated PGE2in PGN-induced COX-2 expression
We further examined whether PGN-induced COX-2 expression occurs via positive feedback with the COX-2-generated PGE2sig- naling pathway. As shown in Fig. 11A, pretreatment of RAW 264.7 macrophages with 1M NS398, 10 M indomethacin, and 1M KT5720 inhibited PGN-induced COX-2 expression by 53 ⫾ 10%, 58⫾ 13%, and 91 ⫾ 5%, respectively. Furthermore, treat- ment of RAW 264.7 macrophages with PGE2(0.01–1M) and 8-bromo-cAMP (30 –300M) also resulted in increases in COX-2 expression in concentration-dependent manners. When cells were treated with 1 M PGE2 or 300 M 8-bromo-cAMP for 24 h, COX-2 expression increased by⬃241 ⫾ 67% or 1701 ⫾ 243%, respectively (Fig. 11, B and C). These results suggest that PGN- induced COX-2 expression can be regulated partially through pos- itive feedback of COX-2-generated PGE2 and subsequently through cAMP/PKA signaling pathways.
FIGURE 7. Involvement of PGE2formation and PKA activation in PGN-mediated p65 Ser276phosphorylation (-p) in RAW 264.7 macro- phages. A, RAW 264.7 macrophages were treated with 30g/ml PGN for 2, 4, 6, 8, or 12 h, and p65 phosphorylation at Ser276was shown by im- munoblotting with an Ab specific for phosphorylated p65 at Ser276(upper panel). Equal loading in each lane is shown by the similar intensities of p65 (lower panel). Typical traces are representative of three experiments with similar results. B, Cells were pretreated with 1M NS398 (NS) and 3 M KT5720 (KT) for 30 min and then treated with 30g/ml PGN for another 6 h. p65 phosphorylation at Ser276was shown by immunoblotting with an Ab specific for phosphorylated p65 at Ser276(top panel). Equal loading in each lane is shown by the similar intensities of p65 (middle panel). Typical traces are representative of three experiments with similar results, pre- sented as the mean⫾ SE. ⴱ, p ⬍ 0.05 as compared with the PGN treatment group.
Discussion
In this study, we show that PGN induces IL-6 production in RAW 264.7 macrophages by a mechanism involving COX-2 induction, PGE2release, and PKA activation. Several lines of evidence sug- gest that PGE2may play a vital role in IL-6 production (30 –34).
It has been shown that exogenous PGE2 can stimulate IL-6 pro- duction in macrophages and astrocytes (31, 39, 40). Furthermore, it is well established that eicosanoid-producing enzymes, such as COX-2, are expressed in RAW 264.7 macrophages and are regu- lated by many factors, including cytokines and infectious agents FIGURE 8. Involvement of COX-2-
generated PGE2, PKA activation, and IL-6 formation in PGN-mediated NF-B activa- tion in RAW 264.7 macrophages. A, Cells were pretreated for 30 min with 50 M PDTC and then stimulated with 30g/ml PGN or 1M PGE2for 24 h. Media were collected to measure IL-6. Results are ex- pressed as the mean⫾ SE of three indepen- dent experiments performed in triplicate.ⴱ, p ⬍ 0.05 as compared with the PGN or PGE2 treatment group, respectively. B, Cells were treated with 30g/ml PGN for the indicated time interval. The nuclear ex- tracts were then prepared, and NF-B-spe- cific DNA-protein complex formation was determined by EMSA as described in Ma- terials and Methods. Top band, NF-B. C, Cells were incubated with 30g/ml PGN for 30 min. The nuclear extract was pre- pared, and EMSA was performed as de- scribed above. Top band, NF-B. Results of a competition experiment using 50-fold unlabeled NF-B oligonucleotide (50⫻
competitor) and a supershift experiment with 4g of the anti-p65 or anti-p50 Ab performed on the nuclear extract from PGN treatment are also shown. Typical traces are representative of two experiments with sim- ilar results. D and E, Cells were pretreated with 1 M NS398 (NS), 3 M KT5720 (KT), or 0.3 ng/ml anti-IL-6 Ab for 30 min and then stimulated with 30g/ml PGN for another 30 min (D) or 6 h (E) of treatment, respectively. Nuclear extracts were pre- pared for determination of NF-B-specific DNA-protein complex formation by EMSA as described above. Typical traces are rep- resentative of two experiments with similar results.
(35, 41, 42). Furthermore, COX-2 is thought to contribute to the generation of PGs at sites of inflammation (27). Because PGN has been shown to stimulate COX-2 protein expression after 2 h of treatment (35), we hypothesized that COX-2 products may be in- volved in mediating the PGN-induced increase in IL-6 production.
Our study has revealed that PGN induced PGE2formation in a time-dependent manner. The respective increases after 2, 4, 6, 8, 12, 18, and 24 h of treatment were 3-, 7-, 9-, 16-, 23-, 26-, and 24-fold of the basal level, paralleling the increase in COX-2 ex- pression stimulated by PGN (35). We also found that PGE2added to the culture medium increases IL-6 production and that the non- selective COX inhibitor indomethacin and the selective COX-2 inhibitor NS398 blocked PGN-induced IL-6 production. These re- sults indicate that COX-2-generated PGE2plays a critical role in PGN-stimulated IL-6 production. Furthermore, we found that PGN induces iNOS expression and nitrite release and that the nonselec- tive NOS inhibitor, L-NAME, did not inhibit PGN-induced IL-6 production, suggesting that iNOS expression and NO formation are not involved in the signaling pathway of PGN-induced IL-6 production. These findings support those from another study on LPS (32), a cell wall component of Gram-negative bacteria, in J774.2 macrophages. We also found that treatment of RAW 264.7 cells with PGE2and the PKA activator 8-bromo-cAMP resulted in increases in COX-2 expression and that indomethacin, NS398, and the PKA inhibitor KT5720 blocked PGN-induced COX-2 expres- sion. These results suggest that PGN-induced COX-2 expression may be partially regulated through positive feedback of COX-2- generated PGE2and subsequently through cAMP/PKA signaling pathways.
The action of PGE2 occurs via four different transmembrane receptors, namely EP1, EP2, EP3, and EP4 (28). Previous studies demonstrated that RAW 264.7 macrophages express EP2, EP3, and EP4, but not EP1, receptors (38). We found that the EP2 an- tagonist AH6809 and the EP4 antagonist AH23848 markedly in- hibited PGN-induced IL-6 production. The combination of AH6809 and AH23848 showed a more marked inhibitory effect.
Although AH23848 is also a thromboxane A2 receptor (TP) an- tagonist, RAW 264.7 macrophages do not express the TP (38).
Therefore, we ruled out the possibility that the inhibitory effect of AH23848 on PGN-induced IL-6 release occurs via the TP. Previ- ous studies have indicated that sulprostone, butaprost, and miso- prostol are agonists for EP1/EP3, EP2, and EP2/EP3/EP4, respec- tively (43, 44). In this study, we found that butaprost, misoprostol, and misoprostol in the presence of the EP2 antagonist AH6809 resulted in IL-6 release, whereas sulprostone did not. These results suggest that PGN-stimulated IL-6 production is mediated via the EP2 and EP4 receptors. EP2 and EP4 are G-protein-coupled re- ceptors that activate adenylyl cyclase upon ligand binding and re- sult in increased cAMP levels and activation of PKA (29). In this study, we found that PGN induced cAMP formation and that NS398, AH6809, and AH23848 inhibited PGN-induced cAMP formation. Furthermore, the specific PKA inhibitor suppressed PGN-induced IL-6 production. The increase in cAMP formation was approximately parallel to the levels of endogenously produced
ⴱ, p ⬍ 0.05 as compared with the PGN (A, C, and D) or 8-bromo-cAMP (D) treatment group, respectively. B, RAW 264.7 macrophages were tran- siently transfected with 0.3g of pGL2-ELAM-Luc and 0.3 g of pBK- CMV-LacZ for 24 h. Cells were stimulated with IL-6 (1–10 ng/ml) for another 24 h. Luciferase activities were determined as described above.
The level of induction of luciferase activity was compared with that of cells without IL-6 treatment. Data represent the mean⫾ SE of three experiments performed in duplicate.ⴱ, p ⬍ 0.05 as compared with the basal level.
FIGURE 9. Involvement of COX-2-generated PGE2, EP2, and EP4 re- ceptors, IL-6 formation, p38 MAPK, and PKC activation in PGN-mediated NF-B activation in RAW 264.7 macrophages. RAW 264.7 macrophages were transiently transfected with 0.3g of pGL2-ELAM-Luc and 0.3 g of pBK-CMV-LacZ for 24 h. Cells were pretreated with 10M indometh- acin, 1M NS398, 3 M KT5720, 0.3 ng/ml anti-IL-6 Ab (A), 3 M AH6809, 30M AH23848, 3 M AH6809 ⫹ 30 M AH23848 (C), 1 M Ro31-8220, or 1M SB203580 (D) for 30 min and then stimulated with 30g/ml PGN (A, C, and D) or 300 nM 8-bromo-cAMP (D) for another 24 h. Luciferase activities were determined as described in Materials and Methods. The level of induction of luciferase activity was compared with that of cells without PGN (A, C, and D) or 8-bromo-cAMP (D) treatment.
Data represent the mean⫾ SE of three experiments performed in duplicate.
PGE2stimulated by PGN. These results suggest that COX-2-gen- erated PGE2acts as an autocrine/paracrine factor for stimulating PGN-induced IL-6 production via the EP2/EP4 receptor-mediated cAMP/PKA signaling pathways. This suggestion is further sup- ported by previous reports that LPS induces an increase in cAMP levels through PGE2 formation in peritoneal macrophages and RAW 264.7 macrophages (45, 46). A previous report also indi- cated that in cultured Caco-2 cells, the cAMP-dependent PKA sig- naling pathway is involved in IL-1-induced IL-6 production (47).
In mice and humans, the IL-6 promoter has many transcription factors including NF-B in the 5⬘ region of the IL-6 gene (11, 12).
Several studies have demonstrated that NF-B plays a vital role in mediating the up-regulation of IL-6 protein induced by several inflammatory mediators (48, 49). We found that the NF-B inhib- itor PDTC inhibited PGN- and PGE2-induced IL-6 production, suggesting that PGE2-dependent NF-B activation is required for PGN-induced IL-6 production. Short term (5– 60 min) treatment of cells with PGN did not cause an increase in cAMP formation, whereas long term (2–12 h) treatment of cells induced cAMP for- mation, with a maximum effect at 4 – 8 h after PGN treatment.
Furthermore, stimulation of cells with PGN resulted in a two waves of formation of the NF-B-specific DNA-protein complex.
The first wave of NF-B activation occurred at 10–60 min of treatment, whereas the later wave occurred at 2–12 h of treatment.
We also found that a specific COX-2 inhibitor and a PKA inhibitor inhibited the PGN-induced later wave of NF-B-specific DNA- protein complex formation, but not the first wave of NF-B acti- vation. These results suggest that PGN-induced IL-6 production requires two separate activation steps for NF-B: the first wave of NF-B activation may be PGE2/cAMP-independent; whereas the later wave of NF-B activation may be PGE2/cAMP dependent.
It has been shown that the cAMP/PKA pathway is involved in LPS-induced NF-B activation in RAW 264.7 macrophages (46).
PKA was found to mediate NF-B activation through the IKK␣
complex in J774.2 macrophages (50). In the present study, we found that the PGN-mediated increase in IKK␣ activity is a de- layed event. The respective increases after 2, 4, 6, and 8 h of treatment were 0.5-, 0.6-, 2.5-, and 2.1-fold of the basal level, with the maximum effect at 6 – 8 h treatment, paralleling the increase in cAMP formation. The later wave activation of DNA-protein com- plex formation caused by PGN showed an increase after 2 h of treatment and a maximal level at 8 –12 h of treatment; this oc- curred downstream of IKK␣ activation. We also found that a specific COX-2 inhibitor and a PKA inhibitor inhibit the PGN- induced increase in IKK␣ activation and B luciferase activity.
Furthermore, exogenous PGE2and the direct PKA activator 8-bro- mo-cAMP also cause IKK␣ activation or an increase in B lu- ciferase activity. These results indicate that IKK␣-dependent
representative of three independent experiments that gave essentially iden- tical results. The extents of iNOS and␣-tubulin protein expressions were quantitated using a densitometer with scientific imaging systems. The rel- ative level was calculated as a percentage of the control level. Results are expressed as the mean⫾ SE of three independent experiments performed in triplicate.ⴱ, p ⬍ 0.05 as compared with the control group. Equal loading in each lane is demonstrated by similar intensities of␣-tubulin. B, Cells were incubated with 30g/ml PGN for the indicated time intervals. Media were collected to measure nitrite release. Results are expressed as the mean⫾ SE of three independent experiments performed in triplicate. ⴱ, p⬍ 0.05 as compared with the control group. C and D, Cells were pre- treated for 30 min with vehicle orL-NAME (100 and 300M) and then stimulated with 30g/ml PGN for 24 h. Media were collected to measure of nitrite (C) and IL-6 (D), respectively. Results are expressed as the mean⫾ SE of four independent experiments performed in triplicate. ⴱ, p ⬍ 0.05 as compared with the PGN treatment group.
FIGURE 10. NO is not involved in PGN-mediated IL-6 production in RAW 264.7 macrophages. A, Cells were incubated with 30g/ml PGN for the indicated time intervals and then immunodetected using specific Abs against iNOS or␣-tubulin as described in Materials and Methods. Data are
NF-B activation occurs downstream of the signaling pathway of COX-2-generated PGE2and PKA activation stimulated by PGN.
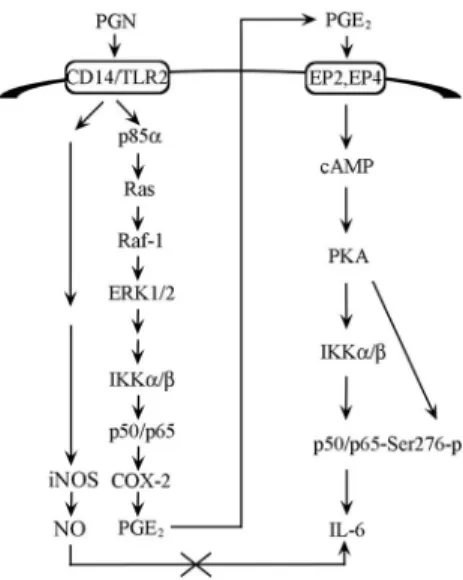
Moreover, we also showed that the EP2 antagonist, AH6809, and the EP4 receptor antagonist, AH23848, inhibited the PGN-induced increase inB luciferase activity. The combination of AH6809 and AH23848 resulted in a more marked inhibitory effect in the PGN- induced increase inB luciferase activity. These results suggest that COX-2-generated PGE2induced by PGN occurs via EP2 and EP4 receptor activation by mediating NF-B activation. Previous studies have also shown that IL-6 induces NF-B activation in intestinal epithelial cells (51). Therefore, it is possible that IL-6 production is involved in PGN-induced NF-B activation. In the present study, we found that IL-6 caused an increase inB lucif- erase activity and that the anti-IL-6 Ab inhibited the PGN-induced later wave of NF-B-specific DNA-protein complex formation and an increase in B luciferase activity. These results suggest that IL-6 production also acts as an autocrine/paracrine factor for PGN- induced NF-B activation. In this study, we also found that a PKC inhibitor (Ro31-8220) and a p38 MAPK inhibitor (SB203580) in- hibited the PGN- and 8-bromo-cAMP-induced increase inB lu- ciferase activity, suggesting that PKA regulates the activities of PKC and p38 MAPK that leads to NF-B activation caused by PGN. This suggestion is further supported by a previous report that FIGURE 12. Schematic summary of signal transduction by PGN induc- tion of macrophage IL-6 production in RAW 264.7 macrophages. PGN might activate the Ras/Raf-1/ERK pathway through recruitment of Ras and p85␣ to TLR2 to mediate an increase in IKK␣ activity and p50/p65 (NF-B) activation, which lead to COX-2 expression and PGE2release.
PGN-induced PGE2release result in activation of the EP2 and EP4 recep- tors and the cAMP/PKA pathway, which in turn increase IKK␣ activity, p65 phosphorylation at Ser276, and NF-B activation, and finally induce IL-6 production in RAW 264.7 macrophages. However, PGN-induced NO release is not involved in the signaling pathway of PGN-induced IL-6 production.
demonstrated by the similar intensities of␣-tubulin. Typical traces are representative of three experiments with similar results, which are pre- sented as the mean⫾ SE. ⴱ, p ⬍ 0.05 as compared with PGN treatment.
In B and C, cells were incubated with PGE2(0.01–1M) (B) or 8-bromo- cAMP (30 –300M) (C) for 24 h, and then COX-2 or ␣-tubulin protein levels were determined. Equal loading in each lane is shown by the similar intensities of␣-tubulin. Traces represent results from three independent experiments, presented as the mean⫾ SE. ⴱ, p ⬍ 0.05 as compared with the control group.
FIGURE 11. Positive feedback of COX-2-generated PGE2involved in PGN-mediated COX-2 expression in RAW 264.7 macrophages. A, Cells were pretreated with 1M NS398 (NS), 10 M indomethacin (Indo), and 3M KT5720 (KT) for 30 min followed by stimulation with 30 g/ml PGN for another 24 h, and COX-2 expression was determined by immu- noblotting with an Ab specific for COX-2. Equal loading in each lane is