國立臺灣大學生物資源暨農學院昆蟲學系 博士論文
Department of Entomology
College of Bioresources and Agriculture National Taiwan University
Doctoral Dissertation
微波防治蟲害之新穎途徑與物理通則探討 Studies on a novel approach and physics of
microwave insect pest control
蔡有方 Yu-Fang Tsai
指導教授:柯俊成 博士 朱國瑞 博士 Advisors: Chiun-Cheng Ko, Ph.D.
Kwo Ray Chu, Ph.D.
中華民國 108 年 7 月
July, 2019
誌謝
與其說本書是我個人的論文,不如說是一個跨領域團隊的努力成果。本論文最 大的推手柯俊成教授與朱國瑞教授,可說是我生命中最重要的貴人。柯老師從我讀 碩士班開始,九年來持續指導我的研究技巧、幫我爭取各種機會,更如慈父關心我 的生活與身心健康;朱老師鼓勵、帶領我走出舒適圈踏入物理學領域,將作研究的 好習慣與十八般武藝傾囊相授,更全額支援研究與生活經費並提供實驗室數十年 累積的儀器與各行各業專業人脈拓展我的視野。此外,姜惟元教授與 Larry Barnett 博士不僅親自參與本論文多數實驗,傳授我世界級的實驗技巧、指導實驗室所有儀 器的操作與維護、多次提出至關重要的修改建議,更分別製作 24 GHz EIO 與 27 MHz 射頻加熱系統供實驗使用。事實上,說他們也是我的指導教授一點也不為過。
臺大應用電磁實驗室 (原清大高頻電磁實驗室) 畢業的學長們也是本研究關 鍵助力:陳漢穎副總、鄭復興博士分別從業界和中科院提供資源幫助研究進行,指 導實驗並擔任我的論文口試委員;鄧亘皓博士協助解決研究過程中和未來本研究 會遇到的許多難題;吳佳勳博士、張存續教授、陳仕宏系主任提供合作機會,並傳 授許多研究的經驗;林明勳先生協助紅外線熱像儀測溫模式改良,並發表極化電荷 屏蔽效應論文供我參考;曹明雄博士製作的微波管讓我完成許多初期試驗;吳光磊 博士協助初期實驗,並參與設計新微波管;蔡頤錦博士協助微波系統測試安裝。
本論文完成也拜多位昆蟲學家所賜:姚美吉博士、彭武康教授提供實驗用昆蟲 樣本,在研究過程中提供許多寶貴建議和叮嚀,更擔任我的資格考出題和論文口試 委員;楊恩誠教授參與執行第一個微波計畫、指導昆蟲生理學知識並擔任資格考出 題委員;張俊哲系主任指導研究生自我管理的要點,也不時給我鼓勵;Matan Shelomi 教授指導昆蟲生理學知識與研究昆蟲學問題時的各種切入方法。
感謝昆蟲分類研究室和應用電磁實驗室同仁:廖治榮博士數年來與我在同實 驗室工作,提供許多研究和生活的指導與建議;曹昌旺大總管協助行政並調度經費 支援;廖證翔先生、高士弼先生、陳宜婷小姐、江建宇先生與我一起執行微波防治 病蟲害研究,一同經歷實驗的甘苦;曹又仁先生、寧方俞小姐、李怡儂小姐與我分 享對實驗和生活的各種想法;劉立中先生、陳冠文先生協助應用電磁實驗室業務,
並將我實驗中的發現作更深入的物理學探討;昆蟲分類研究室同仁李曉芹小姐、謝 涵宇小姐、張景雅小姐、林育脩先生、吳倩誼小姐、林亞琍小姐,及應用電磁實驗 室同仁黃榆傑先生、張培哲先生、李國豪先生、賴資穎小姐的協助,在此一併感謝。
感謝臺大和工商業界的行政人員在研究過程中協助處理行政事宜。特別感謝 以下對我付出遠超過業務範圍的朋友們:主計室湯子儀小姐、採購組劉乙萳小姐耐 心指導報帳、採購的辦理要訣,還與我一起分享各種零食和生活點滴;物理系林佳 燕小姐、陳雅薰小姐、季力偉先生、周宜樺小姐、胡靚小姐、楊紫瀅小姐、吳財榮 先生指導行政流程、公文潤稿,有些人還被我硬拗擔任採購經辦;金工廠高添利先 生協助處理急件加工;自強基金會鄒怡杏小姐、宏碩系統鍾佩真小姐、賴怡君小姐 協助產學合作行政流程,包容我緩慢的行政效率;謝雨蓁先生協助安裝微波系統。
感謝我的牽手慧容七年來始終如一的愛和無怨無悔的陪伴支持,讓我維持繼
續前進的動力,感謝囍聚造型師派派、攝影顧問 Stanley、總監 Emma、禮服秘書
Cindy、攝影師阿德提供無可挑剔的婚紗服務,讓拍婚紗甚至變成寫論文過程中的 紓壓活動。感謝朋友林亨奕先生、林延錫先生、李柏勳先生、廖宏恩先生、谷田浩 一先生陪我去山上抓蟲。感謝爸爸、媽媽和家人長期信任與付出成就現在的我。
中文摘要
昆蟲危害會對儲物的品質和數量造成很嚴重的影響。利用極端的溫度殺死害 蟲是最常見的物理防治法,而介電加熱到昆蟲的致死溫度是其中最快速的方式。雖 經過往昔數十年研究,目前的技術仍亟待改進,我們乃對此議題進行更深入的物理
通則探討,並提出一創新途徑。我們建立一套24 GHz 加熱系統,此頻率遠高於往
昔研究所使用之頻率,但仍屬科學、工業及醫療之使用頻段。微波源為千瓦級連續 波分布作用震盪器,可穩定輸出可調整的微波。我們建立的微波暗室加熱系統也能 應用於其他需要均勻加熱、可控制且能解析的微波研究。我們比較 27 MHz、2.45 GHz、24 GHz 發現,數據的準確度與電場均勻度呈正相關,與加熱時間呈負相關,
顯示使用 24 GHz 高頻微波加熱並將樣本置於微波暗室內最能夠均勻且快速加熱。
我們也研究在均勻電場下,微波加熱時產生不同溫度分布的內在成因。在均勻電場
下,加熱的物體溫度具有 25.2% 的差異,其最主要原因為極化電荷的屏蔽效應造
成,單此效應即佔前述 25.2% 中的 18.2%。我們發現另加熱物體的形狀和介電損
耗分別對不均勻溫度具有3.4% 和 3.6%的加成。我們也以 24 GHz 達成差溫加熱,
並研究害蟲與寄主差溫加熱效應中的科學議題。我們認為24 GHz 高頻微波,以圓
極化波加熱均勻且快速,具有極高的應用潛力。
關鍵字:微波加熱、害蟲防治、24 GHz、圓極化波、差溫加熱
ABSTRACT
Insect pest infestation can cause severe quantity and quality losses to stored- agricultural products. Control insect pests with extreme temperatures are the mainstream physical treatments, dielectric heating insect to the lethal temperature is the fastest approach amongst all. For more demanding applications, current techniques need to be refined, which in turn requires a deeper understanding of the scientific issues involved, and a novel, fundamentally different approach. We built a microwave applicator for uniform irradiation of small samples at the relatively high, and rarely exploited, ISM frequency of 24 GHz. The radiation source is a 1 kW CW EIO with stable and variable output power. This type of applicator may also be a suitable tool for microwave-assisted research for which irradiation uniformity, controllability, and in situ diagnostics are desired. Among the comparison with 27 MHz, 2.45 GHz, and 24 GHz, the accuracy of data increases with more uniform field distribution and shorter heating time. suggests an anechoic chamber and circularly-polarized, 24-GHz microwave heats most fast and uniform. We also studied the inherent causes of percentage temperature spread in microwave heating. The percentage temperature spread due to all causes is measured to be at a high value of 25.2%, the dominant contribution is identified to be the polarization- charge shielding, which accounts for a percentage spread of ~18.2% relative to the overall value of 25.2%. Two other causes, sample shape and dielectric loss variations, each contribute to a percentage spread of ~3.4% and ~3.6%. We also demonstrate and study the scientific issues in differential heating. We suggest that high frequency such as 24- GHz heating with circularly-polarized wave shows great promising.
Key words: microwave heating, insect control, 24 GHz, circular polarized wave, differential heating
CONTENTS
口試委員會審定書 ... #
誌謝 ... i
中文摘要 ... ii
ABSTRACT ... iii
CONTENTS ... iv
LIST OF FIGURES ... vii
LIST OF TABLES ... xi
Chapter 1 Introduction ... 1
Chapter 2 Dielectric heating applicators for uniform irradiation ... 6
2.1 A 24-GHz Microwave applicator for uniform irradiation by circularly polarized waves in an anechoic chamber ... 6
2.1.1 Introduction ... 6
2.1.1.1. Anechoic chamber ... 6
2.1.1.2. Factors affecting radiation uniformity and possible remedies ... 7
2.1.1.3. A brief description of the current scheme ... 8
2.1.2 Anechoic chamber, radiation source, and diagnostic tools ... 9
2.1.3 Calculated radiation pattern and intensity ... 12
2.1.3.1. Radiation pattern ... 12
2.1.3.2. Radiation Intensity ... 14
2.1.4 Polarization measurement ... 17
2.1.5 Microwave heating test ... 18
2.1.6 Summary ... 19
2.2 3 kW, 2.45-GHz applicator for comparison ... 20
2.3 A 27-MHz RF applicator allows uniform heating under extremely high electric field ... 21
Chapter 3 A comparative study of insect heating by microwave irradiation at different frequencies ... 24
3.1 Introduction ... 24
3.1.1 Historical background ... 24
3.1.2 The frequency choice ... 25
3.1.3 RF and low-frequency microwave treatments ... 25
3.1.4 High-frequency microwave treatments ... 26
3.1.5 Motivation and objectives of the current study ... 28
3.2 Materials and methods ... 29
3.2.1 Microwave system ... 29
3.2.2 Insect ... 30
3.2.3 Heating process ... 30
3.3 Experimental results ... 31
3.4 Summary and discussion ... 33
Chapter 4 A study of some inherent causes for non-uniform microwave heating ... 36
4.1 Introduction ... 36
4.2 Theoretical considerations ... 38
4.3 Experimental setup ... 40
4.3.1 Applicator ... 40
4.3.2 Calibration of radiation uniformity ... 41
4.3.3 Sample preparation and experimental procedure ... 42
4.4 Experimental results ... 44
4.4.1 Polarization-charge shielding in thermal images and its significance 44 4.4.2 Quantification of the heating non-uniformity ... 46
4.4.3 Temperature spread of rice grains heated in isolation by linearly- polarized waves ... 47
4.4.4 Contribution to heating non-uniformity by the polarization-charge shielding effect ... 48
4.4.5 Contributions to heating non-uniformity by sample variations in shape and dielectric loss ... 50
4.5 Summary and discussion ... 51
Chapter 5 A physical study of microwave disinfestation by selective heating of insects embedded in rice grains ... 54
5.1 Introduction ... 54
5.2 Experimental setup, sample, and procedures ... 56
5.3 Experimental results and analyses ... 58
5.4 Summary and discussion ... 61
Chapter 6 Conclusion ... 63
Reference ... 65
Appendix ... 73
LIST OF FIGURES
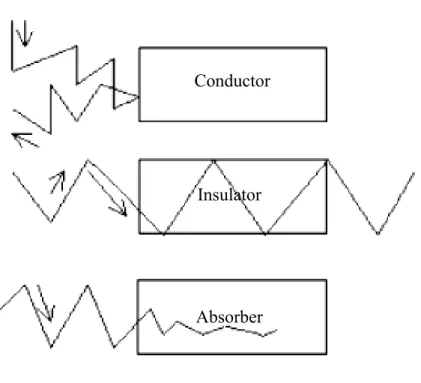
Fig. 1.1 Microwave absorption characteristics for conductor, insulator and absorber.
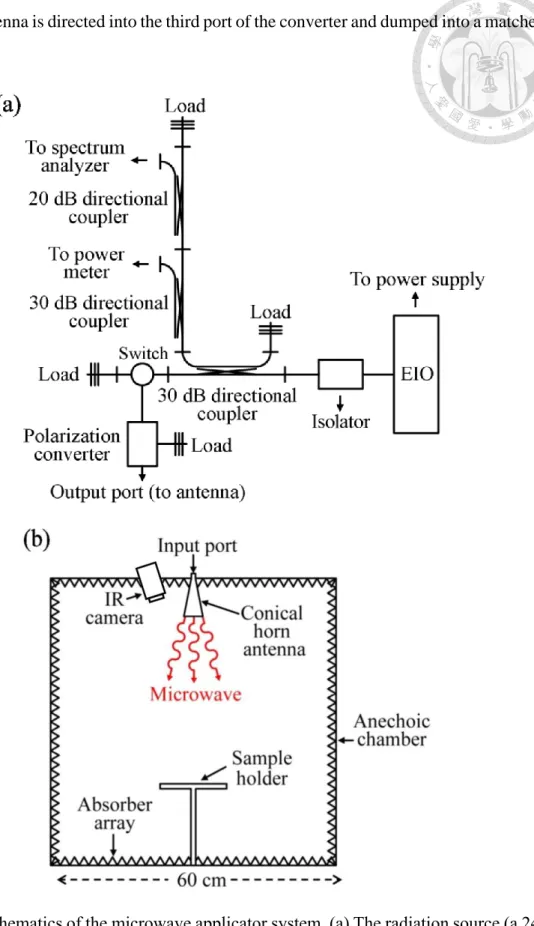
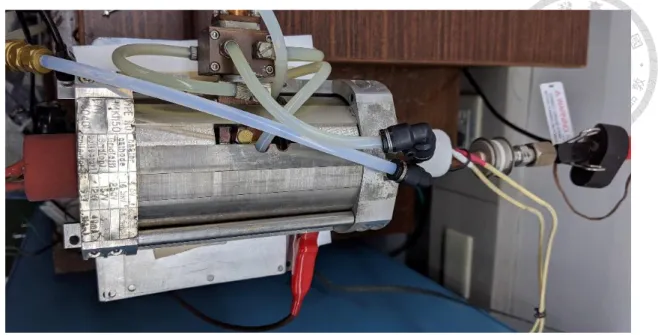
It allows direct energy deposition into the interior of an absorber (Jones et al., 2002). ... 2 Fig. 1.2 6kW, 27 MHz heating system built by the research team of Washington State University (Hou et al., 2016; Jiao et al., 2012). ... 3 Fig. 2.1 Schematics of the microwave applicator system. (a) The radiation source (a 24-GHz EIO), diagnostic circuit, and polarization converter. (b) The anechoic chamber, conical horn antenna, and IR camera. ... 10 Fig. 2.2 Photo of the 1 kW, 24-GHz extended interaction oscillator (EIO). Two EIOs have been used as 24 GHz microwave source for the study of this dissertation.
They were designed and machined by M. H. Tsao and W. Y. Chiang. ... 11 Fig. 2.3 Shape and dimensions of the conical horn antenna for 24 GHz radiation emission. The antenna aperture is on the z = 0 plane. The center of the aperture is the origin of both the spherical (r, θ, φ) and Cartesian (x, y, z) coordinates. ... 12 Fig. 2.4 The conical horn antenna and the simulated electric field pattern (inside and outside the horn) on the x-z plane. ... 13 Fig. 2.5 Simulated power gain G(θ, φ) (in decibels) of the conical horn antenna as functions of θ for φ = 0 and 90o. (a) Circularly polarized radiation. (b) Radiation linearly polarized in the x-direction. ... 14 Fig. 2.6 Simulated radiation intensity P (power per unit area) along the z-axis. The input wave into the antenna is circularly polarized with a total power of 1 kW.
In the far-zone (z > 20 cm), P closely follows the 1/z2 scaling law. ... 15 Fig. 2.7 Simulated intensity profiles on the sample (x-y) plane at different sample-to-
aperture distances (z). The input wave is the same as in Fig. 2.6. Intensity profiles in y are identical. ... 15 Fig. 2.8 Radiation uniformity on the sample (denoted by Pmin/Pmax) for three sample diameters (D) as a function of the sample-to-aperture distance (z). The input wave is the same as in Fig. 2.6. ... 16 Fig. 2.9 Liquid-crystal displays of the actual 24 GHz radiation patterns on a target plane. (a) Circularly polarized radiation. (b) Linearly polarized radiation. The liquid crystal sheet has an operating range of 35 oC-40 oC. It is in blue color at T > 40 oC, red color at T ≈ 35 oC, and dark at T < 35 oC. ... 18 Fig. 2.10 Temperature of the SiC sample measured with the IR camera (horizontal axis) and the thermocouple sensor (vertical axis). Identical readings would fall on the dashed line. ... 19 Fig. 2.11 Temperature rise profile at the center of the SiC sample as measured by the IR camera. ... 19 Fig. 2.12 Schematics of the 1.5 kW, 27-MHz RF heating system. It was designed and built by L. R. Barnett. ... 22 Fig. 3.1 Mortality counts of adult rice weevils in hard red winter wheat medium as functions of the medium temperature, 8 days after exposure to 39 MHz and 2.45 GHz fields, and 5 days after exposure to 10.6 GHz fields. Data reproduced from Fig. 3 of Nelson and Stetson (1974) and Fig. 6 of Halverson et al. (1996). ... 27 Fig. 3.2 The (a) real and (b) simulated heating rates of fruit fly pupae at 24 GHz, 2.45 GHz, and 27 MHz. The simulation was done and graphed by H. H. Teng. . 32
Fig. 3.3 Mortality rate of oriental fruit fly pupae as a function of its cuticle temperature, 10 days after exposure to microwaves. ... 32 Fig. 3.4 The (a) diagram, and (b) temperature distribution on a half-peeled oriental fruit fly pupa heated by 24 GHz microwave. ... 33 Fig. 4.1 Initial heating rate of the absorber sheet as a function of the azimuthal angle (θ) on a circular ring of 1 cm, 2 cm, and 3 cm radius by (a) a circularly- polarized wave and (b) a linearly-polarized wave. The initial heating rate closely represents the incident wave intensity I0. ... 42 Fig. 4.2 Thermal images of 6 sets of samples, each containing 3 grains separated by gap widths (d) of 0, 0.1 mm, 0.2 mm, 0.5 mm, 1 mm, and 2 mm. ... 45 Fig. 4.3 The temperature of the center grain in Fig. 3 as a function of d... 45 Fig. 4.4 Thermal images of 12 isolated grains heated by (a) a linearly-polarized wave and (b) a circularly-polarized wave. ... 48 Fig. 4.5 Temperature distribution of a large group of grains heated by linearly-
polarized waves (solid line) under conditions identical to Fig. 4.4 (a) and by circularly-polarized waves (dashed line) under conditions identical to Fig. 4.4 (b). The initial grain temperature is 25±0.2 oC. The percentage temperature spread [defined in Eq. (4.6)] is 25.2% for the solid line and 7.0% for the dashed line. ... 49 Fig. 4.6 Temperature distribution of a large group of screened grains (solid line) and unscreened grains (dashed line), both heated by circularly-polarized waves.
The percentage temperature spreads are 3.6% for screened grains and 7.0%
for unscreened grains. ... 51 Fig. 5.1 IR image of a weevil infested rice grain heats by 24 GHz microwave. The rice weevil adult is embedded in the grain (on the left, with a higher temperature).
... 58 Fig. 5.2 Measured differential temperature (dots) as a function of heating time ranging from 0.05 to 96 seconds. ... 59 Fig. 5.3 Measured weevil temperature as a function of rice temperature in linearly-
polarized waves and circularly-polarized waves. The heating time is 0.1 seconds. ... 60 Fig. 5.4 IR image of a weevil infested rice grain heats by 24 GHz microwave for 0.05 second. The head temperature of rice weevil is higher by ~15 ºC than its body temperature and higher by ~34 ºC than its host medium. ... 60
LIST OF TABLES
Table 1.1 The response of stored-product insects to temperature (Fields, 1992). ... 1 Table 2.1 Intensity uniformity (denoted by the minimum-to-maximum ratio) on round samples of different diameters (D) at different distances (z) from the antenna aperture. ... 16 Table 2.2 Intensity uniformity (denoted by the minimum-to-maximum ratio) on round samples of different diameters (D) at different distances (z) from the antenna aperture. ... 21 Table 4.1 Dielectric properties of rice of different cultivars and forms measured at different frequencies at the room temperature. ... 43 Table 4.2 Measured min-to-max temperature range, standard deviation, and percentage temperature spread of the heated grains. ... 52
Chapter 1 Introduction
Insect pest infestation can cause severe quantity and quality losses to stored- agricultural products. It is a major concern due to the estimated loss rates are up to 9% in developed countries and to 20% or more in developing countries (Phillips and Throne, 2010). Chemical fumigation, the cheap and most widely adopted method, is under a gradually phase-out due to toxic residues, environmental toxicities, and development of insect resistance. This leads to the resurrection of some alternative approaches, such as ionizing radiation, controlled atmosphere treatments, cold treatments, conventional heating, and dielectric heating (Wang and Tang, 2001). Control insect pests with extreme temperatures are the mainstream physical treatments [(Fields, 1992), see Table 1.1], dielectric heating insect to the lethal temperature is the fastest approach amongst all.
Table 1.1 The response of stored-product insects to temperature (Fields, 1992).
Zone Temp. (ºC) Effect
Lethal
62+ death in seconds
50 – 60 death in minutes
45 death in hours
Suboptimum
35 development stops
33 – 35 development slows
Optimum 25 – 33 maximum rate of development
Suboptimum
13 – 25 development slows
13 – 20 development stops
Lethal
5 death in days (unacclimated), movement stops -10 – -5 death in weeks to months (acclimated) -25 – -15 death in minutes, insects freeze
Compare to conventional heating (i.e. hot air, vapor, water), dielectric heating allows direct energy deposition into the interior of an object, thus shows more rapid heating rate and great promising in insect control, especially in primary insect pests of stored-products as they burrow inside their hosts. In addition to the extremely rapid heating rate, dielectric heating leaves no residues to environment. On the other hand, microwave absorption differs amongst materials, makes it easy to design practical heating systems. This method has long been employed in scientific research and industrial applications in food processing (Piyasena et al., 2003), wood drying (Resch, 2006), ceramic sintering (Oghbaei and Mirzaee, 2010; Rybakov et al., 2013), medical treatment (Rosen et al., 2002), and environmental engineering (Jones et al., 2002).
Fig. 1.1 Microwave absorption characteristics for conductor, insulator and absorber. It allows direct energy deposition into the interior of an absorber (Jones et al., 2002).
Frings (1952) reviewed the early studies of dielectric heating in insect control, which was started in 1920s and mostly conducted at a radio frequency (RF) between 1 and 50 MHz. Subsequent studies, reviewed by Nelson (1996), extended the frequency range up to the microwave band, mostly at 2.45 GHz (the frequency for household microwave
Conductor
Insulator
Absorber
ovens). These reviews have extensively addressed the basic issues of insect heating by RF and microwave energy, such as the dependence of insect heating rate and mortality on time, frequency, field intensity, dielectric constant, as well as a certain species’
susceptibility atdifferent developmental stages. Recent studies, reviewed by Hou et al.
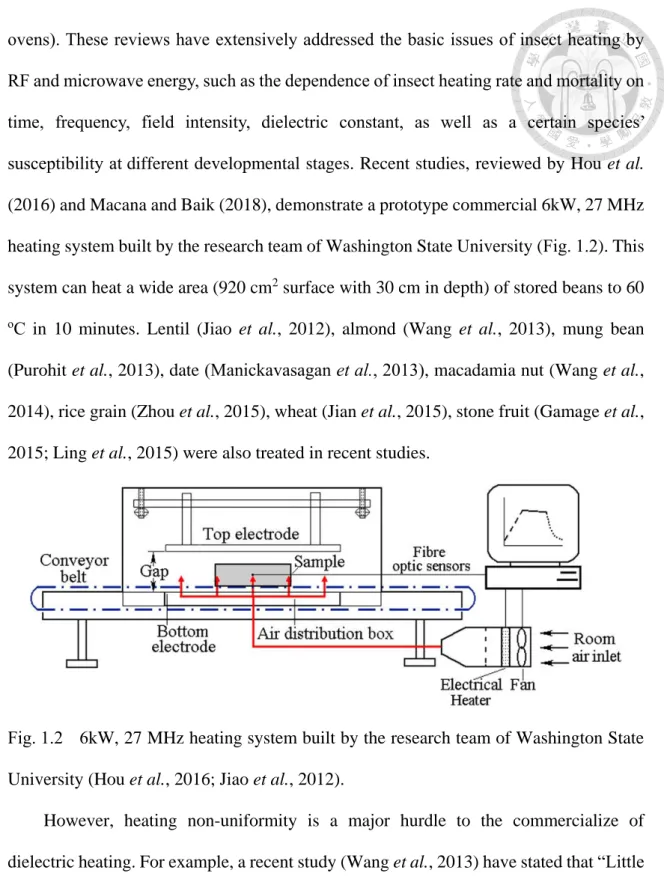
(2016) and Macana and Baik (2018), demonstrate a prototype commercial 6kW, 27 MHz heating system built by the research team of Washington State University (Fig. 1.2). This system can heat a wide area (920 cm2 surface with 30 cm in depth) of stored beans to 60
oC in 10 minutes. Lentil (Jiao et al., 2012), almond (Wang et al., 2013), mung bean (Purohit et al., 2013), date (Manickavasagan et al., 2013), macadamia nut (Wang et al., 2014), rice grain (Zhou et al., 2015), wheat (Jian et al., 2015), stone fruit (Gamage et al., 2015; Ling et al., 2015) were also treated in recent studies.
Fig. 1.2 6kW, 27 MHz heating system built by the research team of Washington State University (Hou et al., 2016; Jiao et al., 2012).
However, heating non-uniformity is a major hurdle to the commercialize of dielectric heating. For example, a recent study (Wang et al., 2013) have stated that “Little progress in developing successful commercial RF treatments was made in the 1990s mainly due to non-uniform heating. The non-uniform heating in RF treated produce caused by variations in thermal properties and moisture contents in a non-uniform RF field would result in either insect survival or thermal damage to treated commodities.” It
also mentioned an unrealized remedy: “An attractive feature of insect control using RF energy is the possible differential heating of insects in agricultural commodities. If the insects were heated faster than the commodities they infest, insects would reach a lethal temperature while the commodities would be heated to a lower temperature that does not cause quality loss.”
Heating non-uniformity and slow heating also limited the accuracy of the obtaining data scientifically in studies involve in dielectric heating. For example, in many previous insect control studies using 2.45 GHz microwave (Carpenter and Livstone, 1971; Frings, 1952; Kirkpatrick and Roberts, 1971; Locatelli and Traversa, 1989; Nelson and Stetson, 1974; Watters, 1976), researchers conducted their experiments in microwave ovens to speed up the heating rate. However, standing waves generate a non-uniformity field distribution inside the microwave oven and thus causes non-reproducible experimental results. The studies (Kraus et al., 2018; Nelson and Stetson, 1974; Wang et al., 2003;
Wang et al., 2013) claim to have achieved differential (selective) heating often overlooked the heat convection loss differentiations between the inner and the surface parts of the heating objects.
For more demanding applications, current techniques need to be refined, which in turn requires a deeper understanding of the scientific issues involved, and a novel, fundamentally different approach. Here, I describe the details of the novel approach and physics of microwave insect control.
Chapter 2 describe the details of the dielectric heating applicators using in this dissertation. These applicators possess a > 99% of heating uniformity and thus allows high quality, reproducible data obtaining. Chapter 3 compares the heating of some mainstream frequencies with our new approach: 24 GHz. Chapter 4 describe and quantify some causes for non-uniform heating, and provide a remedy for it. Chapter 5 describe
some physical details on differential heating, the unique advantage of dielectric heating.
Chapter 6 gives a general discussion and conclusion to this study.
Chapter 2 Dielectric heating applicators for uniform irradiation
Microwave applicators are widely employed for materials heating in scientific research and industrial applications, such as food processing, wood drying, ceramic sintering, chemical synthesis, waste treatment, and, in this study, insect control. For the majority of microwave applicators, materials are heated in the standing waves of a resonant cavity, which can be highly efficient in energy consumption, but often lacks the field uniformity and controllability required for a scientific study. In this chapter, we describe all applicators using in this study.
2.1 A 24-GHz Microwave applicator for uniform irradiation by circularly polarized waves in an anechoic chamber
2.1.1 Introduction
Here, we report a microwave applicator for rapid heating of small samples by highly uniform irradiation. It features an anechoic chamber, a 24-GHz microwave source, and a linear-to-circular polarization converter. With a rather low energy efficiency, such an applicator functions mainly as a research tool. This chapter discusses the significance of its special features and describes the structure, in situ diagnostic tools, calculated and measured field patterns, and a preliminary heating test of the overall system.
2.1.1.1. Anechoic chamber
The main body of the microwave applicator under study is a radio-frequency anechoic chamber, which serves two basic functions: negligible reflections on the inner walls and near-total isolation of waves inside and outside the chamber. It thus simulates
an open-space environment for electromagnetic wave propagation. A typical anechoic chamber consists of a radiation-shielded room or box with inner walls lined with arrays of pyramidal or wedge shaped radiation absorbers. The absorbers are usually made of carbon-impregnated foam materials (Qin and Brosseau, 2012). A good impedance match between air and the tapered absorbers allows the radiation to enter the array to be almost totally absorbed. Early development of radiation absorbing materials and anechoic chambers has been reviewed (Emerson, 1973). The shape of an individual absorber is optimized for low reflection (Catalkaya and Kent, 2012; Nornikman et al., 2009; Shen et al., 2013), and the performance of an absorber array can be theoretically modeled (Chung
and Chuah, 2003; Holloway et al., 1997; Janaswamy, 1992; Kuester and Holloway, 1994) and experimentally measured (DeWitt and Burnside, 1988). Highly effective absorber arrays are now commercially available for a wide range of frequencies above 100 MHz.
The anechoic chamber is commonly used for the measurement of antenna radiation patterns, radar cross-sections, and the electromagnetic compatibility of various equipment.
Much less frequently, simple anechoic chambers have also been built for sample irradiation at relatively high power levels as in, for example, insect control experiments by microwave heating (Shayesteh and Barthakur, 1996). For such experiments, irradiation uniformity is highly desirable and often essential. As discussed below, the uniformity criteria involve both the spatial distribution of the radiation intensity and the polarization of the radiation field.
2.1.1.2. Factors affecting radiation uniformity and possible remedies
Emitted from a conical horn antenna into an anechoic chamber, the radiation intensity on a plane perpendicular to the horn axis can be spatially non-uniform in both the radial and azimuthal directions. The radial non-uniformity can be minimized with a small sample size or at a distance far away from the antenna, while the azimuthal non-
uniformity can in principle be completely eliminated with a circularly polarized wave.
In addition, at a given point on the sample, the heating rate depends not only on the radiation intensity, but also on the orientation of the sample with respect to the electric field. This is due to the shielding effects by the induced polarization charges on the sample (Lin et al., 2015). A linearly polarized wave, even if spatially uniform in intensity, is intrinsically non-uniform in polarization. Again, this can be fully remedied in the rapidly rotating electric field of a circularly polarized wave. For these reasons, we have employed a circularly polarized wave as the heating source.
2.1.1.3. A brief description of the current scheme
Most microwave applicators use a resonant cavity in which microwave energy can be efficiently deposited to a large quantity of material. However, the standing waves in the cavity are spatially non-uniform and their patterns vary in the presence of the load.
By comparison, direct irradiation by a horn antenna has too low an energy efficiency for production purposes, but it provides a highly desirable environment to conduct uniform and controllable heating experiments.
Both the 2.45 GHz and 24 GHz frequencies belong to the industrial, scientific, and medical (ISM) bands (see Appendix). The 2.45 GHz radiation is commonly used in scientific research, industrial processing, as well as household microwave ovens, whereas the 24 GHz radiation has been rarely exploited for microwave heating. Given the same (complex) dielectric constant and electric field strength, materials absorb microwave energy at a rate proportional to the frequency (Piyasena et al., 2003). On the other hand, the penetration depth decreases with an increased heating rate. Consider, for example, a sample with a dielectric constant of 4 and loss tangent of 0.1. The penetration depths at 2.45 and 24 GHz are, respectively, 9.8 cm and 1 cm. Thus, the 24 GHz radiation results in non-uniform heating of thick samples. However, for thin samples, it affords the
advantage of both uniform and rapid heating. This has motivated us to specialize in small sample irradiation experiments in the 24-24.25 GHz ISM band.
The applicator system under study features a 24-GHz extended interaction oscillator (EIO) (Gilmour, 1986) as the radiation source and a polarization converter (Barnett et al., 1989; Chang et al., 1999) to convert its linearly polarized output wave into the circularly polarized state. Section 2.1.2 describes the structural details of the anechoic chamber, the radiation source, the polarization converter, and in situ diagnostic tools. Section 2.1.3 calculates the conical horn antenna radiation patterns in both linear and circular polarizations. In Sec. 2.1.4, the polarization state of the actual antenna radiation is diagnosed with intensity measurements and visually observed via the color changes of heat-sensitive liquid crystals. A microwave heating test is presented in Sec. 2.1.5, followed by a brief summary in Sec. 2.1.6.
2.1.2 Anechoic chamber, radiation source, and diagnostic tools
Schematics of the applicator system are shown in [Fig. 2.1(a)], the anechoic chamber [Fig. 2.1(b)], 60 cm x 60 cm x 60 cm in size, is shielded with thin aluminum plates on all six sides. Heat-resistant commercial absorber arrays with a very small reflectivity (<10–4 at normal incidence) are attached to the chamber sides of the aluminum plates.
The radiation source is a lab-made, 24 GHz EIO with a nominal power rating of 1 kW CW (Chen et al., 2000)(Fig. 2.2). It weighs approximately 5 kg. The EIO output wave is in the TE10 mode of a WR42 rectangular waveguide (1.067 cm x 0.533 cm). As shown in Fig. 2.1 (a), it first passes through a calibrated diagnostic circuit for power and frequency measurements before entering a high-power compatible polarization converter, in which it is converted into a circularly polarized wave and exits the output port in the TE11 mode of a circular waveguide (0.44 cm in radius). The isolator and polarization converter also functions as protective devices for the source. Almost all the reflected wave
from the antenna is directed into the third port of the converter and dumped into a matched load.
Fig. 2.1 Schematics of the microwave applicator system. (a) The radiation source (a 24- GHz EIO), diagnostic circuit, and polarization converter. (b) The anechoic chamber, conical horn antenna, and IR camera.
Fig. 2.2 Photo of the 1 kW, 24-GHz extended interaction oscillator (EIO). Two EIOs have been used as 24 GHz microwave source for the study of this dissertation. They were designed and machined by M. H. Tsao and W. Y. Chiang.
The circularly polarized wave is input into a conical horn antenna, from which it is radiated into the chamber [Fig. 2.1 (b)]. The power transmission efficiency through the polarization converter is measured to be approximately 94.8%. The antenna reflects only 0.07% of the input wave according to HFSS simulations. The EIO output wave can also be arranged to enter the antenna through a rectangular-to-circular waveguide converter as a linearly polarized wave.
The sample, placed on a holder with adjustable height, receives the radiation along the axis of the antenna. An IR camera is attached to a rotatable mount, which can slide horizontally on the top wall or up and down on a side wall. It records digital images of the sample while it is being heated, thereby giving the temperature rise profile at any point on the sample surface. A visible-light camera can be interchanged with the IR camera to obtain snapshots of the sample. Both cameras have been used in the tests described below.
2.1.3 Calculated radiation pattern and intensity 2.1.3.1. Radiation pattern
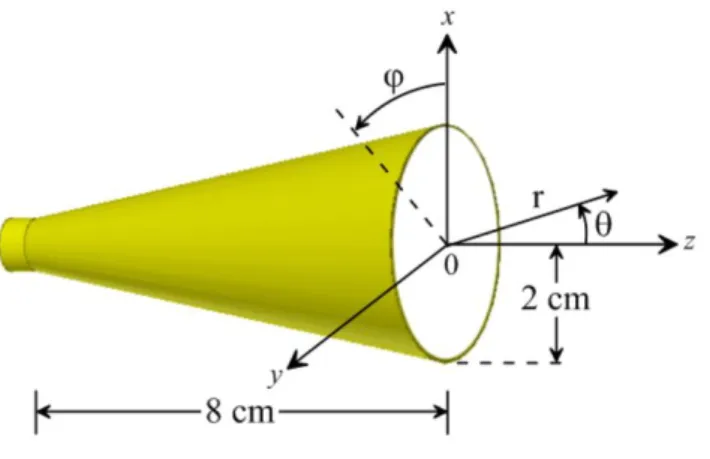
Fig. 2.3 shows the shape and dimensions of the conical horn antenna employed for the 24 GHz radiation emission. The antenna aperture is on the z = 0 plane. The center of the aperture is the origin of both the spherical (r, θ, φ) and Cartesian (x, y, z) coordinates.
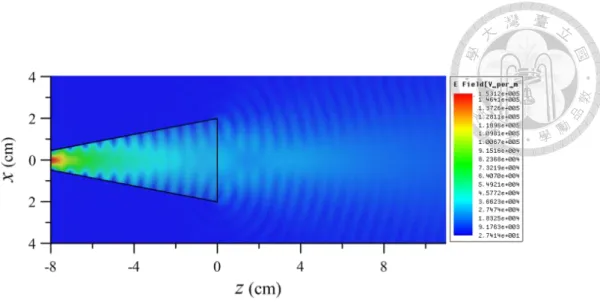
The input port of the antenna is a circular waveguide matched to the output port of the polarization converter. It accommodates both circularly and linearly polarized input waves. The radiation pattern can be readily simulated with the HFSS code under outgoing-wave boundary conditions. In the simulation, a TE11 circularly-polarized wave is input into the antenna. Fig. 2.4 displays the horn antenna and the simulated electric field pattern (inside and outside the horn) on the x-z plane. In the far zone, the radiation becomes a spherical electromagnetic wave with a wavelength of 1.25 cm and a maximum intensity along the z-axis (θ = 0). The angular spread in the far zone is shown below in fine resolution in terms of the power gain.
Fig. 2.3 Shape and dimensions of the conical horn antenna for 24 GHz radiation emission. The antenna aperture is on the z = 0 plane. The center of the aperture is the origin of both the spherical (r, θ, φ) and Cartesian (x, y, z) coordinates.
Fig. 2.4 The conical horn antenna and the simulated electric field pattern (inside and outside the horn) on the x-z plane.
The power gain [G(θ, φ)] of an antenna in the direction (θ, φ) is a dimensionless parameter defined as the radiated power per unit solid angle [P(θ, φ)] relative to that of a reference antenna emitting the same total power (Ptotal) isotropically, i.e.
4 ( , )
( , ) P
G Ptotal
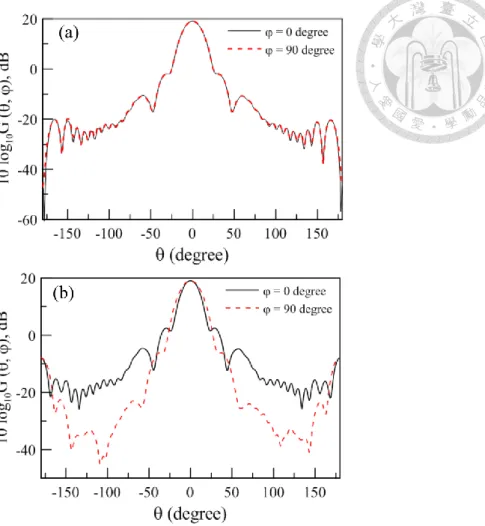
(2.1) Fig. 2.5 (a) plots the power gain in logarithmic scale [10log10G(θ, φ)] as a function of θ for a circularly polarized TE11 input wave. Profiles of the power gain at two azimuthal angles, φ = 0 and 90o, are shown. Within the numerical accuracy, the two profiles are essentially identical. For comparison, Fig. 2.5 (b) shows G(θ, φ) versus θ for a TE11 input wave linearly polarized in the x-direction. The gain profiles are again plotted for φ = 0 and 90o. Significant difference between the φ = 0 and 90o profiles indicates the expected non-uniformity in azimuthal angle φ. Multiple peaks in Fig. 2.5 correspond to the multiple lobes of typical antenna radiations. Most of the input power is radiated into the main lobe, a small portion in forward side lobes, and a negligible portion in backward side lobes.
Fig. 2.5 Simulated power gain G(θ, φ) (in decibels) of the conical horn antenna as functions of θ for φ = 0 and 90o. (a) Circularly polarized radiation. (b) Radiation linearly polarized in the x-direction.
2.1.3.2. Radiation Intensity
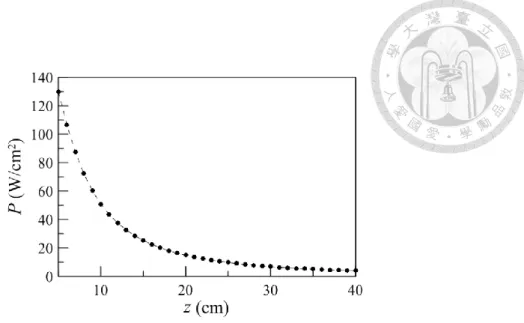
A small sample, placed on the sample holder [Fig. 2.1 (b)] at a certain distance (z) away from the antenna aperture, receives the radiation over a narrow cone in the main lobe, which peaks along the z-axis. For a circularly-polarized input wave with a total power of 1 kW, the radiation intensity P (power per unit area) along the z-axis is shown in Fig. 2.6. In the far-zone (z > 20 cm), P closely follows the 1/z2 scaling law. For the same input wave into the antenna, Fig. 2.7 plots the intensity profiles on the sample (x-y) plane at different sample-to-aperture distances (intensity profiles in y are identical). It is seen from these profiles that the radiation is weaker but more uniform at a larger distance
from the aperture.
Fig. 2.6 Simulated radiation intensity P (power per unit area) along the z-axis. The input wave into the antenna is circularly polarized with a total power of 1 kW. In the far-zone (z > 20 cm), P closely follows the 1/z2 scaling law.
Fig. 2.7 Simulated intensity profiles on the sample (x-y) plane at different sample-to- aperture distances (z). The input wave is the same as in Fig. 2.6. Intensity profiles in y are identical.
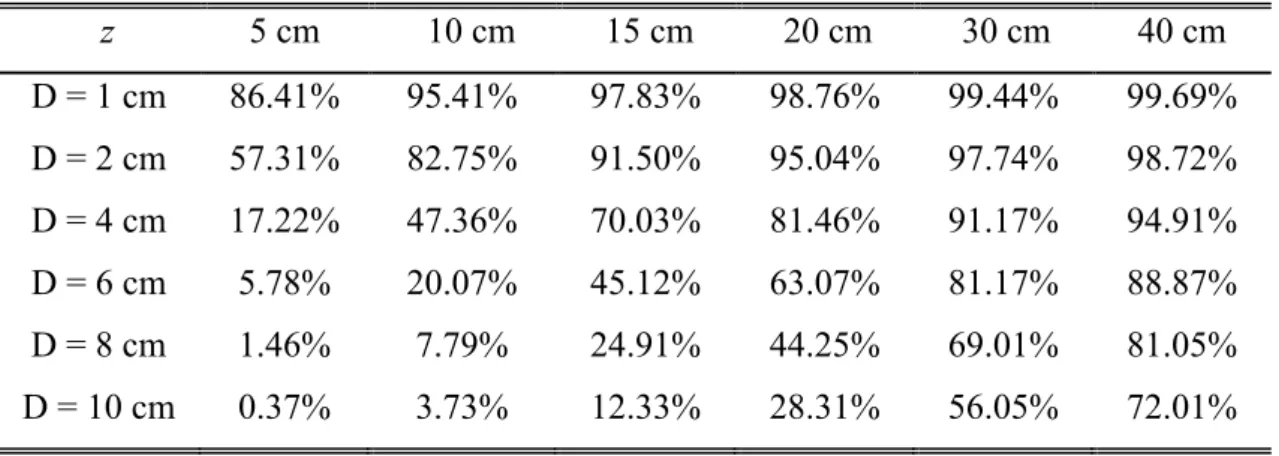
To quantify the degree of uniformity, let Pmax and Pmin be the maximum and minimum intensities on, respectively, the center and edge of a round sample of diameter D. Fig. 2.8 shows Pmin/Pmax for three sample diameters as a function of the sample-to-aperture distance z. The same information in precise numbers is given in Table 2.1. As an example
of good intensity uniformity, Pmin/Pmax values for a sample 1, 2, and 4 cm in diameter placed at z = 30 cm, are 99.44%, 97.74%, and 91.17%, respectively. By comparison, if the same samples were placed in the 24 GHz standing wave of a cavity, they would all see an intensity variation of nearly 100%. As a final note, we have shown that the applicator can provide an environment for uniform microwave irradiation. However, the power actually absorbed by the sample depends upon a number of other factors, such as the sample homogeneity, reflection, and scattering, etc.
Fig. 2.8 Radiation uniformity on the sample (denoted by Pmin/Pmax) for three sample diameters (D) as a function of the sample-to-aperture distance (z). The input wave is the same as in Fig. 2.6.
Table 2.1 Intensity uniformity (denoted by the minimum-to-maximum ratio) on round samples of different diameters (D) at different distances (z) from the antenna aperture.
z 5 cm 10 cm 15 cm 20 cm 30 cm 40 cm
D = 1 cm 86.41% 95.41% 97.83% 98.76% 99.44% 99.69%
D = 2 cm 57.31% 82.75% 91.50% 95.04% 97.74% 98.72%
D = 4 cm 17.22% 47.36% 70.03% 81.46% 91.17% 94.91%
D = 6 cm 5.78% 20.07% 45.12% 63.07% 81.17% 88.87%
D = 8 cm 1.46% 7.79% 24.91% 44.25% 69.01% 81.05%
D = 10 cm 0.37% 3.73% 12.33% 28.31% 56.05% 72.01%
2.1.4 Polarization measurement
In the far zone, the radiation field at a point on the z-axis can be decomposed into two linearly polarized components as
E = Exex+ Eyey (2.2) Consider a WR28 rectangular waveguide in the far zone with its axis coinciding with the z-axis. If the broad sides of the waveguide are parallel to the x-direction (y-direction), only the Ey (Ex) component can enter the waveguide in the lowest order TE10 mode. This allows an intensity measurement of either component [denoted by P(Ex) and P(Ey)]
through a rotation of the rectangular waveguide. To quantify the degree of polarization, we define a polarization factor as
( ) ( )
( ) ( )
P Ex P Ey F P Ex P Ey
(2.3)
Thus, F = 0 indicates a purely circularly polarized wave, while F = 1 indicates a purely linearly polarized wave in the x-direction. In the experimental tests, if a circularly polarized wave is emitted into the chamber, intensity measurement yields F = 0.034, indicating a high degree of circular polarization. If a wave linearly polarized in the x- direction is emitted into the chamber, intensity measurement gives F = 0.992, indicating a high degree of linear polarization.
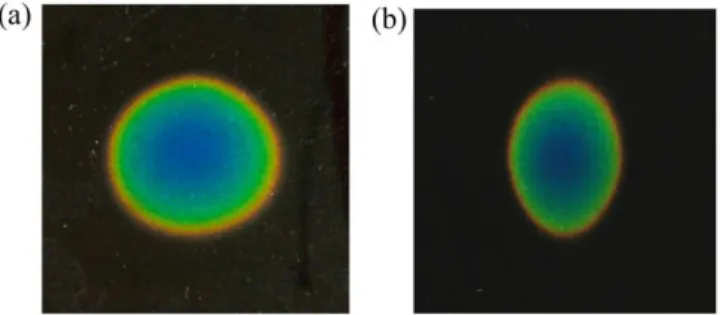
For a visual observation of the actual radiation pattern on a target plane, a 12”x12”
temperature-sensitive liquid crystal sheet (with an operating range of 35 oC-40 oC) is placed horizontally on the sample holder. The liquid crystal changes color upon a slight temperature rise. The color change depends on the radiation intensity, thus the incident radiation pattern is profiled as colors. Fig. 2.9 (a) and (b) are the liquid-crystal displays of circularly and linearly polarized radiation patterns, respectively. The power was kept at a low level so that the maximum temperature (at the center) was approximately 40 oC.
These images clearly demonstrate a much higher degree of azimuthal uniformity of the circularly polarized wave.
Fig. 2.9 Liquid-crystal displays of the actual 24 GHz radiation patterns on a target plane.
(a) Circularly polarized radiation. (b) Linearly polarized radiation. The liquid crystal sheet has an operating range of 35 oC-40 oC. It is in blue color at T > 40 oC, red color at T ≈ 35
oC, and dark at T < 35 oC.
2.1.5 Microwave heating test
As a first step for the microwave heating test, we have performed a temperature calibration for the IR camera using a thin piece of SiC ceramic with a 0.4 cm x 0.4 cm surface area. The SiC ceramic was attached to the flat surface of a resistor, which was Ohmic heated with an electrical current. The sample was maintained at a sequence of thermal equilibrium states for temperature measurements with both the IR camera and a thermocouple sensor. With the sample emissivity set at 0.8, the two readings are in very good agreement, as shown in Fig. 2.10.
The same SiC sample was then placed on a thermally insulated sample holder in the anechoic chamber and heated by 24 GHz irradiation at the intensity of 20.6 W/cm2. Fig.
2.11 shows the temperature rise profile at the center of the SiC sample as measured by the IR camera. The temperature rises linearly at the beginning and reaches 120oC in 10 sec. There is then increasing heat loss by air convection, resulting in saturation at 195 oC in approximately 100 sec. This preliminary test confirms the functionality of the
applicator as a research tool for rapid heating of a small sample to moderately high temperatures.
Fig. 2.10 Temperature of the SiC sample measured with the IR camera (horizontal axis) and the thermocouple sensor (vertical axis). Identical readings would fall on the dashed line.
Fig. 2.11 Temperature rise profile at the center of the SiC sample as measured by the IR camera.
2.1.6 Summary
A microwave applicator has been built for uniform irradiation of small samples at the relatively high, and rarely exploited, ISM frequency of 24 GHz. The radiation source
is a 1 kW CW EIO with stable and variable output power. The radiation is circularly polarized and hence possesses a high degree of azimuthal uniformity, in both intensity and polarization. The main and auxiliary diagnostic tools are, respectively, an infrared camera and a visible-light camera. Simulated and observed radiation patterns as well as preliminary heating test indicate its functionality for our planned insect control experiments and related physics studies, such as organic synthesis and medicinal chemistry (Alcázar and Oehlrich, 2010). This type of applicator may also be a suitable tool for microwave-assisted research for which irradiation uniformity, controllability, and in situ diagnostics are desired. The original version of this microwave applicator study
was published on Rev. Sci. Instrum. 85, 084703 [see Chiang et al. (2014)].
2.2 3 kW, 2.45-GHz applicator for comparison
The 2.45-GHz applicator system designed for the study is similar to the 24-GHz system. Instead of the lab made EIO, the 2.45-GHz system uses a 3 kW CW magnetron manufactured by Wave Power Technology Incorporation as radiation source. The output wave first passes through a circulator and a calibrated diagnostic circuit for power and reflection measurements, then entering the anechoic chamber [Fig. 2.1 (b)] via WR340 rectangular waveguides and a rectangular horn antenna. Almost all the reflected wave from the antenna is directed into the circulator and dumped into a matched load. The sample, placed on a holder with adjustable height, receives the radiation along the axis of the antenna. An IR camera is attached to a rotatable mount, which can slide horizontally on the top wall or up and down on a side wall. It records digital images of the sample while it is being heated, thereby giving the temperature rise profile at any point on the sample surface. A visible-light camera can be interchanged with the IR camera to obtain snapshots of the sample. Unlike the 24-GHz system, there is no polarization converter in
the 2.45-GHz system. The input wave is linearly-polarized, thus, the sample will be placed in the parallel orientation to the wave electric field to make it faster and uniformly heated during each experiment replications.
Let Pmax and Pmin be the maximum and minimum intensities on, respectively, the center and edge of a round sample of diameter D. Table 2.2 shows Pmin/Pmax in precise numbers for three sample diameters as a function of the sample-to-aperture distance z. As an example of good intensity uniformity, Pmin/Pmax values for a sample 1, 2, and 4 cm in diameter placed at z = 20 cm, are 99.99%, 99.68%, and 98.19%, respectively. By comparison, if the same samples were placed in the 2.45 GHz standing wave of a cavity, they would all see a much higher intensity variation.
Table 2.2 Intensity uniformity (denoted by the minimum-to-maximum ratio) on round samples of different diameters (D) at different distances (z) from the antenna aperture.
z 10 cm 15 cm 20 cm 25 cm 30 cm 40 cm
D = 1 cm 99.16% 99.62% 99.99% 100.08% 100.06% 100.02%
D = 2 cm 97.38% 98.74% 99.68% 99.95% 99.96% 99.93%
D = 4 cm 91.37% 95.63% 98.19% 99.09% 99.30% 99.44%
D = 6 cm 82.87% 90.95% 95.58% 97.39% 98.00% 98.55%
D = 8 cm 73.01% 85.06% 91.92% 94.91% 96.11% 97.28%
D = 10 cm 62.82% 78.29% 87.37% 91.70% 93.64% 95.64%
2.3 A 27-MHz RF applicator allows uniform heating under extremely high electric field
We also use a 27-MHz RF applicator system for rapid and uniform heating of small
quantity of samples (Fig. 2.12). It features a variable capacitor inside an aluminum applicator box. The following paragraph describes the details of its contents and functions.
This applicator functions mainly as a research tool for heating small objects under a uniform field, where the electric field can be raise to 10 kV/cm.
Fig. 2.12 Schematics of the 1.5 kW, 27-MHz RF heating system. It was designed and built by L. R. Barnett.
The system is tuned for low reflection at low power before applying higher power.
The RF is a 5 Watt transmitter source. The power pass through a 300 Watt solid state amplifier used to increase the 5 Watts up to approximate 100 Watts for the AL-1500 amplifier, where the power can be amplified from 100 Watts to 1.5 kW before it goes to the applicator box. The digital (and analog) power meter measures forward and reflected power, and has a reflection trip which connected to the amplifier for system protection.
The aluminum applicator box, with tuner controls to the variable capacitor inside, is assembled with screws and has clamp latches on the removable lid, keep the laboratory environment save from RF leakage. The configuration of the variable capacitor is a pi C- L-C matching circuit and can transform 50 Ohm impedance power from the transmitter up to at least 100 kOhm. There is no RF absorbing material between the capacitor plates, nearly 100% of the rf loss is in the inductor. The air-cooling inductor absorbs the RF loss
from the capacitor plates. The capacitor plates can be tuned to have a 0-5 cm gap width and switched among 7, 10, and 20 cm in radius.
The sample, which is placed between 2 aluminum capacitor plates, receives the radiation along the axis of the plates. An IR camera is attached to a rotatable mount at a distance of 30 cm from the center of the capacitor plates (outside the applicator box). It records digital images of the sample while it is being heated, thereby giving the temperature rise profile at any point on the sample surface. A visible-light camera can be interchanged with the IR camera to obtain snapshots of the sample.
Chapter 3 A comparative study of insect heating by microwave irradiation at different frequencies
Microwave insect control has been studied for decades where most of the experiments were conducted at the household microwave oven frequency of 2.45 GHz or below. Only few studies compare multiple frequencies amongst them. With relatively slow heating rate and non-uniform field distribution, the results are often imprecise. In this chapter, we present a comparative study in insect heating using three ISM frequencies with relatively uniform field distribution.
3.1 Introduction
3.1.1 Historical background
Research on insect control by electromagnetic waves started in the 1920s at a moderate pace. It has been gaining impetus since the signing of the Montreal Protocol in 1987, which stipulates a gradual phase out of substances harmful to the ozone layer including the widely used pesticide methyl bromide. Early studies, reviewed by Frings (1952), were mostly conducted at a radio frequency (RF) between 1 and 50 MHz.
Subsequent studies, reviewed by (Nelson, 1996), extended the frequency range up to the microwave band, mostly at 2.45 GHz (the frequency for household microwave ovens).
These studies have extensively addressed the basic issues of insect heating by RF and microwave energy, such as the dependence of insect heating rate and mortality on time, frequency, field intensity, dielectric constant, as well as a certain species’ susceptibility at different developmental stages.
3.1.2 The frequency choice
The heating time and field intensity are adjustable and insect-specific issues are inherent. That leaves the frequency to be a key parameter for choice. As discussed below, the determination of an optimum frequency depends on multiple considerations.
Assume a medium with a complex dielectric constant (relativity permittivity) of is immersed in an electric field E. The time averaged power (Pd) deposited to a unit volume of the medium is given by (Nelson, 1996)
where ε0 (= 8.854x10⁻¹² F/m) is the permittivity of vacuum and f is the wave frequency in Hz. Equation (3.1) shows that Pd is explicitly proportional to f. However, the dielectric loss factor ( ) increases sharply from 2.45 GHz to 10 MHz (Alfaifi et al., 2013; Nelson et al., 1998) and the field penetration depth decreases with increasing f. Furthermore, the
loss factor of the host medium must also be factored in so that the commodities is kept below the damaging temperature.
3.1.3 RF and low-frequency microwave treatments
In reality, the choice of a frequency is dictated by the available of radiation sources.
Powerful sources above 2.45 GH are expensive and not readily available. As a result, the vast majority of experiments were conducted at a few MHz up to 2.45 GHz. In this frequency range, theoretical modeling (Nelson and Charity, 1972) predicts that 1-100 MHz RF waves are more promising than microwaves for selective heating of insects. In a verification of this prediction, Nelson and Stetson (1974) treated adult rice weevils in wheat medium separately at 39 MHz and 2.45 GHz. They found that, when the adult rice weevils were heated to the lethal temperature, the wheat medium temperatures at these two frequencies differed by a factor of two: 40oC at 39 MHz and 83oC at 2.45 GHz (Fig.
r r j r
2 3
2 0 r (Watt/m ) (1) Pd fE
r
(3.1)
3.1). Other advantages of RF heating include deeper penetration and more uniform field exposure. These facts largely account for the current trend toward insect control by RF heating, particularly at the ISM frequencies of 27 and 40 MHz. As can be summarized from early and recent (Das et al., 2013; Shrestha and Baik, 2013; Wang and Tang, 2001;
Wang et al., 2014) papers, the effectiveness of insect control by RF and microwave energies has been well established, but it has yet to be accepted as a practical alternative to pesticides because of higher cost, uneven heating, and (in some cases) damages to the commodities.
3.1.4 High-frequency microwave treatments
In a different development in the late 1990s, Halverson et al. ventured into microwave frequencies well above 2.45 GHz (Halverson et al., 1998; Halverson et al., 1996; Halverson et al., 1999; Plarre et al., 1998). Their rationale was: while the loss factor of insects peaks in the commonly exploited region of 10-100 MHz (Alfaifi et al., 2013;
Nelson et al., 1998), the loss factor of water (a rich constituent of insects) also has a broad peak at 18 GHz (Gabriel et al., 1998). Selective heating of insects at high microwave frequencies is thus a distinct possibility. This hypothesis was tested at 10.6 GHz with encouraging results (Halverson et al., 1996). In their treatment of adult maize weevils in wheat medium, 100% mortality occurred (on average) at a medium temperature of 55oC (Fig. 3.1), which was 28oC lower than the 2.45-GHz data in Fig. 3.1, but 15oC higher than the 39-MHz data in Fig. 3.1. The 2.45-GHz and 10.6 GHz comparison supports the authors’ hypothesis. The 39-MHz and 10.6 GHz comparison suggests that still higher frequencies might be needed for a comparable performance to 39 MHz treatment. This was born out in subsequent experiments at 28 GHz (Plarre et al., 1998), which achieved 100% mortality of the maize weevil adults at a maximum wheat temperature of only 35oC.
The eggs and young larvae, shielded by the wheat kernels, were killed at a higher wheat
temperature (up to 52oC). This is a problem common to treatments at all frequencies.
In spite of the encouraging results presented by Halverson et al., high frequency activities appear to have suddenly subsided around 2000. Little (if any) work has since been reported at frequencies above 2.45 GHz. Treatments by high-frequency microwaves and RF waves are both effective, but radically different in terms of heating speed, penetration depth, applicator design, and practicability, etc. It may thus be argued that these two frequency regions, separated by three orders of magnitude, are mutually complementary in the sense each being an optimum region for a specific class of applications. For example, while RF waves can penetrate a thick layer of products, high- frequency microwaves possess the heating speed and focusing ability suitable for treatment of shallow infestations, even in an outdoor environment. For these reasons, the much less popular high-frequency microwave region warrants a further examination.
Fig. 3.1 Mortality counts of adult rice weevils in hard red winter wheat medium as functions of the medium temperature, 8 days after exposure to 39 MHz and 2.45 GHz fields, and 5 days after exposure to 10.6 GHz fields. Data reproduced from Fig. 3 of Nelson and Stetson (1974) and Fig. 6 of Halverson et al. (1996).
2.45 GHz
39 MHz 10.6 GHz
3.1.5 Motivation and objectives of the current study
We have chosen the pupa of the oriental fruit fly (Bactrocera dorsalis) as the sample material for the convenience of breeding and handling in large quantities. In comparison with the early work by Havelson et al., our study places the emphasis on a much improved method for mortality data acquisition in high-frequency heating and a quantitative demonstration of the dramatic difference in heating rates at low and high frequencies.
Other issues of importance, such as effects to the host medium and an energy-efficient applicator design, are not addressed in this preliminary study.
For a meaningful mortality count, it is important that all the samples be exposed to the same field intensity. In the case of RF heating, a parallel-plate applicator is usually used. The wavelength is so long (up to 10 m) that a sample holder can be easily placed in a uniform field region. However, at frequencies above 2.45 GHz, most applicators use an over-moded resonant cavity or waveguide, in which the standing waves have a null-to- null distance of approximately a quarter of wavelength. A sample dish 0.5 cm in radius would see a intensity variation of at least 6.5%, 80%, and 100% in a 2.45 GHz, 10.6 GHz, and 24 GHz cavity, respectively. Furthermore, the field pattern changes in the presence of the load, which makes it difficult to optimize the field uniformity. Relations between mortality count and field uniformity can be seen in Fig. 3.1. The root-mean-square deviations in these figures are approximately 2.673%, 5.585%, and 14.142% at 39 MHz, 2.45 GHz, and 10.6 GHz, respectively. The frequency-dependent deviations show a trend clearly consistent with the increasingly non-uniform exposure at higher frequencies.
Extrapolating the deviations to higher frequencies, we may easily conclude that a cavity or waveguide applicator will result in an unacceptable data spread at 24 GHz, the primary frequency for the present study. Furthermore, this trend also suggests a serious difficulty in getting an accurate measurement of the heating rate at 24 GHz. As a remedy
for both problems, we have developed an applicator in which the samples are heated by traveling waves emitted from a horn antenna. As described in Sec. 2.1, it provides a highly uniform and controllable environment for the mortality count experiments. However, it serves only as a useful tool for scientific data acquisition. Such data will provide the requisite information for a practical applicator design in which the microwave energy can be efficiently deposited to a large quantity of materials under treatment.
3.2 Materials and methods
3.2.1 Microwave system
Schematics of the microwave applicator system constructed for the present study are shown in Fig. 2.1. It features a lab-made, 24-GHz, kW-level extended interaction oscillator (EIO) (Chen et al., 2000) as the radiation source and an anechoic chamber for irradiation by a circularly polarized traveling wave. In Fig. 2.1 (a), the EIO output wave first passes through a calibrated diagnostic circuit (for power and frequency measurements) before entering a high-power compatible polarization converter, in which it is converted into a circularly polarized wave in the TE11 mode of a circular waveguide. The circularly polarized wave is then input into a conical horn antenna, from which it is radiated into the 60 cm x 50 cm x 60 cm anechoic chamber [Fig. 2.1 (b)].
The sample, placed on a holder with adjustable height, receives the radiation along the axis of the antenna. The radiation intensity on the sample can be spatially non- uniform in both the radial and azimuthal directions. The radial non-uniformity can be minimized with a small sample size or at a distance far away from the antenna, while the azimuthal non-uniformity can be completely eliminated with a circularly polarized wave. Consider, for example, a round sample 0.5 cm (1 cm) in radius placed at r = 30 cm. It receives the antenna radiation within θ = ±1o (±2o), corresponding to a maximum-
to-minimum intensity variation of 1.0% (2.7%). The same sample will see more uniform radiation if placed a longer distance away from the antenna.
An IR camera is attached to a rotatable mount, which can slide horizontally on the top wall or up and down on a side wall. It records digital images of the sample while it is being heated, thereby giving the temperature rise profile at any point on the sample surface. A visible-light camera can be interchanged with the IR camera to obtain snapshots of the sample.
3.2.2 Insect
Due to the oval appearance that can minimize the effect of polarization-charge shielding in microwave heating (see Chapter 4), pupae of oriental fruit fly (Bactrocera dorsalis) were used as insect material. Flies were initially collected from Taichung,
Taiwan in 1994 and established with artificial diet in growth chambers at Department of Entomology, National Taiwan University, Taipei, Taiwan. Flies were reared under 25 ± 3oC, approximately 50% RH, and photoperiod = 12:12 (L:D) h. Adults were treated with distilled water and a mixture of refined cane sugar (4 parts) and peptone (1 part); larvae were reared with a mixture of artificial diet. 4 to 6 – day old pupae were used as material.
3.2.3 Heating process
The fruit fly pupae were placed on polystyrene sample holder. The sample holder then placed into anechoic chamber and parallel to the antenna aperture. The distances from the aperture are 20 cm for 24 GHz, 11.5 cm for 2.45 GHz, and the gap width between 2 capacitor plates in 27 MHz system is 2 cm, to unify the irradiation intensity and field strength. 30 pupae were irradiated individually with 20 seconds for 24 GHz field, and 600 seconds for 2.45 GHz and 27 MHz. To let some pupae reach the lethal temperature in 24- and 2.45-GHz, 25 pupae were placed on the sample holder simultaneously and heated at
6, 8, or 10 seconds with 24 GHz microwave and 1,200 seconds with 2.45 GHz microwave, then separated and reared to adults for 10 days after irradiation. Highest temperature data on the cuticle of pupa were recorded by IR camera while irradiating, and mortality data were collected at 10 days after irradiation.
3.3 Experimental results
Heating rates of fruit fly pupae at 24 GHz, 2.45 GHz, and 27 MHz show on Fig. 3.2.
The trend of fruit fly pupae heating rates [Fig. 3.2 (a)] fits that of simulated heating rates [Fig. 3.2(b)]. The average heating rates of 24 GHz, 2.45 GHz, and 27 MHz under ~750 V/cm field strength are 2.44, 0.12, and 0.02 oC/s, respectively. In other words, 24 GHz heats approximate 20 times faster than 2.45 GHz heating and approximate 122 times faster than 27 MHz heating.
Fig. 3.3 shows the mortality rate of fruit fly pupae as a function of its cuticle temperature. The 100% mortality occurs while the cuticle of fly pupae reaches approximately 54 oC at both 24- and 2.45- GHz, which occurs at 7 seconds under 24 GHz field and approximately 600 seconds under 2.45 GHz field. However, the mortality rate start raising at approximately 45 oC and 50 oC at 24- and 2.45- GHz, respectively.
20 30 40 50 60 70 80
0 60 120 180 240 300
Temperature (o C)
Time (s)
f = 2.45 GHz f = 27 MHz f = 24 GHz
(a)
Fig. 3.2 The (a) real and (b) simulated heating rates of fruit fly pupae at 24 GHz, 2.45 GHz, and 27 MHz. The simulation was done and graphed by H. H. Teng.
Fig. 3.3 Mortality rate of oriental fruit fly pupae as a function of its cuticle temperature, 10 days after exposure to microwaves.
We further examined the cause of the difference trends of the fruit fly pupae mortality between 24 and 2.45 GHz by heating a half-peeled pupa [Fig. 3.4 (a)]. A 5-10
oC differential heating between the cuticle and the soft tissues inside occurred in 24-GHz heating [Fig. 3.4 (b)], suggest extremely fast heating leads to differential heating and the
0 20 40 60 80 100
30 35 40 45 50 55 60
Mortality (%)
Temeperature (
oC) (b)
f = 2.45 GHz f = 24 GHz
decreasing of observed lethal temperature. It also suggested the slow heating (i.e. low frequencies such as 2.45 GHz and 27 MHz heating) is highly unlikely to achieve differential heating. The physics of differential heating will be further discussed in Chapter 5 using rice weevil (Sitophilus oryzae) as material.
Fig. 3.4 The (a) diagram, and (b) temperature distribution on a half-peeled oriental fruit fly pupa heated by 24 GHz microwave.
3.4 Summary and discussion
We have presented a comparative study on the insect heating by three ISM frequencies: 24 GHz, 2.45 GHz, and 27 MHz. Heating experiments of high-frequency microwaves are conducted in anechoic chambers with diagnostic circuits, which provides a highly uniform radiation, allow reproducible data obtaining and thus more precise in the comparison among frequencies.