Modified Mininutritional Assessment Can Effectively Assess the Nutritional Status of Patients on Hemodialysis
Alan C. Tsai, PhD,*† Shu-Jen Lu, MS,* and Tsui-Lan Chang, MS*
Objective: We sought to determine whether the MNA (Mininutritional Assessment) would be an effective tool for assessing the nutritional status of patients undergoing hemodialysis.
Design: Purposive sampling.
Setting: Two hospital-managed hemodialysis centers in central Taiwan.
Patients: Subjects were 95 ambulatory patients older than 40 years without acute diseases or infections who had received hemodialysis treatment at the center for longer than 30 days.
Methods: Each subject was interviewed with a structured questionnaire to elicit basic personal data and health- and lifestyle-related information and answered questions on the Council on Nutrition Appetite Questionnaire and MNA. Serum biochemical data were obtained from their routine measurement. The nutritional status of each subject was graded with two modified MNA versions. MNA-TI adopted population-specific anthropometric cut-points, and MNA-TII further had the body mass index question deleted from the scale and question scores adjusted but main- tained the same 30 total points.
Results: Based on the strength of correlation with the key nutrition-related parameters including appetite status, serum creatinine, percent weight loss, hospital length of stay, number of prescribed drugs, and hemodialysis time, both modified MNA versions reflected the nutritional status of Taiwanese hemodialysis patients better than the Council on Nutrition Appetite Questionnaire. Serum albumin did not reflect nutritional status well in these hemodial- ysis patients. MNA-TI predicted 26.4% and MNA-TII predicted 29.5% of hemodialysis patients were either malnour- ished or at risk of malnutrition.
Conclusions: Both versions of the modified MNA are effective in assessing the nutritional status of hemodialysis patients. MNA-TII without body mass index is a significant improvement for hemodialysis patients because body weights fluctuate significantly between dialysis sessions.
Ó2009 by the National Kidney Foundation, Inc. All rights reserved.
This article has an online CPE activity available atwww.kidney.org/professionals/CRN/ceuMAIN.cfm
T
HE RISK OF MALNUTRITION in pa- tients on hemodialysis (HD) is high because these patients are likely to have depressed appetite, restricted diet, and increased dialysis-related loss of nutrients. Improving their nutritional status toprevent malnutrition-related complications is usu- ally a priority in their treatment program.1Tradi- tionally, clinicians rely on anthropometric measurements, food intake record, biochemical indicators, and nutrition or appetite assessments to evaluate the nutritional status of HD pa- tients.2–4 Proper application of these tools often requires professional knowledge or special train- ing, and some may involve invasive procedures.
Simpler and less involved assessment tools, espe- cially if noninvasive, are greatly desired for routine monitoring purposes. The MNA (Mininutritional Assessment) is a tool that meets these conditions. It does not involve any invasive procedures and usu- ally does not require extensive training to use it properly.5 It has been widely used in assessing the nutritional status of the elderly under various
*Graduate Institute of Long-Term Care, Asia University, Wufeng, Taichung, Taiwan.
†Human Nutrition Program, School of Public Health, University of Michigan, Ann Arbor, MI.
The study was supported in part with a grant-in-aid from the Department of Health of Taiwan.
Address reprint requests to Alan C. Tsai, PhD, Human Nutrition Program, School of Public Health, University of Michigan, Ann Arbor, MI 48109.E-mail: [email protected]
Ó2009 by the National Kidney Foundation, Inc. All rights reserved.
1051-2276/09/1905-0005$36.00/0 doi:10.1053/j.jrn.2008.11.010
380 Journal of Renal Nutrition, Vol 19, No 5 (September), 2009: pp 380–388
conditions in many populations. However, its use as a tool for monitoring the nutritional status of HD patients is relatively unexplored.6 We could identify only one study that compared the reliabil- ity of MNA with that of the Subjective Global As- sessment (SGA).7 Recently, we developed two modified versions of the MNA, one adopted the population-specific anthropometric cut-points for the Taiwanese population and another that further eliminated the body mass index (BMI) question and redistributed its score to other an- thropometric questions in the scale. Both versions have been shown to predict the nutritional status of elderly Taiwanese under various conditions more accurately than the original MNA.8–12 In the present study, we were interested in determin- ing whether these two modified versions would be effective in predicting the nutritional status of Taiwanese HD patients. The study also attempted to identify the potential factors that affect nutri- tional status in these patients.
Methods
In this study, we purposively sampled 95 (50 men and 45 women) ambulatory patients who had been receiving routine HD treatment at two hospital-managed HD centers in central Taiwan.
Patients were 40 years or older, had no acute disease or health condition, and had being a patient of one of the two centers for a minimum of 30 days in order to qualify as a study subject. All subjects signed a written consent after receiving a detailed explanation of the study protocol, which was approved by the Institutional Review Board of Asia University. Ethical guidelines and subjects’
confidentiality were observed during the course of the study. All patients were receiving bicarbon- ate dialysis. The study included a questionnaire interview, anthropometric measurements, and blood biochemical measurements. A structured questionnaire interview was conducted during one of the routine HD sessions to elicit subject’s basic personal data, disease history, and general health conditions and answers to questions on the Council on Nutrition Appetite Questionnaire (CNAQ)13and MNA5scales. Each subject’s hip, waist, mid-arm circumference (MAC), calf cir- cumference (CC), height, and predialysis and postdialysis body weights were also measured ac- cording to standard procedures.14 All question- naire interviews took place within 3 days of subject’s blood sampling date. One researcher con-
ducted all interviews and anthropometric mea- surements to avoid interrater errors. Serum biochemical measurements were carried out by the centers as part of their routine patient moni- toring protocol.
Nutritional status of each subject was assessed with two versions of the MNA modified specifi- cally for the elderly Taiwanese12from the original scale.5,15 Although both versions (MNA-TI [modified Taiwan version I] and MNA-TII [modified Taiwan version II]) adopted the Taiwa- nese-specific anthropometric cut-points, MNA- TII differed from MNA-TI in (a) MNA-TII had the BMI question (Question F) deleted from the scale and had 1 of the 3 BMI points reassigned to the MAC question and 2 to the CC question (thus maintaining the same 30 total points) and (b) MNA-TII adopted a 1 point/cm graded scoring scale for the MAC and CC questions.
Results were analyzed with SPSS 10.0 statistical computer software (Statistical Package for the Social Sciences, SPSS Base 10.0 Application Guide, 1999; SPSS Inc., Chicago, IL). The Wil- coxon signed-rank test was performed to deter- mine the significance of differences between the two patterns predicted by the two modified versions. Pearson’s correlation analyses were per- formed to determine the significance of correla- tion of serum albumin, CNAQ scores, or the MNA scores with each of the nutrition-related indicators. Multivariate linear regression analyses were performed to determine the significance of the association of subjects’ nutritional status with the major sociodemographic, biochemical, and health status–related parameters.
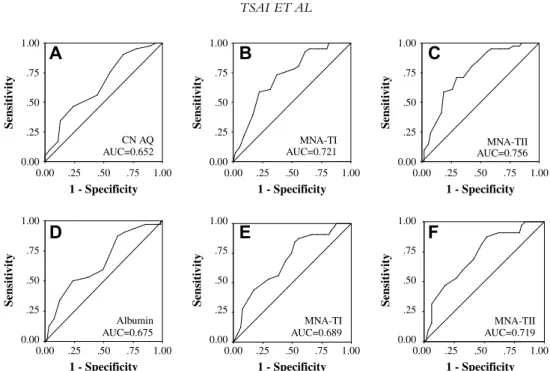
To show the probability of a nutritional assess- ment tool in discriminating a nutritional risk, receiver operating characteristic (ROC) curves were generated for CNAQ, MNA-TI, and MNA-TII, respectively, using serum creatinine concentration as the reference standard. ROC curves were also generated for albumin, MNA-TI and MNA-TII, respectively, using appetite status (CNAQ score) as the reference standard. The area under the ROC curve (AUC) indicates the proba- bility of discriminating a nutritional risk (Fig. 1).
Results
Table 1gives the characteristics of the study sub- jects. More male patients (38%) were in the younger age range (,55 years) compared with the female MODIFIED MNA TO ASSESS NUTRITIONAL STATUS ON HEMODIALYSIS 381
patients (20%). Roughly one third of male patients were current smokers and 12% were past smokers, while only one female subject smoked. Only four pa- tients (all males) drank alcohol at least once a week, and eight patients (also all males) were routine betel quid chewers. Approximately two thirds of both male and female patients claimed to exercise routinely.
Approximately 70% of patients had one or more other major chronic diseases in addition to kidney dis- ease and roughly half of all patients were receiving four or more different prescribed medications. Eigh- teen percent of patients had at least one emergency hospital visit during the past 3 months, while 8%
had hospital stay during the past 6 months. Fifty-six percent of male patients and 49% of female patients have been on HD treatment for 1 to 5 years; 32%
and 31%, 5 to 10 years; and 18% and 7%, longer than 10 years.
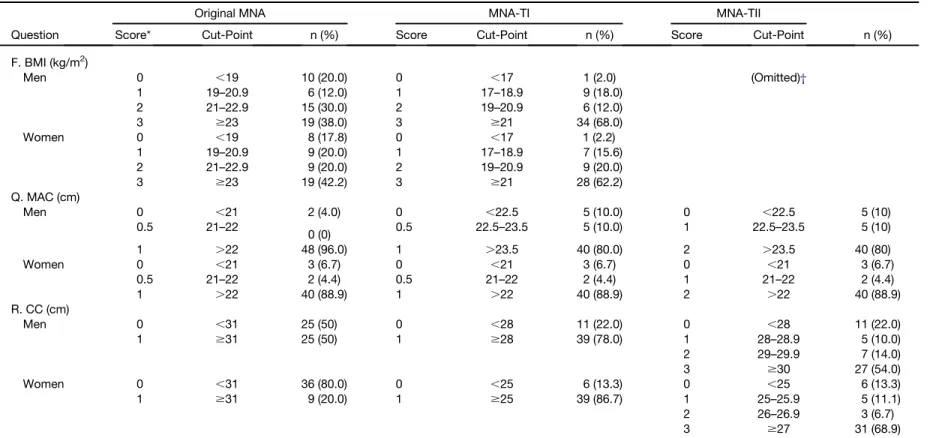
The MNA-TI rated 32% of male and 38% of female patients as having a less than desirable BMI (,BMI 21 kg/m2) (MNA-TII omitted the BMI question). Both versions of the modified MNA rated 20% of male and 11% of female patients as hav- ing a less than desirable MAC (men ,23.5 cm and women ,22 cm). MNA-TI rated 22% of male and 13.3% of female patients (men ,28 cm and women ,25 cm) and MNA-TII rated 46% of male and 31%
of female patients as having a less than desirable CC (men ,30 cm and women ,27 cm) (Table 2).
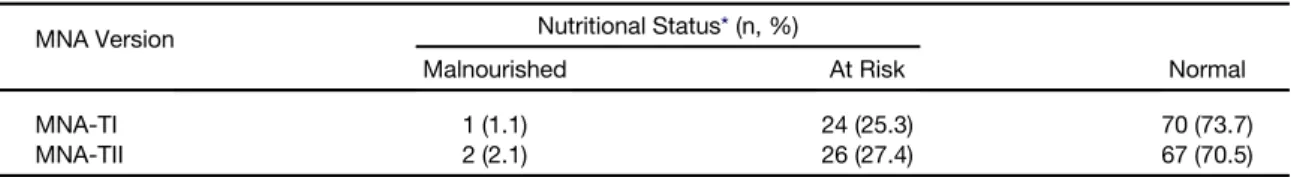
The MNA-TI rated 1 patient (1.1%) as malnourished, 24 patients (25.3%) as at risk of malnutrition, and 70 patients (73.7%) as normal, whereas the MNA-TII rated 2 patients (2.1%) as malnourished, 26 patients (27.4%) as at risk of malnutrition, and 67 patients (70.5%) as normal (Table 3). These distributions are not significantly different (P . .05, Wilcoxon signed-rank test) from each other.
The MNA scores of both versions showed a high degree of correlations with most of the nu- trition-related indicators except for hemoglobin and hematocrit. On the contrary, serum albumin showed only moderate levels of correlation with hemoglobin, hematocrit (in men only), percent weight loss, and MNA scores. CNAQ scores were highly significantly correlated with the MNA scores but only moderately correlated with serum albumin, serum creatinine, number of chronic diseases, and number of prescribed drugs. Most nutrition-related indicators including weight loss, number of prescribed drugs, days of hospitalization, and HD time were more strongly correlated with the MNA scores than with serum albumin or CNAQ scores (Table 4).
1 - Specificity 1.00 .75 .50 .25 0.00
Sensitivity
1.00 .75 .50 .25
0.00
1 - Specificity 1.00 .75 .50 .25 0.00
Sensitivity
1.00 .75 .50 .25
0.00
1 - Specificity 1.00 .75 .50 .25 0.00
Sensitivity
1.00 .75 .50 .25 0.00
1 - Specificity 1.00 .75 .50 .25 0.00
Sensitivity
1.00 .75 .50 .25
0.00
1 - Specificity 1.00 .75 .50 .25 0.00
Sensitivity
1.00 .75 .50 .25
0.00
1 - Specificity 1.00 .75 .50 .25 0.00
Sensitivity
1.00 .75 .50 .25 0.00 CN AQ
A B C
D E F
AUC=0.652
MNA-TI
AUC=0.721 MNA-TII
AUC=0.756
Albumin AUC=0.675
MNA-TI AUC=0.689
MNA-TII AUC=0.719
Figure 1. Receiver operating characteristic (ROC) curves generated for (A) the Council on Nutrition Appetite Questionnaire (CNAQ) score, (B) the modified MNA Taiwan Version I (MNA-TI) score, and (C) the modified MNA Taiwan Version II (MNA-TII) score with serum creatinine concentration of 10 mg/dL or less as the refer- ence standard and (D) serum albumin, (E) MNA-TI score, and (F) MNA-TII score with appetite status (CNAQ score #28) as the reference standard in home-dwelling maintenance hemodialysis patients.
Multivariate linear regression analysis showed that among the variables examined, only four indi- cators (CC, number of prescribed drugs, length of hospital stay during the past 6 months, and appetite status [total CNAQ scores]) were significantly asso-
ciated with subjects’ nutritional status. Other vari- ables, including age, MAC, BMI, physical activity, number of chronic diseases, years of HD, dialysis time/session, normalized protein catabolic rate, and serum albumin, creatinine, phosphorus, and calcium, were not significant (Table 5).
Under the condition that malnutrition is de- fined as serum creatinine concentration of less than 10 mg/dL,16 the ROC AUC was largest with the MNA-TII. Similarly, when malnutrition is defined as CNAQ score of less than 28, the ROC AUC was also largest with the MNA-TII (Fig. 1).
Discussion
Functionality of the Modified MNA Our earlier studies have shown that MNA-TI and MNA-TII can effectively predict the nutri- tional status of Taiwanese elderly under commu- nity living,12 long-term care institution living,9,10 and stroke rehabilitating11 conditions.
The present study has further shown that both ver- sions of the modified MNA can effectively grade the nutritional status of Taiwanese HD patients.
The two versions predicted statistically similar numbers of patients malnourished or at risk of malnutrition. Among the 95 HD patients, the MNA-TI predicted 1 patient as malnourished, 24 as at risk of malnutrition (total 26.3%), and 70 (73.7%) as normal, whereas the MNA-TII pre- dicted 2 as malnourished, 26 as at risk of malnutri- tion (total 29.5%) ,and 67 (70.5%) as normal.
Analysis of these distributions with Wilcoxon signed-rank test indicates that these two patterns are not significantly different from each other, sug- gesting that both modified versions are equally effective in predicting the nutritional status of Taiwanese HD patients.
The ability of the two modified MNA versions to effectively predict the risk of malnutrition in maintenance Taiwanese HD patients is supported by the strong correlations between the MNA scores with the major nutrition-related indicators.
The MNA scores of both versions showed good correlations with many of the key nutritional indi- cators including appetite status (CNAQ scores), serum creatinine, percent weight loss, hospital length of stay, and HD time (all P , .001); serum albumin and number of prescribed drugs (both P , .01); and number of chronic diseases (both P , .05). The fact that MNA-TII has slightly stronger correlations with most of these indicators Table 1. Characteristics of Subjects (N 5 95)
Characteristic n (%)
Age distribution (y)
40–54 28 (29.5)
55–74 52 (54.7)
$75 15 (15.8)
Smoking status
Never 71 (74.7)
Current 18 (18.9)
Past 6 (6.3)
Alcohol drinking
No 91 (95.6)
Yes* 4 (4.2)
Betel quid chewing
No 87 (91.6)
Yes† 8 (8.4)
Routine exercise
Rarely/never 31 (32.6)
Yes‡ 64 (67.4)
Number of chronic diseases§
1 29 (30.5)
2 29 (30.5)
$3 37 (39.0)
Number of prescribed drugs
0 4 (4.2)
1–3 42 (44.2)
$4 49 (51.6)
Number of emergency hospital visits during past 3 months
0 78 (82.1)
1–2 12 (12.6)
3–4 2 (2.1)
$5 3 (3.2)
Hospital length of stay during past 6 months (d)
0 87 (91.6)
$1 8 (8.4)
Dialysis time/session (h)
#3.5 13 (13.7)
4 70 (73.7)
4.5 12 (12.6)
Hemodialysis history (y)
,1 8 (8.4)
1–5 45 (47.4)
6–10 30 (31.6)
.10 12 (12.6)
*Drink alcohol at least once a week.
†Chewing $1 betel squid/d.
‡Exercise at least four times a week, .30 minutes per session.
§Including heart disease, diabetes, hypertension, dysli- pidemia, chronic respiratory diseases, chronic kidney dis- ease, stroke, dementia, and cancer.
MODIFIED MNA TO ASSESS NUTRITIONAL STATUS ON HEMODIALYSIS 383
Table 2. Subjects’ Distribution of BMI, MAC, and CC Stratified According to Cut-Points Specified in the Original and Modified MNA
Question
Original MNA MNA-TI MNA-TII
Score* Cut-Point n (%) Score Cut-Point n (%) Score Cut-Point n (%)
F. BMI (kg/m2)
Men 0 ,19 10 (20.0) 0 ,17 1 (2.0) (Omitted)†
1 19–20.9 6 (12.0) 1 17–18.9 9 (18.0)
2 21–22.9 15 (30.0) 2 19–20.9 6 (12.0)
3 $23 19 (38.0) 3 $21 34 (68.0)
Women 0 ,19 8 (17.8) 0 ,17 1 (2.2)
1 19–20.9 9 (20.0) 1 17–18.9 7 (15.6)
2 21–22.9 9 (20.0) 2 19–20.9 9 (20.0)
3 $23 19 (42.2) 3 $21 28 (62.2)
Q. MAC (cm)
Men 0 ,21 2 (4.0) 0 ,22.5 5 (10.0) 0 ,22.5 5 (10)
0.5 21–22
0 (0) 0.5 22.5–23.5 5 (10.0) 1 22.5–23.5 5 (10)
1 .22 48 (96.0) 1 .23.5 40 (80.0) 2 .23.5 40 (80)
Women 0 ,21 3 (6.7) 0 ,21 3 (6.7) 0 ,21 3 (6.7)
0.5 21–22 2 (4.4) 0.5 21–22 2 (4.4) 1 21–22 2 (4.4)
1 .22 40 (88.9) 1 .22 40 (88.9) 2 .22 40 (88.9)
R. CC (cm)
Men 0 ,31 25 (50) 0 ,28 11 (22.0) 0 ,28 11 (22.0)
1 $31 25 (50) 1 $28 39 (78.0) 1 28–28.9 5 (10.0)
2 29–29.9 7 (14.0)
3 $30 27 (54.0)
Women 0 ,31 36 (80.0) 0 ,25 6 (13.3) 0 ,25 6 (13.3)
1 $31 9 (20.0) 1 $25 39 (86.7) 1 25–25.9 5 (11.1)
2 26–26.9 3 (6.7)
3 $27 31 (68.9)
BMI, body mass index; MNA, Mininutritional Assessment; MNA-TI, modified MNA Taiwan version I; MNA-TII, modified MNA Taiwan version II; MAC, mid-arm circumference;
CC, calf-circumference; F, Q, and R are question numbers on the MNA scale.
*Points assigned in the MNA. Total score 5 30 points. For details of the original MNA, accesshttp://www.mna-elderly.com/.
†Omitted in MNA-TII. One of its 3 assigned points was reassigned to the MAC question (Q) and 2 points to the CC question (R).
TSAIETAL
suggests that MNA-TII has slightly better predict- ing power than MNA-TI.
In HD patients, serum creatinine concentration is a useful nutritional indicator.4It reflects both the status of recent dietary protein intake (meats and other protein foods) and the body’s creatinine gen- eration. A low level of serum creatinine suggests low dietary protein intake and reduced muscle protein mass.16Serum creatinine is also positively correlated with serum albumin.17A predialysis se- rum creatinine level of 10 mg/dL or higher is con- sidered normal in anuric patients.16 When malnutrition was defined according to this crite- rion, the ROC AUC was largest with the MNA-TII, followed by MNA-TI and then CNAQ, suggesting that the MNA-TII has the best predicting power among the indicators.18
Correlation of MNA Scores With Nutritional Indicators
CNAQ is a short and simple appetite assessment tool developed by the Council for Nutritional Strategies in Long-Term Care for use with institu- tionalized and community-dwelling adults.19 It has been specifically validated to identify older adults at risk of significant weight loss in the United States.13In a recent study, we observed that the CNAQ is also effective in assessing the ap- petite status of Taiwanese HD patients (unpub- lished observation). With malnutrition defined as a CNAQ score of less than 28, the ROC AUC was also largest for MNA-TII, followed by MNA-TI and then by albumin, again, suggesting that MNA-TII has the best predicting power.
Taken together, these results suggest that MNA- Table 3. Subjects’ Distribution of Nutritional Status Graded With MNA-TI and MNA-TII (N 5 95)
MNA Version Nutritional Status*(n, %)
Malnourished At Risk Normal
MNA-TI 1 (1.1) 24 (25.3) 70 (73.7)
MNA-TII 2 (2.1) 26 (27.4) 67 (70.5)
MNA, Mininutritional Assessment; MNA-TI, modified MNA Taiwan version I; MNA-TII, modified MNA Taiwan version II.
*Wilcoxon signed-rank test showed that the distributions of nutritional status between the two versions were not different from each other (Z 5 21.63, P . .05).
Table 4. Pearson’s Correlation Coefficients (r) of the Major Biochemical and Health-Related Parameters With MNA-TI and TII Scores, Serum Albumin, and Appetite Status (CNAQ Scores) in Taiwanese Hemodialysis Patients (N 5 95)
Variables† n MNA-TI MNA-TII Albumin CNAQ
Appetite status (CNAQ) 95 0.473*** 0.477*** 0.288** 1
Serum albumin 95 0.283** 0.291** 1 0.288**
Hemoglobin
Men 50 0.248 0.246 0.436** 0.023
Women 45 0.128 0.120 0.316* 0.058
Hematocrit
Men 50 0.144 0.137 0.373** 20.081
Women 45 0.123 0.151 0.263 0.109
Serum creatinine‡ 95 0.443*** 0.480*** 0.196 0.287**
Weight loss (%) 95 20.507*** 20.517*** 20.247* 20.172
No. of chronic diseases 95 20.206* 20.228* 20.025 20.227*
No. of prescribed drugs 95 0.339*** 20.311** 20.128 20.223*
Days of hospital stay 95 20.323*** 20.363*** 20.074 20.089
Hemodialysis time 95 0.325*** 0.339*** 0.147 0.141
MNA, Mininutritional Assessment; MNA-TI, modified MNA Taiwan version I; MNA-TII, modified MNA Taiwan version II;
CNAQ, Council on Nutrition Appetite Questionnaire.
*P , .05, **P , .01, ***P , .001.
†No significant corrections were observed between individual’s MNA scores, serum albumin concentrations, and appetite status with serum sodium, potassium, calcium, phosphorus, ferritin, total triglyceride, total cholesterol, blood urea nitrogen concentrations, protein catabolic rate, Kt/V (a dialysis adequacy indicator), and URR (urea reduction ratio).
‡Predialysis levels.
MODIFIED MNA TO ASSESS NUTRITIONAL STATUS ON HEMODIALYSIS 385
TII has the best ability to discriminate the nutri- tional risk status compared with MNA-TI or albumin.
The fact that subjects’ MNA scores are strongly correlated with their CNAQ scores suggests that the modified MNA is effective in predicting emerging anorexia and weight loss in HD patients.
Unexpected weight loss is a highly reliable index of nutritional risk in older adults or HD patients and is also a marker for increased morbidity and mortality.4,20,21 Thus, MNA also has the ability to predict patients with anorexia who are at risk of subsequent weight loss, making it a valuable tool in nutritional management of HD patients.
Although serum albumin is correlated with total MNA scores and with hemoglobin and hematocrit levels, it is not significantly correlated with other nutritional indicators examined in the present study. In the multivariate regression analy- sis model, it is not significantly associated with the MNA scores. Thus, in HD patients, serum albu- min does not appear to be a good predictor of nutritional status. In those patients, serum albumin concentration is influenced by both nutritional and inflammatory statuses. In fact, in well-dialyzed patients, inflammation has been suggested to be the principal cause of a decreased serum albumin level; protein intake plays a relatively insignificant role.17,22
Use of MNA for Monitoring the Nutritional Status of HD Patients
Based on the strength of the correlations of the total MNA scores with most of the major nutri- tion- and health-related parameters and on the AUC of ROC, the evidence is strong that both
versions of the modified MNA can be used to effectively grade the nutritional status of HD patients. To our knowledge, there are relatively few studies that have attempted to examine the effectiveness of MNA for assessing the nutritional status of HD patients. Afsar et al.7examined the re- liability of the MNA for evaluating protein-energy malnutrition in HD patients and found that the MNA overestimated malnourished and at-risk patients (high false-positives) compared with SGA. Among the 137 HD patients, the MNA graded (65.7%) as malnourished or at risk of mal- nutrition (9.5% and 56.2%, respectively), whereas SGA graded only 32.8% as malnourished or at risk (3.6% and 29.2%, respectively). The combined proportion of malnourished and at-risk patients appeared to be high in their study, more than twice that in the current study (26.4% and 29.5% for MNA-TI and TII, respectively). The reason for the discrepancies is not apparent.
SGA is often recommended as a tool for moni- toring the nutritional status of HD patients. Some studies have shown that it is a reliable and valid tool for nutritional assessment in adult HD patients.23,24 However, some other studies have cautioned using SGA as a stand-alone tool or con- sidering it as a gold standard in the nutritional as- sessment of patients with chronic kidney disease.25–27
Predictors of Nutritional Status
It is of interest to note that among the parame- ters examined, only CC, appetite status, number of prescribed drugs, and hospital length of stay are significantly associated with the MNA scores.
CC reflects lean body mass and physical status Table 5. Multivariate Linear Regression Analysis of the Association of Biochemical and Health-Related Indicators With the MNA-TII Scores in Hemodialysis Patients
Variable B SE b t
Constant 17.038 1.432 11.894***
CC (cm) 3.945 1.330 0.237 2.967**
No. of prescribed drugs 20.461 0.079 20.434 25.835***
Hospital length of stay 20.182 0.041 20.326 24.390***
Appetite status (CNAQ) 1.045 0.247 0.332 4.233***
MNA, Mininutritional Assessment; MNA-TII, modified MNA Taiwan version II; CC, calf circumference; CNAQ, Council on Nutrition Appetite Questionnaire.
R250.497. MNA-TII score did not include CC scores. Age, body mass index, mid-arm circumference, physical activity, number of chronic diseases, years of hemodialysis, dialysis time/session, normalized protein catabolic rate, and serum al- bumin, creatinine, phosphorus, and calcium were also included in the model but were not significantly associated with MNA- TII scores.
*P , .05, **P , .01, ***P , .001.
and is a good indicator of mobility capability, ap- petite, and nutritional status. In HD patients, lean body mass is influenced not only by dietary protein and energy intakes but also by inflamma- tory status.28On the other hand, the number of prescribed drugs and hospital length of stay during the past 6 months reflect poor health conditions that will negatively affect nutritional status. It is surprising that BMI is not significantly associated with the nutritional status of HD patients.
Study Limitations
The current study has some limitations. First, participants are conveniently sampled and therefore the results may not completely represent the status of the general HD population in Taiwan. Second, the nutritional status could have been confirmed with actual dietary record examinations, which were not carried out. Third, some serum biochemical pa- rameters such as C-reactive protein could have been determined and its impact on appetite and nutri- tional status been evaluated. Fourth, a direct com- parison with results of the SGA could have been made but was not carried out.
Conclusions
This study suggests that the simple, reliable, and low-cost MNA may be a useful tool for routine monitoring of the nutritional status of HD patients. Based on its strength of correlation with some of the key nutritional indicators, including appetite status (CNAQ scores), serum creatinine and albumin concentrations, anthropometric measurements, and health-related parameters, the modified MNA appears to be a sensitive indi- cator for predicting the nutritional status of HD patients.
Acknowledgments
The authors wish to thank the administrators and HD patients of the two HD centers.
References
1. Ikizler TA, Hakim RM: Nutrition in end-stage renal dis- ease. Kidney Int 50:343-357, 1996
2. Legg V: Complications of chronic kidney disease. A close look at renal osteodystrophy, nutritional disturbances, and inflam- mation. Am J Nurs 105:40-48, 2005
3. Kuhlmann MK, Levin NW: How common is malnutrition in ESRD? New approaches to diagnosis of malnutrition. Blood Purif 26:49-53, 2008
4. Dwyer JT, Larive B, Leung J, et al: Are nutritional status in- dicators associated with mortality in the Hemodialysis (HEMO) Study? Kidney Int 68:1766-1776, 2005
5. Guigoz Y, Vellas BJ, Garry PJ: The Mini Nutritional Assess- ment (MNA): A practical assessment tool for grading the nutri- tional state of elderly patients. In: Vellas BJ, Guigoz Y, Garry PJ, Albarede JL (eds.): Facts and research in gerontology. New York: Serdi Publishing, 1994, pp 15-60
6. Vellas B, Villars H, Abellan G, et al: Overview of the MNA—Its history and challenges. J Nutr Health Aging 10:
456-465, 2006
7. Afsar B, Sezer S, Arat Z, et al: Reliability of Mini Nutritional Assessment in hemodialysis compared with Subjective Global Assessment. J Ren Nutr 16:277-282, 2006
8. Tsai AC, Ho CS, Chang MC: Population-specific anthro- pometric cut-points improve the functionality of the Mini Nutri- tional Assessment (MNA) in elderly Taiwanese. Asia Pac J Clin Nutr 16:656-662, 2007
9. Tsai AC, Ku PY, Tsai JD: Population-specific anthropomet- ric cutoff standards improve the functionality of the Mini Nutri- tional Assessment without BMI in institutionalized elderly in Taiwan. J Nutr Health Aging 12:696–700, 2008.
10. Tsai AC, Ku PY: Population-specific Mini Nutritional As- sessment effectively predicts the nutritional state and follow-up mortality of institutionalized elderly Taiwanese regardless of cog- nitive status. Br J Nutr 100:152-158, 2008
11. Tsai AC, Shih CL: A population-specific Mini Nutritional Assessment can effectively grade the nutritional status of stroke re- habilitation patients in Taiwan. J Clin Nurs Jul 28, 2008 [Epub ahead of print]
12. Tsai AC, Chang TL, Yang TW, et al: A modified Mini Nu- tritional Assessment without BMI predicts nutritional status of community-living elderly in Taiwan. J Nutr Health Aging (in press) 13. Wilson MG, Thomas DR, Rubenstein LZ, et al: Appetite assessment: simple appetite questionnaire predicts weight loss in community-dwelling adults and nursing home residents. Am J Clin Nutr 82:1074-1081, 2005
14. Lee RD, Nieman DC: Assessment of the hospitalized pa- tient, Nutritional Assessment, 3rd ed. New York: McGraw-Hill, 2003. 216-250.
15. Ne´stle Nutrition Institute: MNA Mini Nutritional Assess- ment. MNA forms. Available athttp://www.mna-elderly.com/
mna_forms.html. Accessed August 30, 2008
16. National Kidney Foundation: K/DOQI clinical practice guideline for nutrition in chronic renal failure. Am J Kidney Dis 35(Suppl 2):S1-S104, 2000
17. Thijssen S, Wystrychowski G, Usvyat L, et al: Determi- nants of serum albumin concentration analyzed in a large cohort of patients on maintenance hemodialysis. J Ren Nutr 17:70-74, 2007
18. Yamada K, Furuya R, Takita T, et al: Simplified nutritional screening tools for patients on maintenance hemodialysis. Am J Clin Nutr 87:106-113, 2008
19. Thomas DR, Ashmen W, Morley JE, et al: Nutritional management in long-term care: development of a clinical guide- line. Council for Nutritional Strategies in Long-Term Care.
J Gerontol A Biol Sci Med Sci 55:M725-M734, 2000
20. Savina C, Donini LM, Anzivino R, et al: Administering the ‘‘AHSP Questionnaire’’ (appetite, hunger, sensory perception) in a geriatric rehabilitation care. J Nutr Health Aging 7:385-389, 2003
MODIFIED MNA TO ASSESS NUTRITIONAL STATUS ON HEMODIALYSIS 387
21. Miller DK, Carter ME, Sigmund RH, et al: Nutritional risk in inner-city-dwelling older black Americans. J Am Geriat Soc 44:959-962, 1996
22. Kaysen GA, Dubin JA, Muller H-G, et al: Inflammation and reduced albumin synthesis associated with stable decline in serum albumin in hemodialysis patients. Kidney Int 65:
1408-1415, 2004
23. Steiber A, Leon JB, Secker D, et al: Multicenter study of the validity and reliability of Subjective Global Assessment in the hemodialysis population. J Ren Nutr 17:336-342, 2007
24. Steiber AL, Kalantar-Zadeh K, Secker D, et al: Subjective Global Assessment in chronic kidney disease: a review. J Ren Nutr 14:191-200, 2004
25. Cooper BA, Bartlett LH, Aslani A, et al: Validity of Subjec- tive Global Assessment as a nutritional marker in end-stage renal disease. Am J Kidney Dis 40:126-132, 2002
26. Jones CH, Wolfenden RC, Wells LM: Is Subjective Global Assessment a reliable measure of nutritional status in hemodialysis?
J Ren Nutr 14:26-30, 2004
27. Gurreebun F, Hartley GH, Phil M, et al: Nutritional screening in patients on hemodialysis: is Subjective Global Assess- ment an appropriate tool? J Ren Nutr 17:114-117, 2007
28. Chumlea WC, Dwyer J, Bergen C, et al: Nutritional status assessed from anthropometric measures in the HEMO Study.
J Ren Nutr 13:31-38, 2003