Chapter 4 Results
In this chapter, the result of the formal study is reveled. Descriptive statistics of
participants’ scores of the comprehension tests are displayed first, followed by the test
of one-way ANOVA, the test of homogeneity of variances, and post-hoc Tamhane test.
Two sections in the questionnaire are presented in this chapter, namely, Likert-type
scales and open-ended questions. First, the scores of Likert-type scales are counted
and analyzed using several statistical methods. Second, participants’ responses to
open-ended questions are categorized and then presented with descriptive statistics
and bar charts.
4.1 Participants’ Score of Comprehension Tests
117 students participated in the current study originally. However, 6 students
reported that they had watched the series of Family Album, U. S. A., the target
material in the present study, so their scores were excluded from the data in this
section. Therefore, 111 participants’ scores were valid. Each of the participants
completed three versions of comprehension tests. Table 4.1 presents the mean scores
under the three treatments. A participant is given 10 points for each correct answer in
the comprehension test, with the highest possible score being 100 and the lowest
being 0. With the application of Latin Square Design, the Means and SDs are
calculated by putting all the same treatment scores under a certain division. For
example, Group A’s score for Video 1, Group B’s score for Video 2, and Group C’s
score for Video 3 are added up as scores for Treatment I. The same procedure is
conducted for Treatment II and Treatment III.
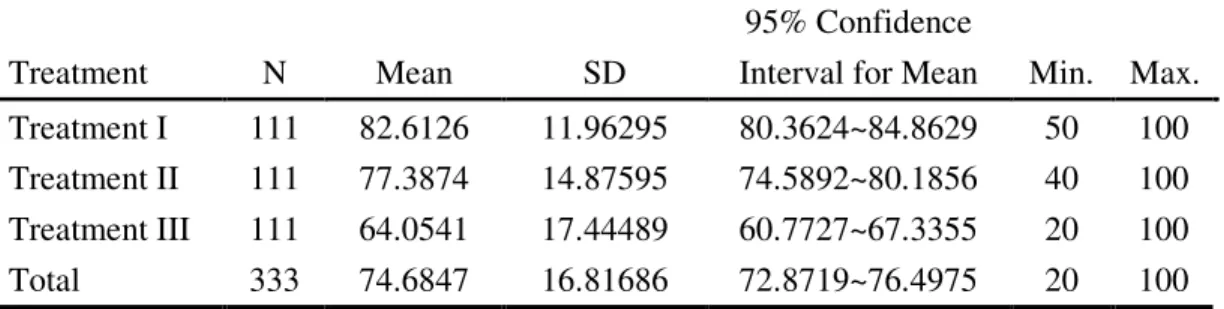
There is a difference in the mean scores of the three treatments, as presented in
Table 4.1. Treatment I leads to the highest mean score (Mean=82.6126) among the
three treatments, Treatment II the second high (Mean=77.3874), and Treatment III the
lowest (Mean=64.0541).
Table 4.1 Group Means and Standard Deviation
Treatment N Mean SD
95% Confidence
Interval for Mean Min. Max.
Treatment I 111 82.6126 11.96295 80.3624~84.8629 50 100 Treatment II 111 77.3874 14.87595 74.5892~80.1856 40 100 Treatment III 111 64.0541 17.44489 60.7727~67.3355 20 100
Total 333 74.6847 16.81686 72.8719~76.4975 20 100
Note: Treatment I: Visual Contextual Cues Treatment II: Vocabulary Pre-teaching
Treatment III: No Treatment before Video Viewing
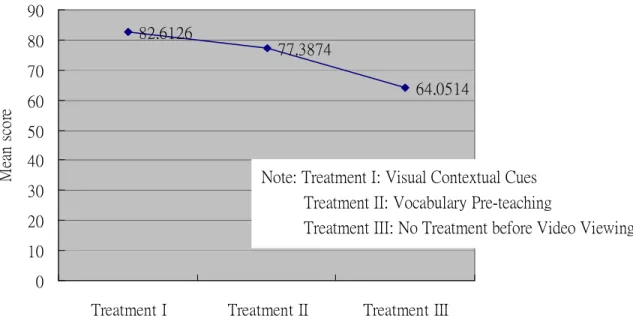
Figure 4.1 illustrates the mean score of the three treatments with a diagram. It
can be clearly seen from the figure that the mean score of Treatment I is the highest,
followed by the mean scores of Treatment II and Treatment III.
82.6126
77.3874
64.0514
0 10 20 30 40 50 60 70 80 90
Treatment I Treatment II Treatment III
Mean score
Figure 4.1 Mean Plot of the Three Treatments
Because there is a difference in the mean scores of the three treatments presented
in Table 4.1 and Figure 4.1, a further statistical technique is needed to examine
whether the difference is significant. Therefore, a one-way ANOVA test is conducted
to do the examination. Table 4.2 shows the result from running through an ANOVA
using SPSS. The difference in the three treatments is found significant (p<0.05), as
shown in Table 4.2.
Table 4.2 Analysis of Variance by Treatments
SS DF MS F p
Between Groups 20331.532 2 10165.766 45.605 .000*
Within Groups 73560.360 330 222.910
Total 93891.892 332
*p<.05
Note: Treatment I: Visual Contextual Cues Treatment II: Vocabulary Pre-teaching
Treatment III: No Treatment before Video Viewing
In addition to descriptive statistics and the test of one-way ANOVA, a test of
homogeneity of variances is conducted to check if there was homogeneity in different
groups of participants. Table 4.3 presents the result by using SPSS software package.
It can be seen from the statistics that there is not significant homogeneity in the three
groups. In other words, there is a significant variance in the three groups of
participants (p<0.05).
Table 4.3 Test of Homogeneity of Variances
Levene Statistic df1 df2 p
10.644 2 330 .000*
*p<.05
The data in Table 4.3 suggest that a significant variance exists across different
groups. When a significant variance exists, a comparison of procedures for multiple
comparisons of means with unequal variances needs to be carried out to see exactly
where the difference lies. Consequently, post-hoc Tamhane Test, performed when
equal variances cannot be assumed, is applied to statistically examine where the
difference lies. Table 4.4 displays the result of the post-hoc test.
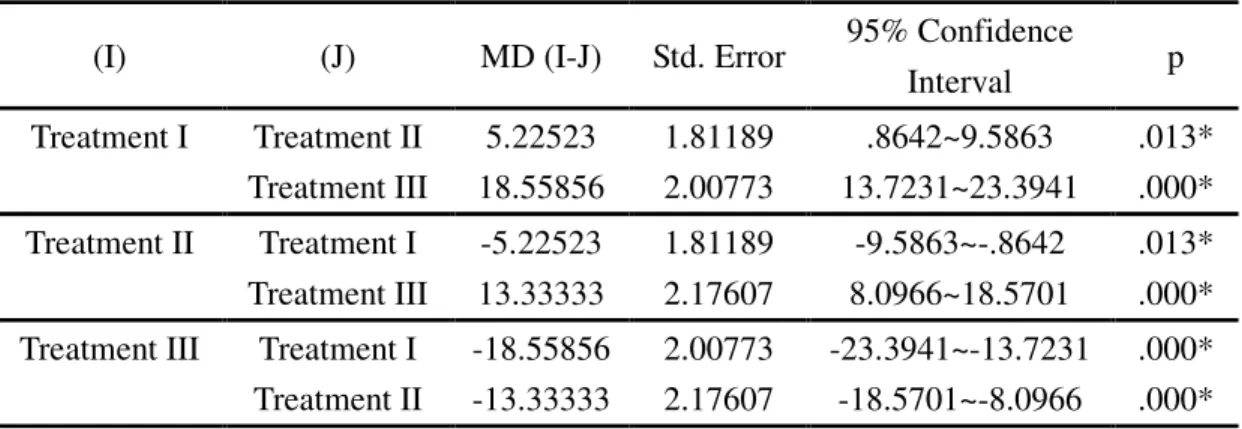
As shown in Table 4.4, significant differences exist between Treatment I and
Treatment II (p<0.05), Treatment I and Treatment III (p<0.05), and Treatment II and
Treatment III (p<0.05). After the data are analyzed in one-way ANOVA and post-hoc
Tamhane Test, there is enough evidence to say that students who receive Treatment I
produce significantly higher scores than those who receive Treatment II or Treatment
III. Students under Treatment II produce significantly higher scores than those under
Treatment III, but perform less satisfactorily than those under Treatment I. That is to
say, advance organizer in the form of visual contextual cues has a better effect on the
comprehension of foreign videos than vocabulary pre-teaching. It is also certified that
participants in the advance organizer conditions can demonstrate better
comprehension than those in the condition where no advance organizers are provided.
Table 4.4 Post Hoc Tamhane Test
(I) (J) MD (I-J) Std. Error 95% Confidence
Interval p
Treatment I Treatment II 5.22523 1.81189 .8642~9.5863 .013*
Treatment III 18.55856 2.00773 13.7231~23.3941 .000*
Treatment II Treatment I -5.22523 1.81189 -9.5863~-.8642 .013*
Treatment III 13.33333 2.17607 8.0966~18.5701 .000*
Treatment III Treatment I -18.55856 2.00773 -23.3941~-13.7231 .000*
Treatment II -13.33333 2.17607 -18.5701~-8.0966 .000*
*p<.05
Note: Treatment I: Visual Contextual Cues Treatment II: Vocabulary Pre-teaching
Treatment III: No Treatment before Video Viewing
4.2 Result of Participant Questionnaire
The result of participants’ performance on comprehension tests has been
presented in the former section. This section aims to reveal and analyze the data in the
questionnaire. There are three parts in the questionnaires, including questions that
elicit participants’ background information, Likert-type scales, and open-ended
questions. In this section, findings in the Likert-type scales and open-ended questions
are reported and analyzed using statistical techniques.
4.2.1 Likert-type Scales
The number of returned questionnaires was initially 117, but 6 participants
claimed that they had viewed the target video before, so their questionnaires were
excluded from the data for analysis. Therefore, the valid returned questionnaires used
for analysis are 111 in total, with 106 males and 5 females.
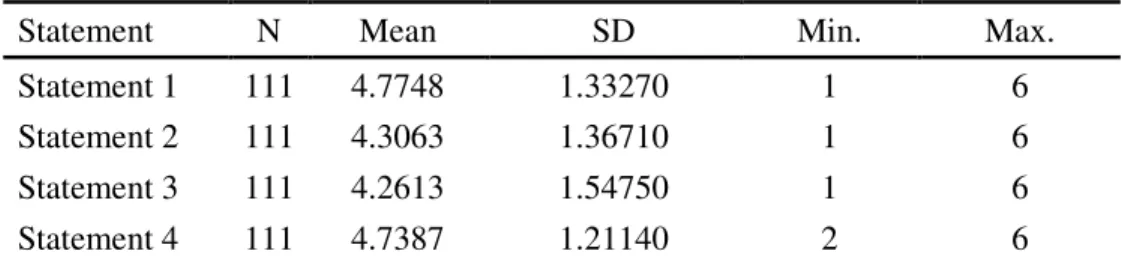
Table 4.5 presents the result of Likert-type scales. Participants have to place
themselves on the six-point scale according to their degree of agreement to each
statement, with the highest possible score being 6 and the lowest being 1. The mean
scores show that the participants generally agree with the four statements listed on the
Likert-type scales.
Table 4.5 Frequency Statistics for Participants’ Attitude
Statement N Mean SD Min. Max.
Statement 1 111 4.7748 1.33270 1 6
Statement 2 111 4.3063 1.36710 1 6
Statement 3 111 4.2613 1.54750 1 6
Statement 4 111 4.7387 1.21140 2 6
Note: Statement 1: Viewing videos is helpful to my English learning.
Statement 2: I need help before viewing foreign videos.
Statement 3: The advance organizer that provides visual contextual cues with brief narration can facilitate my comprehension of the video.
Statement 4: The advance organizer that provides vocabulary pre-teaching can facilitate my comprehension of the video.
In Statement 1, respondents show preference for learning English through video
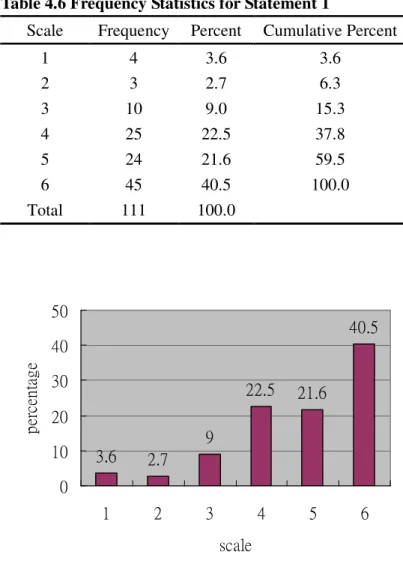
viewing (Mean=4.7748). As shown in Table 4.6 and Figure 4.2, most respondents
place themselves from 4 to 6 on the scale, which are close to the positive end of the
scale, meaning that the respondents agree with the statement. Figure 4.2 presents the
distribution of the responses.
Several respondents give their opinions about this statement in the comment area
under the statement. Some of them say that viewing foreign videos is quite interesting,
and consider it a good way to train their listening ability. Besides, several respondents
regard viewing foreign videos as a challenging task but they still like it. Interestingly,
some respondents say that they prefer learning a language by viewing videos to
learning it by listening to regular broadcasts.
Table 4.6 Frequency Statistics for Statement 1
Scale Frequency Percent Cumulative Percent
1 4 3.6 3.6
2 3 2.7 6.3
3 10 9.0 15.3
4 25 22.5 37.8
5 24 21.6 59.5
6 45 40.5 100.0
Total 111 100.0
3.6 2.7 9
22.5 21.6
40.5
0 10 20 30 40 50
1 2 3 4 5 6
scale
percentage
Figure 4.2 Participant Attitude toward Statement 1 (%)
Statement 2 is designed to elicit respondents’ attitude toward teachers’ assistance
before video viewing. Respondents generally show a positive attitude toward
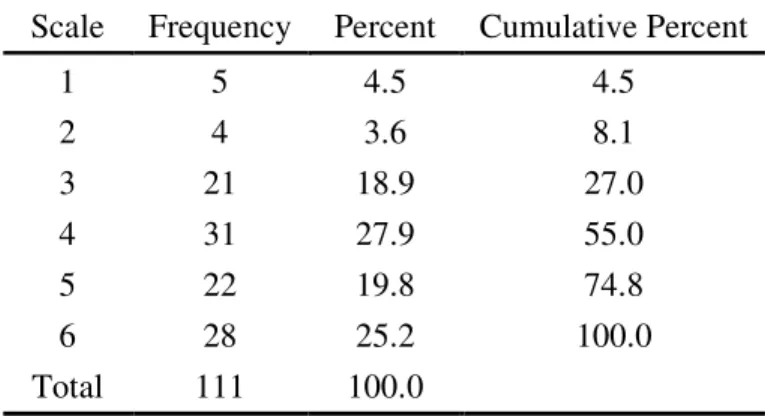
teachers’ help (Mean=4.3063). Table 4.7 exhibits the frequency and percentage, and
Figure 4.3 shows the distribution. 73.2% of the respondents rate themselves from 4 to
6 on the scale, which are close to the positive end, showing that this group of
respondents agrees with the statement. What is emphatic in the figure is that 30
respondents, taking up 27 % of the whole, rate themselves from 1 to 3 on the scale,
which are closer to the negative end. It means more than a quarter of the participants
do not think they need teachers’ help prior to video viewing.
Several respondents make remarks in the comment area. Most of them consider
teachers’ assistance very helpful and therefore necessary. Interestingly, some
respondents confess that they need teachers’ help because they are extremely nervous
before viewing the foreign video, and teachers’ help can successfully lower their
anxiety. On the other hand, some comment that they can understand the video without
teachers’ assistance prior to video viewing so they consider it unnecessary. Some
even remark that teachers’ help reveals the content of the video, so they have little to
expect while viewing the video, which lowers their motivation for viewing the video.
Table 4.7 Frequency Statistics for Statement 2 Scale Frequency Percent Cumulative Percent
1 5 4.5 4.5
2 4 3.6 8.1
3 21 18.9 27.0
4 31 27.9 55.0
5 22 19.8 74.8
6 28 25.2 100.0
Total 111 100.0
4.5 3.6
18.9
27.9
19.8
25.2
0 5 10 15 20 25 30
1 2 3 4 5 6
scale
percentage
Figure 4.3 Participant Attitude toward Statement 2 (%)
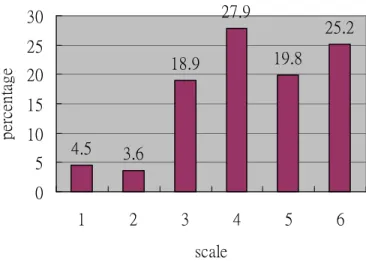
Statement 3 is to gauge participants’ degree of fondness for visual contextual
cues. Generally speaking, participants hold a positive attitude toward the advance
organizer (Mean=4.2613). Table 4.8 and Figure 4.4 present the detailed information.
71.2% of the respondents rate themselves from 4 to 6, which were close to the
positive end. However, 28.8% of the respondents rate themselves from 1 to 3 on the
scale, which are close to the negative end. That is to say, although most of the
respondents view visual contextual cues as an effective advance organizer, up to
28.8% of the respondents more or less disagree with this statement.
Some of the respondents comment that visual contextual cues are helpful
because this advance organizer helps them predict the content of the video, and it
keeps them from being overwhelmed by the dense information rapidly shown in the
video. On the contrary, several respondents mention that visual contextual cues are
not a constructive advance organizer. They advocate that visual cues have little to do
with linguistic knowledge such as vocabulary and syntax, and therefore cannot
possibly help them comprehend a foreign video that aims to teach a language. Besides
the above comments, some respondents say that they are not in favor of this advance
organizer because it reveals a lot of the content of the video in advance, which makes
them less curious about the video.
Table 4.8 Frequency Statistics for Statement 3
Scale Frequency Percent Cumulative Percent
1 7 6.3 6.3
2 11 9.9 16.2
3 14 12.6 28.8
4 25 22.5 51.4
5 22 19.8 71.2
6 32 28.8 100.0
Total 111 100.0
6.3
9.9 12.6
22.5 19.8
28.8
0 5 10 15 20 25 30 35
1 2 3 4 5 6
scale
percentage
Figure 4.4 Participant Attitude toward Statement 3 (%)
Statement 4 is designed to probe participants’ degree of fondness for vocabulary
pre-teaching as the advance organizer. Participants hold a positive attitude toward the
advance organizer (Mean=4.7387), as shown in Table 4.9 and Figure 4.5. Most
respondents rate themselves 6 on the scale (34.2%), and 80.1% of the respondents rate
themselves from 4 to 6, which are close to the positive end. Interestingly, not a single
respondent rates himself or herself 1 on the scale. It shows that a large number of
respondents choose the positive side of the scale, which means most participants in
the current study think of vocabulary pre-teaching as an effective advance organizer
in facilitating their comprehension of the foreign video.
As for the comments made by the respondents, an overwhelming majority
declares that vocabulary plays an essential role in their comprehension of the video.
Some respondents even make the remark that they can not possibly understand the
video without vocabulary knowledge. Despite the overwhelming support for
vocabulary pre-teaching, a small number of respondents express that this advance
organizer fails to help them comprehend the video. The characters in the film speak so
fast that it is hard to distinguish word from word, so vocabulary knowledge fails to
function as an effective advance organizer.
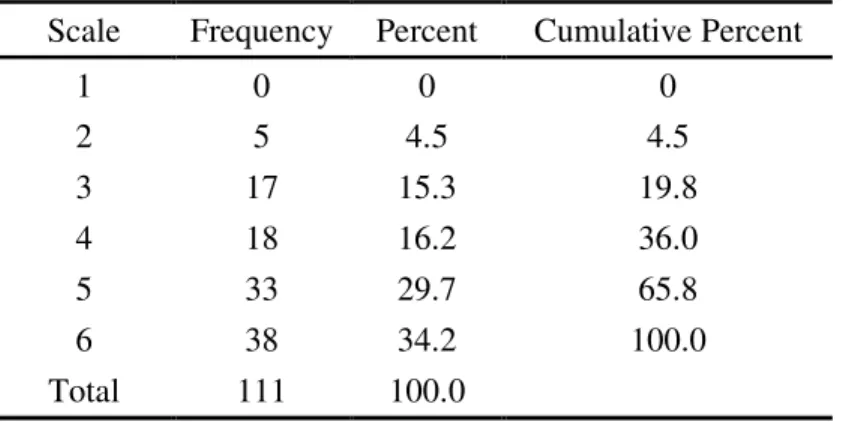
Table 4.9 Frequency Statistics for Statement 4
Scale Frequency Percent Cumulative Percent
1 0 0 0
2 5 4.5 4.5
3 17 15.3 19.8
4 18 16.2 36.0
5 33 29.7 65.8
6 38 34.2 100.0
Total 111 100.0
0
4.5
15.3 16.2
29.7
34.2
0 5 10 15 20 25 30 35 40
1 2 3 4 5 6
scale
percentage
Figure 4.5 Participant Attitude toward Statement 4 (%)
Statement 3 and Statement 4 are devised to investigate participants’ degree of
fondness for the two advance organizers. Although participants generally respond
positively to both of the statements, there are still differences in the responses to the
two statements that need to be scrutinized. As a result, a comparison of participants’
degree of fondness for the two advance organizers is conducted. From the data
presented in Table 4.10, there is a small gap between the mean scores of Statement 3
(Mean=4.2613) and Statement 4 (Mean=4.7387). The mean score of Statement 4 is
slightly higher than that of Statement 3. According to the mean score, participants
show more fondness for vocabulary pre-teaching than for visual contextual cues as the
advance organizer.
Table 4.10 Paired Samples Statistics
N Mean SD SE Mean
Statement 3 111 4.2613 1.54750 0.14688 Statement 4 111 4.7387 1.21140 0.11498
Note: Statement 3: The advance organizer that provides visual contextual cues with brief narration can facilitate my comprehension of the video.
Statement 4: The advance organizer that provides vocabulary pre-teaching can facilitate my comprehension of the video.
In order to examine whether the difference in the mean scores of the two
statements is significant, a Paired Samples T-test is carried out. The Paired Samples
T-test of the mean differences is significant at the 0.05 level in this study. The result is
displayed in Table 4.11. From the statistical analysis, it can be confirmed that there is
significant difference in the mean scores of Statement 3 and Statement 4 (p<0.05).
Therefore, there is enough evidence to declare that the mean score of Statement 4 is
statistically higher than that of Statement 3. That is to say, participants show more
preference for vocabulary pre-teaching to visual contextual cues as the advance
organizer.
Table 4.11 Paired Samples T-Test
Pair Mean SD SE Mean
95% Confidence Interval of the
Difference
t df p
Statement 3-
Statement 4 -4.7748 1.95795 0.18584 -0.84577~
-0.10918 -2.569 110 .012*
*p<.05
Note: Statement 3: The advance organizer that provides visual contextual cues with brief narration can facilitate my comprehension of the video.
Statement 4: The advance organizer that provides vocabulary pre-teaching can facilitate my comprehension of the video.
4.2.2 Open-ended Questions
The result of open-ended questions is revealed in this section. The valid returned
questionnaires are 111 in total. Some respondents give more than one answer to
certain questions, so the number of responses to each open-ended question is more
than 111. Each response is categorized into groups of similar responses, which are
placed in a frequency order and are exhibited in tables and bar charts in this section.
Question 1 invites respondents’ to give opinions about their ideal advance
organizers. Table 4.12 and Figure 4.6 present the collected data. Vocabulary
pre-teaching is considered the most helpful advance organizer (29.5%) by the
respondents, followed by the introduction of characters in the film (20.2%),
explanation of plot (19.1%), and visual aids such as pictures and photos related to the
target video (12.7%). Several respondents support the application of question preview
cultural background. Surprisingly, the idea of applying no advance organizers is
mentioned 7 times, taking up 4.0% of the whole. Finally, only 1 respondent mentions
that syntactic knowledge is crucial.
Table 4.12 Frequency Statistics for Question 1
29.5
20.2 19.1
12.7 9.2
4.6 4.0 0.6 0.05.0
10.015.0 20.025.0 30.035.0
vocabulary
character plot visual aids
question preview cultural background
none syntax
Advance organizers considered helpful
Percent
Figure 4.6 Participant Response to Question 1 (%)
There are two parts in Question 2. The first part has the respondents reflect on Advance organizers
considered helpful Frequency Percent Cumulative percent
vocabulary 51 29.5 29.5
character 35 20.2 49.7
plot 33 19.1 68.8
visual aids 22 12.7 81.5
question preview 16 9.2 90.7
cultural background 8 4.6 95.3
none 7 4.0 99.3
syntax 1 0.6 100
their performance in comprehension tests, asking the respondents if they were able to
answer the questions in the comprehension tests. The result is presented in Table 4.13.
38 respondents, taking up 34.2% of the whole, believe they did quite a good job in
answering the questions; 73 respondents, taking up 65.8% of the whole, think they did
not do well.
Table 4.13 Frequency Statistics for Question 2.1 Answer Frequency Percent
yes 38 34.2
no 73 65.8
The second part of Question 2 is designed to make the respondents think about
the reasons that lead to their failure in comprehension tests. Participants who gave a
negative answer in the first part of Question 2 are required to answer the second part
in this question.
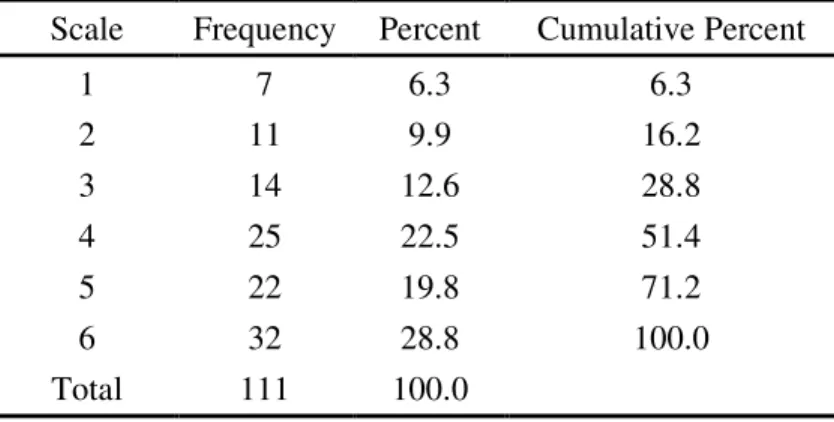
The responses are categorized into four groups, which are exhibited in Table 4.14
and Figure 4.7. Among the responses, the rapid speech rate in the video is the factor
that most participants think hinders their comprehension (32.3%). Many respondents
say in the comment area that the characters in the video speak too fast so that a lot of
words are linked together. They say they cannot distinguish word from word, which
impedes their comprehension of long utterances. In addition to the problem of speech
rate, the lack of vocabulary knowledge is also regarded as the root that blocks the
comprehension. A number of respondents constantly stress that it is the absence of
vocabulary knowledge that leads to the breakdown in their comprehension. This
seems to be a deeply-rooted concept because a lot of respondents keep preaching
about the significance of vocabulary in the comment area, which is an interesting
phenomenon.
Some responses are categorized into the group of attention, taking up 23.1% of
the whole. According to these respondents, their problem of attention is due to a lack
of concentration, distractions inside and outside the classroom, the tendency of their
trying to understand everything in the listening text, and a lack of interest in the
content of the video. Other responses have to do with characters (15.4%). Some
respondents say there are many characters in the video, which makes it challenging to
memorize the names of the characters and the relationship between them.
Table 4.14 Frequency Statistics for Question 2.2
Problems Frequency Percent Cumulative percent
speech rate 21 32.3 32.3
vocabulary 19 29.2 61.5
attention 15 23.1 84.6
character 10 15.4 100
32.3 29.2
23.1
15.4
0 5 10 15 20 25 30 35
speech rate
vocabulary
attention
character Problems
Percent
Figure 4.7 Participant Response to Question 2 (%)
Question 3 is to extract respondents’ opinions and suggestions for using foreign
videos as the target material in future language classrooms. Participants in this study
generally hold a positive attitude toward this issue, supporting the use of foreign
videos as the learning material. The result is shown in Table 4.15 and Figure 4.8.
As for the suggestions for future classroom video viewing, 30.3% of the
responses concern with the issue of caption, either in first language or in second
language. These respondents say they feel more confident and comfortable with
written language. On the other hand, a lot of suggestions (30.3%) have to do with the
content of the video. Many respondents mention that they are more interested in
popular movies. Interestingly, vocabulary teaching is proposed in some responses
again (18%). These respondents consider vocabulary teaching an essential element
that can not and should not be left out in a language class. In addition, a number of
respondents say they expect to watch the videos in which characters speak with slow
speech rate and clear articulation. They say they had few experiences of learning
English through authentic videos, so they would like to start with easy ones. These
responses together took up 17.2 % of the whole. Finally, 5 respondents voice their
suggestion of reading the script of the video. They think the script can help them
decode what the characters say in the video more precisely.
Table 4.15 Frequency Statistics for Question 3
Suggestions Frequency Percent Cumulative percent
caption 37 30.3 30.3
popular movies 37 30.3 60.6
vocabulary teaching 22 18 78.6
slow speed 14 11.5 90.1
clear articulation 7 5.7 95.8
provision of the script 5 4.1 100
30.3 30.3
18
11.5
5.7 4.1
05 1015 20 25 3035
caption
popular movies
vocabulary teaching
slow speed
clear articulation
provision of the script Suggestions
Pe rc en t
Figure 4.8 Participant Response to Question 3 (%)