行政院國家科學委員會專題研究計畫 成果報告
建立以微陣列及知識為基礎的人類疾病及基因之線上資料 庫
計畫類別: 個別型計畫
計畫編號: NSC93-2320-B-038-043-
執行期間: 93 年 08 月 01 日至 94 年 07 月 31 日 執行單位: 臺北醫學大學醫學資訊研究所
計畫主持人: 李元綺
共同主持人: 徐建業,邱泓文
報告類型: 精簡報告
處理方式: 本計畫可公開查詢
中 華 民 國 94 年 10 月 24 日
建立以微陣列及知識為基礎的人類疾病及基因之線上資料庫
結案報告
Background
Cancer has currently become one of the deadly diseases and ranked second leading cause of death in Taiwan. Hepatocellular carcinoma (HCC) is the first death leading cause in Taiwan. Cancer occurrence is not taken place randomly. The cancer risks include inherited mutations, immune conditions, and external environment. These causal factors may act together or in sequence to initiate or promote carcinogenesis.
Along with the development of high throughput biotechnology and the complete of human genome program, human beings are getting to know more about the “molecular-self”. We eventually are able to see the differences between cancerous and normal tissues in a comprehensively global view.
Over 2,000 papers on cancer gene expression transcriptomes have been published to date. Scientists gradually realized the importance to collect all these precious and important data in some indicated databanks. However, due to the great size of each dataset, and the demanding usage for the gene expression tools, it is not an easy or a convenient way for a traditional wet laboratory to have the raw data retrieved and not to mention to have an advanced analysis in details.
Therefore, there is a critical need for a disease-driven analysis on the relationship of genes- to-HCC, where pre-analyzed and annotated gene lists, calculated from a comprehensive collection of gene expression data on the build of each cancer type, are to be presented. During the course of the work, we found the data format produced from a diverse range of approaches is rather confusing and is hard to cross-compare. To facilitate our work to carry forward, we have built a database-interrogation platform as a conversion window for all the high throughput data, especially gene expression data from microarray, SAGE and 2D. This platform is named under what it meant, Database Interrogation Platform for Gene Expression (abbreviated as DIPLEX). The first version of this tool has been released and the manuscript is under preparation. With the unification for gene identifier, the raw data will be processed and to analyze individually. Differentially expressed genes in HCC and normal liver resulted from microarray, SAGE and 2D are also compared and shown in the project.
Results
Part 1. Establishment a platform where the gene index of the diverse high-though put data can be interrogated from one to another.
The first problem we encountered is the heterogeneity of the gene ID used in diverse range of experimental methods such as EST, SAGE and microarray. For example, the microarray data from Stanford Microarray Database used “I.M.A.G.E. Clone ID” as the gene index, data produced in Affymetrix used their own internal gene ID as the gene index, data yielded from SAGE experiments used short sequence tag as the gene index. To compare with each result obtained from different build, we have to find at least one common gene ID so that the gene lists of each other are able to collate.
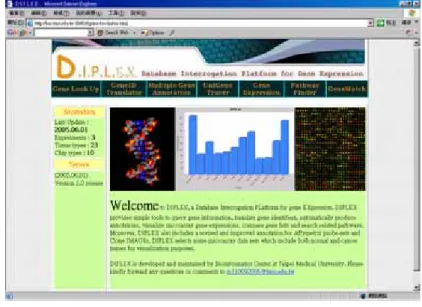
To facilitate our work to carry on, we have built a tool “DIPLEX” (Database Interrogation Platform for gene Expression) system. As its nominal vocabulary suggests, DIPLEX is chosen as it has the meaning of paired or matching signals transmission, which partly agree with what we meant for this database as to match each gene ID in one database to another. (DIPLEX, http://bio.tmu.edu.tw/diplex/; Figure 1).
There are seven basic functions provided by this tool.
1. Single gene identifier lookup 2. Gene identifier translator 3. Multiple gene annotation 4. UniGene Tracer
5. Gene Expression 6. Pathway Finder 7. Gene list Match
Figure 1. The entry window of DIPLEX tool, as shown in the page, and the functions are indicated.
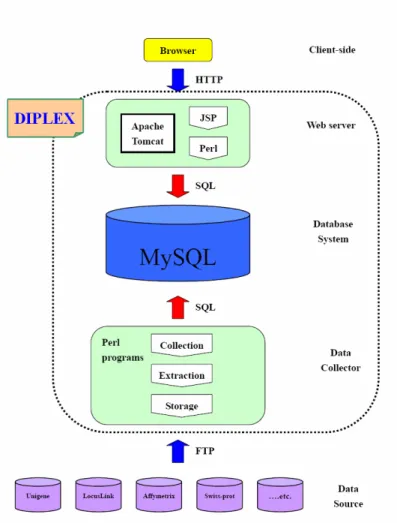
DIPLEX is the most updated, using officially recognized gene names and symbols, mostly it has many entries, ranged from affymetrix array chips, IMAGE clone ID, SAGE tag, GenBank, UniProt, UniGene, Entrez Gene, OMIM, Gene Ontology, and to KEGG/Biocarta pathway (Figure 2).
Figure 2. The schema for databases used and integrated in the DIPLEX for the comprehensive and convenient gene ID conversion.
Table 1. Systems evaluation among all the available tools designed to tackle the diverse high throughput data.
<DIPLEX System Evaluation>
Data Entry format Available retrieval results
Statistics
Single search
Multi search
IMAGE clone ID
Affy Agilent SAGE HGNC symbol
GO KEGG &
Biocarta
No. of LocusLink record returns when
searching with 54,646 Human
Unigene
No. of Symbol record returns when
searching with 54,646 Human
Unigene
DIPLEX V V V V V V V V V 24,216 (100%)1 21,793 (100%)
SOURCE V V V X X X X V X 22,812 (94%) ND2 MatchMiner V V V V X X V X X 17,434 (72%) 9,375 (43%)
GeneLynx V V X X X X X X X 13,337 (55%) ND3
EnsMart V V4 X V X X V V X ND5 ND5
GeneCards6 V X X X X V V V X No multi search7 No multi search
NB:
1. The UniGene version used is the most updated 177 build.
2. There is no official HGNC symbol is used in SOURCE, but the symbol used is the UniGene symbol.
3. There is no official HGNC symbol retrieval function in GeneLynx.
4. No IMAGE clone ID and UniGene ID query is allowed in EnsMart.
5. No UniGene ID query can be used to perform this evaluation.
6. Actually, GeneCards is not suitable for automatically multiple-gene search.
The UniGene version used is rather old, which is 171 build.
Part 2. Establish a “Genes-to-Hepatocellular carcinoma” relationship database.
We aim to collect as many gene expression profiles worldwide as possible, as this is the most efficient way to eliminate noisy signals where normally result from technological system bias and partial sampling and then to retrieve useful information for the users. For example, we not only analyzed HCC samples from Taiwan, we have included data from Hong Kong, U. S. (Chen et al., 2003), China (Xu et al., 2001; Li et al., 2001), Japan (Okabe et al., 2000; Nagai et al., 1997; Iizuka et al., 2004; Hokaiwado et al., 2004), Korea (Zimonjic et al., 1999; Choi et al., 2004) and Singapore (Neo et al., 2004).
Further, the data that we analyzed come from a diverse range of gene expression approaches including traditional CGH/SKY, loss of heterozygosity (LOH), 2D page, SAGE and the newly developed cDNA and oligo microarray. This helps to examine the phenomenon of hepatocellular carcinoma with different approaches. If the relationship of HCC and the genes has been indicated in multiple approaches, it reinforces the importance of these genes to HCC. If not, it could be in intrinsic system problems or not sensitive enough, such as the proteins lower than 15kD would be hard to be detected in 2D approach, or simply the noises or false positive.
We demonstrated here with three of HCC related high throughput data each from cDNA microarray (Chen et al., 2002), SAGE (from CGAP SAGE library) and 2D (Sanchez et al., 1995) to identify the differentially expressed genes.
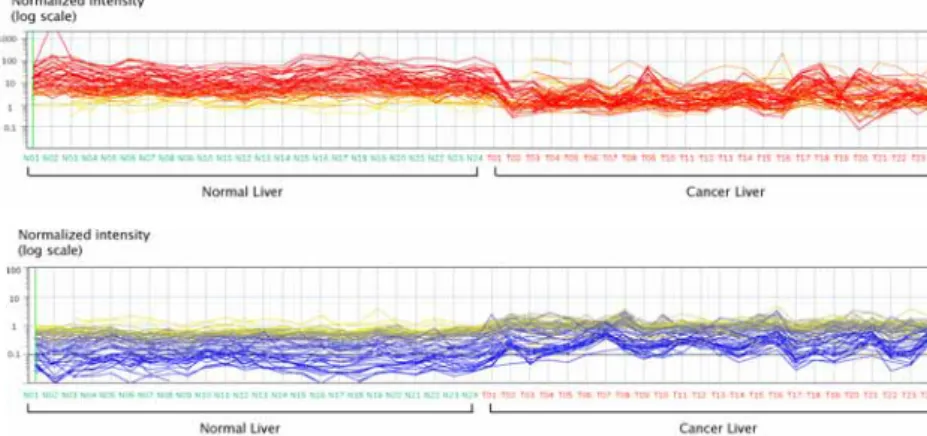
In cDNA microarray, there are 73 genes shown statistical significance between normal and cancer livers (p<0.00001). Of 38 are up-regulated genes in HCC and the rest of 35 are down-regulated genes (Figures 3 and 4).
Figure 3. Gene expression matrix of the differentially expressed genes (p<0.00001) among 24 pairwise liver cancer patients. Each row represented a gene and each column a tissue sample. The red color indicates the up-regulated genes, blue, down-regulated genes and yellow, genes show no difference between samples.
Figure 4. Gene expression profiles of the differentially expressed genes (p<0.00001) among 24 pairwise liver cancer patients.
As for SAGE data, there are 271 genes show 2-fold greater expression in normal tissues than that of in tumor tissues. However, only 20 genes show 2-fold greater expression in tumor tissues than that of in normal tissues.
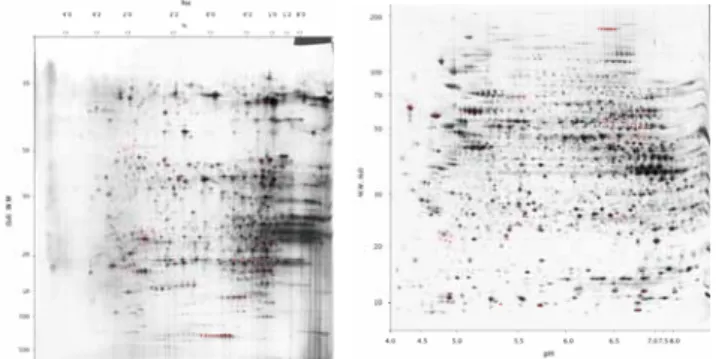
The genes expressed in 2D data are even more scarce, but with much more important significance, as the data derived from 2D is of experimental validation (Figure 5).
Figure 5. 2D PAGE of normal liver (left panel) and HepG2 (right panel).
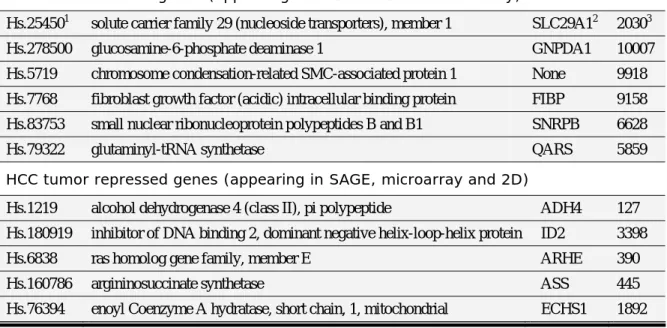
With these three gene lists generated from different approaches, we found 6 genes of tumor-induced genes appearing both in SAGE data and microarray data (Figure 6 and Table 4). On the other hand, 5 genes of tumor-repressed genes are also present in all these three different experiments (Figure 6 and Table 4). In another word, these 11 genes are reproducible in different experiments and shown their true identification associated with HCC.
Among these genes, ADH4 (mapped to 4q22) and ECHS1 (10q26.2) have been shown to be important proteins in liver. It is noted, that the number of genes in the gene list are to be dynamic, depending on the stringency of expression levels. Users will be allowed to choose any kinds of combination with different levels of stringency for the selected gene lists. The overlapping genes will also be changed accordingly.
Figure 6. The Venn diagrams show the overlapping genes of tumor-induction (left panel) and tumor-repression (right panel) among three different gene expression approaches, microarray, 2D and SAGE.
Table 2. Genes induced and repressed in hepatocellular carcinoma.
HCC tumor induced genes (appearing in both SAGE and microarray)
Hs.254501 solute carrier family 29 (nucleoside transporters), member 1 SLC29A12 20303
Hs.278500 glucosamine-6-phosphate deaminase 1 GNPDA1 10007
Hs.5719 chromosome condensation-related SMC-associated protein 1 None 9918 Hs.7768 fibroblast growth factor (acidic) intracellular binding protein FIBP 9158 Hs.83753 small nuclear ribonucleoprotein polypeptides B and B1 SNRPB 6628
Hs.79322 glutaminyl-tRNA synthetase QARS 5859
HCC tumor repressed genes (appearing in SAGE, microarray and 2D)
Hs.1219 alcohol dehydrogenase 4 (class II), pi polypeptide ADH4 127 Hs.180919 inhibitor of DNA binding 2, dominant negative helix-loop-helix protein ID2 3398
Hs.6838 ras homolog gene family, member E ARHE 390
Hs.160786 argininosuccinate synthetase ASS 445
Hs.76394 enoyl Coenzyme A hydratase, short chain, 1, mitochondrial ECHS1 1892
NB.
1. UniGene cluster ID.
2. Official HGNC symbol.
3. LocusLink ID.
Due to the small sample size, although these genes have shown their close relationship with HCC, it cannot rule out that there are other genes ranked higher in terms of the expression correlation to HCC. Two important genes, ADH4 and ECHS1, have been indirectly implied the disorder of their functions would cause the damage of liver tissues (Hu et al., 2004; Kurokawa et al., 2003; Li and Edenberg, 1998). It strengths the possibility to find more important biomarkers by in silico filtering broadly to refine and discriminate the real essence gene targets.
Part 3. To analyze and decipher their genomic mechanisms.
The overlapping genes are the potential biomarkers either for early detection or for clinical diagnosis. Their co-occurrence or –disappearance upon the progression of HCC imply their closely linked interaction in the biological pathways. By using the gene lists obtained
from 3 different high throughput methods, microarray, SAGE and 2D, as mentioned in details above, we continue to use them to find some pragmatic models.
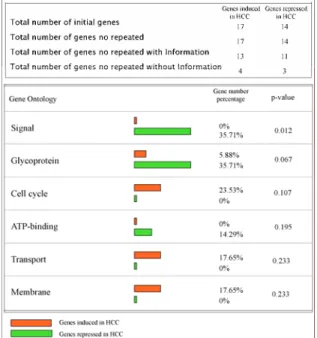
As every gene can be assigned with at least one gene ontology term, we will use this contrary list of genes (one is induced and the other is repressed genes in HCC) derived from microarray experiments to find the differential pathways. There is a public available tool that can help do such comparison between two genes, FatiGO (http://fatigo.bioinfo.cnio.es/; (Al- Shahrour et al., 2004) and FatiWISE (http://fatiwise.bioinfo.cnio.es/).
In figure 7, 17 HCC-induced genes apparently are involved more in the cell cycle, transport and membrane associated pathways. On the other hand, HCC-repressed genes commit themselves more in the signaling transduction, glycoprotein and ATP-binding functions.
This associated pathways have previously well documented to have close relationship with HCC, such as signal transduction (Chen et al., 2003; Scandurro et al., 2001; Tanaka et al., 2002; Xu et al., 2004; Zhou et al., 2003),ATP-binding (Moustafa et al., 2004), and Glycoprotein (Chang et al., 2003; Isshiki et al., 1993).
Figure 7. Gene-ontology assignments delineating the different functions of induced (orange closed box) and repressed genes (green closed box). The web interface program, FatiGO (http://fatigo.bioinfo.cnio.es/), was used to distinguish function by gene-ontology assignment.
Conclusions
This is a comprehensive study and it promises a wider view from every different angle and approach to re-interpret and re-understand the whole event of hepatocellular carcinoma.
As the valuable genome-wide data have been made globally and are public accessible for most of them. However, due to it huge size of raw data and metadata, and the difficulties to handle the analytic tools, most of the “human knowledge wealth” are buried underneath the databanks. It will be a great loss if we do not have someone in time who is familiar with the techniques to extract the information and to convert to layman language via user-friendly online database. As we can also imagine soon the commercial companies will take a step ahead to collect them all and sell with cash. The finding from the diverse range of data integration on cancer also holds the promise for the drug targeting development. The DIPLEX tool is completed and its manuscript under preparation. The genes-to-HCC database is also on the way to be complete.
Reference
Al-Shahrour, F., Diaz-Uriarte, R. and Dopazo, J. (2004). FatiGO: a web tool for finding significant associations of Gene Ontology terms with groups of genes. Bioinformatics 20, 578-80.
Chang, C. S., Huang, W. T., Yang, S. S., Yeh, H. Z., Kao, C. H. and Chen, G. H. (2003).
Effect of P-glycoprotein and multidrug resistance associated protein gene expression on Tc- 99m MIBI imaging in hepatocellular carcinoma. Nucl Med Biol 30, 111-7.
Chen, T., Tian, F. Z., Cai, Z. H., Yin, Z. L. and Zhao, T. J. (2003). [The signal transduction pathway related to hepatocellular carcinoma apoptosis induced by survivin antisense oligonucleotide]. Zhonghua Yi Xue Za Zhi 83, 425-9.
Chen, X., Cheung, S. T., So, S., Fan, S. T., Barry, C., Higgins, J., Lai, K. M., Ji, J., Dudoit, S., Ng, I. O. et al. (2002). Gene expression patterns in human liver cancers. Mol Biol Cell 13, 1929-39.
Hu, Y., Pang, E., Lai, P. B., Squire, J. A., MacGregor, P. F., Beheshti, B., Albert, M., Leung, T. W. and Wong, N. (2004). Genetic alterations in doxorubicin-resistant hepatocellular carcinoma cells: a combined study of spectral karyotyping, positional expression profiling and candidate genes. Int J Oncol 25, 1357-64.
Isshiki, K., Nakao, A., Ito, M., Hamaguchi, M. and Takagi, H. (1993). P-glycoprotein expression in hepatocellular carcinoma. J Surg Oncol 52, 21-5.
Kurokawa, Y., Matoba, R., Takemasa, I., Nakamori, S., Tsujie, M., Nagano, H., Dono, K., Umeshita, K., Sakon, M., Ueno, N. et al. (2003). Molecular features of non-B, non-C hepatocellular carcinoma: a PCR-array gene expression profiling study. J Hepatol 39, 1004- 12.
Lander, E. S. Linton, L. M. Birren, B. Nusbaum, C. Zody, M. C. Baldwin, J. Devon, K.
Dewar, K. Doyle, M. FitzHugh, W. et al. (2001). Initial sequencing and analysis of the human genome. Nature 409, 860-921.
Li, M. and Edenberg, H. J. (1998). Function of cis-acting elements in human alcohol dehydrogenase 4 (ADH4) promoter and role of C/EBP proteins in gene expression. DNA Cell
Biol 17, 387-97.
Moustafa, M. A., Ogino, D., Nishimura, M., Ueda, N., Naito, S., Furukawa, M., Uchida, T., Ikai, I., Sawada, H. and Fukumoto, M. (2004). Comparative analysis of ATP-binding cassette (ABC) transporter gene expression levels in peripheral blood leukocytes and in liver with hepatocellular carcinoma. Cancer Sci 95, 530-6.
Sanchez, J. C., Appel, R. D., Golaz, O., Pasquali, C., Ravier, F., Bairoch, A. and Hochstrasser, D. F. (1995). Inside SWISS-2DPAGE database. Electrophoresis 16, 1131-51.
Scandurro, A. B., Weldon, C. W., Figueroa, Y. G., Alam, J. and Beckman, B. S. (2001). Gene microarray analysis reveals a novel hypoxia signal transduction pathway in human hepatocellular carcinoma cells. Int J Oncol 19, 129-35.
Tanaka, S., Sugimachi, K., Maehara, S., Harimoto, N., Shirabe, K. and Wands, J. R. (2002).
Oncogenic signal transduction and therapeutic strategy for hepatocellular carcinoma. Surgery 131, S142-7.
Xu, X. B., Leng, X. S., Yang, X. and He, Z. P. (2004). [Obstruction of TGF-beta1 signal transduction can decrease the process of hepatocellular carcinoma in mice induced by CCl4/ethanol]. Zhonghua Yi Xue Za Zhi 84, 1122-5.
Zhou, J. M., Zhu, X. F., Pan, Q. C., Liao, D. F., Li, Z. M. and Liu, Z. C. (2003). Manumycin inhibits cell proliferation and the Ras signal transduction pathway in human hepatocellular carcinoma cells. Int J Mol Med 11, 767-71.