國立臺灣大學管理院資訊管理研究所 碩士論文
Graduate Institute of Information Management College of Management
National Taiwan University Master Thesis
How do you trust and share?
Discussing how information sharing cultivate trust in sharing economy programs
林彥礦 Yan-Kuang Lin
指導教授:吳玲玲 博士 Advisor: Ling-Ling Wu, Ph.D.
中華民國 108 年 08 月
August, 2019
摘要
“共享”行為的範圍和型態因為新科技的演進而有所不同。在新的情境下,信 任被認為提升使用意願的一個非常重要的元素。這篇研究借用了 Mayer 對信任的 看法,認為信任的存在是因為信任者感受到被信任者的善意、誠信、及能力,進而 提出資訊品質能夠節由提升乘客對於 UBER 平台已及司機的善意、誠信、及能力而 提升對他們的信任,進而提升使用意圖。在研究模型中,Burt 的名譽機制及 institutional-base 的概念也被包含。收集問卷完成實驗後,儘管資料效度需要 被討論,研究仍發現了有使用過 UBER 的族群跟沒使用過 UBER 的族群不同的行為 反應。對有使用過 UBER 的人來說,資訊品質能夠提高對平台的信任,接著提高對 司機的進任,進而提升使用意願。對於沒有使用過 UBER 的人來說,資訊品質能夠 提高對平台的信用,接著分別提高使用意圖及對司機的信任。總體而言,研究結果 論證了資訊品質能夠提高信任進而提高使用意圖,本研究也因此認為這證明了相 比於傳統計程車,UBER 不能被去中間化的特性。
關鍵字:共享經濟、信任、名譽機制、資訊品質、使用意圖
Abstract
The “sharing” activity is different from the past on the scope and members’
familiarity due to the development of new technologies. At this moment, trust is regarded
as an important factor to increase participating intention. This research leveraged Mayer’s
research that trust can be cultivated by increasing trustors’ perception of benevolence,
integrity, and competence of trustees, and considers that information quality can increase
passengers’ trust of the UBER platform and drivers through increasing the perception of
those 3 factors, further increase their participating intention. The concept of reputation
mechanism and institutional-based trust are also included in this research model. After
the survey is conducted by collecting questionnaires, though there was few validity issue
existed, it is found that people who had used or never used UBER before have different
behaviors. For people who had used UBER before, information quality can increase the
trust on UBER, and then increase the trust on drivers, further increase the participating
intention. In contrast, for people who had never used UBER before, information quality
would increase the trust on UBER, and the trust on UBER respectively increase the trust
on drivers and participating intention. Overall, information quality are proofed to
increase trust further increase the intention, and this research consider that this mechanism
makes UBER disintermediated comparing with traditional taxis.
Key word:Sharing economy, Trust, Reputation mechanism, Information quality, Intention
Table of Contents
Chapter 1. Introduction ... 7
Chapter 2. Literature Review ... 10
Chapter 3. Methodology ... 24
3.1. Research Method ... 24
3.1.1. Research Target ... 24
3.1.2. Variables ... 25
3.1.3. Intention of Participation ... 25
3.1.4. Information Quality ... 26
3.1.5. Trust on the Sharing Company and the Sharing Peers ... 26
3.2. Research Procedure... 27
3.3. Participants ... 28
Chapter 4. Empirical Results ... 30
4.1. Procedure of Data Analyzing... 30
4.2. Reliability and Validity ... 31
4.2.1. Sample with participants which had used UBER before ... 33
4.2.2. Sample with participants which had never used UBER before ... 41
4.3. SEM Analysis ... 46
Chapter 5. Conclusion, Theoretical Contribution, and Managerial Implications50 Chapter 6. Limitations and Future Research... 55
REFERENCE ... 57
Appendix A: Informed Consent ... 58
Appendix B: Survey items ... 59
Appendix C: Demographic Information ... 62
Figure Indexes
Figure 1 ... 24
Table Indexes
Table 1. Demographic Information and Sharing Economy Usage Comparing against That of MIC’s Report ... 28 Table 2. ks-test result of comparison between student and non-student groups ... 32 Table 3. ks-test result of comparison between groups that participants had used UBER before and had never used UBER before ... 32 Table 4. EFA and Cumulative Percentage of Variance Explained before taking average on sample which participants had used UBER before ... 34 Table 5. EFA and Cumulative Percentage of Variance Explained after taking
average on sample which participants had used UBER before ... 36 Table 6. Reliability and Validity: Standardized Factor Loadings for the Construct Indexes, Cronbach’s α, Average Variance Extracted, and Construct Reliability of sample which participants had used UBER before ... 38 Table 7. Discriminant Validity: The Square Root of AVEs of sample which
participants had used UBER before ... 38 Table 8. Vif Table of sample which participants had used UBER before ... 40 Table 9. EFA and Cumulative Percentage of Variance Explained before taking average of sample which participants had never used UBER before ... 41 Table 10. EFA and Cumulative Percentage of Variance Explained after taking average of sample which participants had never used UBER before ... 43 Table 11. Reliability and Validity: Standardized Factor Loadings for the Construct Indexes, Cronbach’s α, AVE, and CR for the Construct of sample which participants had never used UBER before ... 44 Table 12. Discriminant Validity: The Square Root of AVEs of sample which
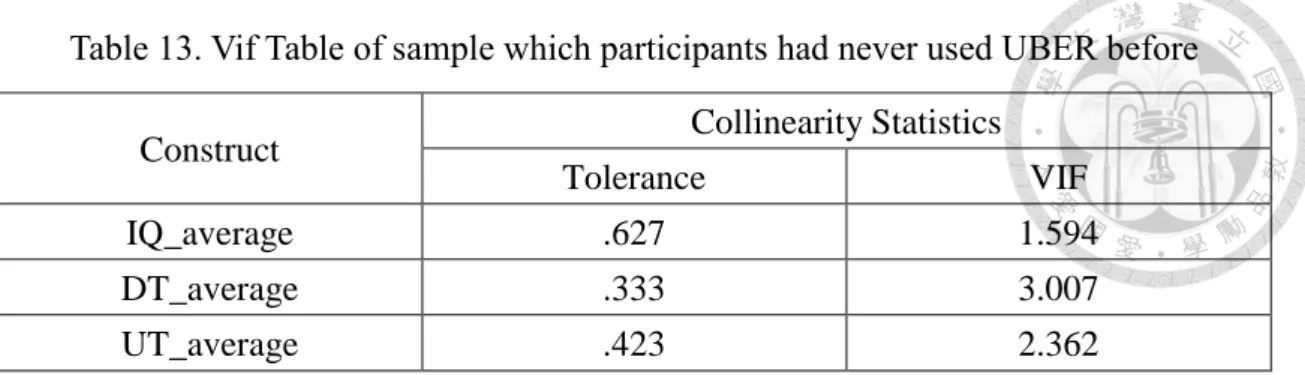
participants had never used UBER before ... 44 Table 13. Vif Table of sample which participants had never used UBER before ... 46Table 14. Goodness of Fit Statistics Results of SEM Analysis ... 46 Table 15. Results of SEM Analysis ... 47
Chapter 1. Introduction
Sharing economy, which is defined as “The peer-to-peer-based activity of obtaining,
giving, or sharing the access to goods and services, coordinated through community-
based online services” (Hamari, Sjöklint, & Ukkonen, 2016), has become popular in
recent years. Uber, the largest global C2C transportation platform, is in the process of
replacing traditional taxi services, and got 680 billion dollars evaluation at 2017. Also,
Airbnb, a C2C room sharing service, has caused the hotel industry facing serious
challenges. With innovative business models, sharing economy programs have attracted
mass amount of users to participate in the “sharing” activities.
In sharing economy programs, the “sharing” activities are different from the past. At
past, researchers focused the “sharing” activities on a relatively smaller scale. Belk
proposed the prototypes of sharing (contrasting with the prototypes of marketplace
exchanging and the prototypes of gift giving), which considered mothering and the
pooling and allocation of household resources as classical sharing activities.(Belk, 2010).
At this moment, sharing is regarded as a specific activity between small groups of people.
However, the Internet and especially Web 2.0 has flourished many new ways of sharing
activities on a larger scale (Belk, 2014). There are open source software sharing
repositories such as GitHub, online collaborative encyclopedias such as Wikipedia,
content sharing platforms like Facebook and YouTube, or even car sharing like Zipcar.
These platforms are rapidly emerging because technological developments of the Internet
have simplified the process of sharing, whether the sharing object is physical or non-
physical. Since these sharing economy programs have different forms of “sharing”
comparing with the past, some issues behind this phenomenon should be discovered.
Sharing economy programs often operate as platforms. These platforms facilitate
participants to share resources with each other. For example, Uber built the platform of
car sharing. It recruits car owners to register as drivers, and these drivers provide car
service during their free time. Also, people who need to be picked up can seek for service
through Uber platform, and find appropriate drivers near themselves. What Uber does is
to use algorithms to match the drivers and the passengers. The “sharing” activities happen
because of the contribution of the platform. It directly helps people with demands to meet
up with people who are willing to share, which make the scope of what to share and of
who can share broader than before.
This research regards trust is a key determinant of participating in sharing economy
program. As mentioned before, the sharing activity is no longer be limited within families
or with small group. Rather, people start to share with someone not familiar to them on
the Internet. Take Uber as example. The car sharing activity happens with the help of the
matching algorithm, and passengers and drivers typically do not know each other before
the encounter. For the sharing activity to occur, it is essential to establish trust between
passengers and drivers. Uber needs to persuade passengers to believe that the drivers will
safely pick them up, drive them to wherever they want to go, and offer good service to
them. Simultaneously, Uber also has to make drivers believe that passengers will behave
well as good customers on the car. This research posits that the sharing activities will
happen only when both sides of the sharing activities consider the other side is trustworthy.
Otherwise they may refuse to participate the sharing activity. Therefore, this research
regards trust as a strong basis in sharing economy programs that can promote people
become willing to share.
Sharing economy programs had developed diverse strategies to enhance trust. These
programs often provide online reviews and offer additional information such as personal
photos to cultivate trust. For example, on Airbnb, a host should present his photo next to
the photos of the living space. This policy can verify hosts’ identity, and also deliver the
sense of a personal encounter (Ert, Fleischer, & Magen, 2016). In addition, Airbnb also
publicize housekeepers’ rating scores to travelers, and these scores are generated by
travelers’ voting result according to their staying experiences. Travelers can take the score
into consideration when they choose the place to stay, because the score indeed reflect
customers’ historical experience toward the staying house. When the score of a place get
higher, travelers will know that this place is more believable. Therefore, this research tries
to investigate whether these mechanisms (photos, personal information, rating scores, etc.)
indeed increase people’s trust when they participate in sharing economy programs.
To sum up, this present research will firstly investigate the information UBER
provides regarding its service, and describe why these information can work effectively
to increase trust. Further, trust will be regarded as a mediator between these mechanisms
and people’s intention of participating in sharing economy programs. This study will try
to use reputation mechanisms of individuals to explain the whole process, and the details
will be described at Chapter 2.
Chapter 2. Literature Review
This paper considers that information will increase trust. Mayer proposed a model to
figure out factors that have positive influence on trust (Mayer, Davis, & Schoorman,
1995). There are two roles in his model: trustors and trustees. Mayer proposed that a
trustee’s ability, benevolence, integrity will both increase trust, because they will increase
the trustor’s perceived trustworthiness toward the trustee. However, figuring out whether
a trustee has high ability, benevolence, and integrity is a great challenge. Also, while trust
means taking risk (Mayer et al., 1995), when the trustor is unable to judge these factors
of the trustee, the trustor may not be willing to trust due to high potential risk. Therefore,
information plays an important role to increase trust. While the trustor has enough
information to the trustee, the trustor can easily know that whether the trustee has enough
ability, has high benevolence to the trustor, and has high integrity. The information of
these factors can reduce perceived risk to the trustor, thereby increase the trustor’s
willingness to trust. While IT mechanisms grow rapidly, this present research
hypothesizes that the information which provided by UBER’s IT mechanisms can
definitely increase people’s trust on both sharing peer and the platform.
There are two sections below. First, the information which provided by UBER’s IT
mechanisms will be identified, and second, how these information work to increase
passengers’ trust will be discussed.
UBER implements various IT mechanisms to provide information and facilitate
passengers’ trip on picking up services. Before starting a trip on UBER, UBER calculates
and displays the price of the trip in advance, and plans the best route to the destination
for the passenger. When the passenger accepts the price and makes an appointment on
Uber, UBER automatically assigns a driver to the passenger, further provides the driver’s
information and the trip’s information to the passengers. When the passenger finishes his
trip, UBER enables the passenger to write a review and rate for the trip. How these
mechanisms work before the trip, on the trip, and after the trip will be discussed below.
Before the trip, the route to the destination and the price will be displayed. Different
from the mechanisms of traditional taxis, which drivers drive their own route to the
destination and inform passengers of the charge after the trip, Uber lets passengers to
know such information in advance. In addition, the charge and the route is calculated by
the algorithms from Uber, rather than drivers, and usually is the best option to the
passengers. This mechanism provides passengers the possibility to know much more
information and make the decision before the picking up service.
When the passenger accepts the price and makes an appointment on Uber, UBER
assigns a driver for the trip, and provides more information about the driver and the trip.
Uber assigns the driver automatically, including the consideration of the driver’s rating,
the distance between the driver and the passenger, and the willingness of the driver to
pick up the passenger. After the driver is determined, Uber provides the information of
the driver. UBER provides the driver’s personal information, the driver’s reputation
information, and the driving car’s information to the passenger. The driver’s personal
information includes the driver’s real name, photos, his speaking language, and his
history records of driving UBER car. The driver’s reputation information contain the
driver’s average rating, and every passengers’ reviews to him. The driving car’s
information includes the car’s license plate number, the type, and which company the car
is rented from. In addition, while it needs time for the driver to arrive to the place where
the passenger stands, UBER will show the instant location of the driver, and this lets the
passenger knows the distance between the driver and himself. After the passenger gets in
the car, UBER will use GPS to keep monitoring their location, and keep the driver from
driving deviated from the route scheduled by UBER. This makes sure the driver pick off
the passenger at the right destination and at right time. These information provide
passengers to have clearer expectations of the trip during the process of using UBER
service.
And after finishing the trip, the reviews and ratings have considerable impact on
UBER platform. As mentioned above, after passengers rate and comment drivers, these
information will be updated to the drivers’ profile, and other passengers will regard it as
a reference of the drivers’ performance. Also, the rating score will be checked by UBER
regularly. If a driver’s rating score is too low (ex: less than 3 stars), his UBER account
will be prohibited by UBER for a period of time. Hence, this makes that only if a driver’s
rating score is high enough will be shown on UBER’s map for passenger’s appointment.
While the information which UBER discloses are listed systematically, the next
section is to illustrate how they can increase passengers’ trust on the company(Uber), and
the sharing peer(the driver) as well. First, this paper will discuss how these information
can increase passengers’ trust on Uber, and later it will also discuss how these information
can increase passengers’ trust on the driver.
This paper posits that these information can increase passengers’ trust on Uber
through increasing passengers’ perception on Uber’s ability, integrity, and benevolence,
which are three factors that can increase the trustee’s trustworthiness.
First, these information show that Uber has enough ability to handle this trip. While
lots of information of the driver and the trip are provided by Uber to the passenger, UBER
persuades passengers that Uber would have the ability to know all the details of the trip,
further delivers the message that UBER can control and participate the whole process of
the trip. For example, the trip is continuously been monitored by GPS, and the route is
always been recorded. While the passenger’s instant location is always shown on the APP
when s/he is on the UBER car during the trip, the passenger would be persuaded that
UBER tries to make sure the car would always follow the assigned route to the destination.
Besides, the passenger would know that once the driver does something harmful to the
passenger, the driver cannot escape because UBER can immediately provide the location
information to the police. In addition, UBER persuades the passenger that they can
maintain the service quality by prohibiting drivers whose rating score are less than three
stars from providing services. These mechanisms show that UBER has huge controlling
power. Even though passengers get on strangers’ car, UBER still provide users enough
information to evaluate the capability of the drivers.
Second, the transparency of information delivers the message to the passenger that
UBER has high integrity. While Uber provide information to the passengers as more as
they can, it means that UBER is responsible for the trip. At past, when passengers take
taxis and face bad services, they can hardly do reactions because there is no one to
complain to after getting off the car. However, while UBER provide information of the
driver and the trip to passengers, passengers are more able to complain about the trip.
UBER would become the target to complain and ask for compensation, and passengers
are able to point out the driver and the car which provided bad services. Further,
passengers can literally react through rating and reviewing for the bad experience they
faced. Therefore, passengers would feel that UBER would be responsible for the trip due
to the information disclosure, and increase their perception of integrity on UBER.
Third, this paper considers that the disclosure of information in advance, especially
the sensitive information including the price, can persuade passengers to regard Uber as
a company that really think of them. Different with the taxis’ policy that they always show
the price after the trip, and passengers have no rights to refuse to pay the price, Uber gives
the passengers the rights to decide whether to accept the price for the service or not in
advance. While passengers can know more critical information before being charged, they
will more believe that Uber does consider of their perspective and provide a fair sharing
process.
Thus, this study adopts the concept of information quality (Bock, Lee, Kuan, & Kim,
2012), and proposes that the increasing of information quality will leads to the increasing
of people’s trust of the sharing economy platform. According to Bock’s theory, while
information is regarded as high quality, it is because the information is sufficient, accurate,
timely, and helpful. In this case, people can have higher perception of drivers’
benevolence, integrity, and competence only when the information UBER provide is
sufficient, accurate, timely, and helpful to them. With high quality information, peoples
will be more able to judge whether the trustee is trustworthiness. Therefore, the
hypothesis is raised below,
H1: Information quality has a positive influence on people’s trust of the sharing economy company.
Also, this paper posits that these information can increase the passenger’s trust on
the driver. While information is important to the trustor (the passenger) to judge whether
the trustee (the driver) is trustworthy, especially when the trustor and the trustee are
strangers before, the trustor tends to seek information of the trustee for his judgement. It
is not easy for the trustor to seek the trustee’s information in the past. However, with the
development of technologies, the mechanisms of UBER nowadays can provide such
information to the trustor’s needs, which is unable for the trustor to collect before. The
difference of information collecting between the past and the present will be described
below.
At past, there are little ways for the trustor to fetch the trustee’s information and
increase trust on the trustee, especially when the trustor and the trustee are strangers. The
trustor can only rely on a third-party to fetch information. Under this situation, Burt
proposed a model to interpret how information travel in a social network, further trigger
reputation mechanisms and increase members’ trust (Burt, 2007). In his theory, people
would care about their own reputation. This cause people suffering reputation cost if they
do something inappropriately because the information of one’s bad reputation would
travel through the indirectly mutual contacts in a network. Hence, based on this rationale,
people tend to behave well to maintain their reputation well, and cause trust become less
risky in the network (Burt, 2007). However, this mechanism would only happens under
specific conditions.
In Burt’s theory, the reputation mechanism would happen only when the social
network is close enough to create reputation stability, and is hard to escape. Burt used the
phenomenon of the investment bank industry and an Indian small village called Jati for
explanation respectively. First he used the phenomenon of the investment bank industry
to conclude that the closure is an essential element of creating reputation stability. There
are mainly two roles working in investment banks, bankers and analysts. In each year,
there are peer reviews between people who had cooperated with each other in the past
year. Through the accumulated data of their peer evaluations, Burt found that only when
the colleagues were strongly connected in the network, the evaluations became stable
(Burt, 2007). He considered that this is because when the network is close, good works
of a person would be remembered by colleagues in the network, and the one’s reputation
would continue over time. However, when the evaluating colleagues were not connected,
good works and bad works would easily be forgotten, further led the evaluations became
unstable. People would not care so much about reputation while it reset each year because
nobody remembered their behavior. Thus, creating a close network would definitely
protect stability. Second, the transformation of the Indian village Jati demonstrated that a
network should be hard to escape to protect reputation mechanism works. Before, the rule
in Jati is that members are not allowed to marry outside the village, and people can only
find their jobs by other members’ referral. At that time, reputation was strongly credible
because the direct or indirect link tie closely through the rules of marriage and finding
jobs. This improved information flow to make sure the members of the network follow
their social obligations (Burt, 2007). However, when time past, when the members started
to establish connections outside the village, the community network became eroded.
People got married outside the Jati, and parents were encouraged to move their children
to English-language school to make their children be able to compete desired jobs. This
made people not so rely on the network in Jati before, because they have ways to escape
outside the obligation of Jati. At this moment, the reputation mechanism became hard to
continue in Jati. Hence, creating a close and hard-to-escape network is essential to make
sure reputation stability. But it should also be noticed, fulfilling these requirements are
cost-consuming in the past, just like the investment banks establish the peer evaluating
mechanism for years, and Jati used hundreds of years to implement the rule of marriage.
Nowadays UBER uses IT mechanisms which can facilitate information sharing to
save the cost of building trust between peers. As mentioned before, UBER builds the
mechanism which drivers and passengers can rate and write reviews for each other after
the service is completed. Actually, it exactly creates a more efficient way to cultivate trust.
It remarkably increase the trustor’s perception of the trustee’s ability, integrity, and
benevolence, further increase the trustworthiness of the trustee.
First, this research proposes that the information which provided by UBER’s IT
mechanisms can strongly raise the driver’s willingness of being benevolent to the
passenger, further increase the passenger’s perception of the driver’s benevolence.
This research considers that the reason why the driver would tend to be benevolent
is because the driver cares about his reputation on UBER’s review and rating system,
which means the reputation mechanism works on the system. In Burt’s theory, he
proposed that the members in the network should be close because of the consideration
of information flow. However, the passenger can directly find out the driver’s past
behavior through the reviews and ratings on the system, instead of figuring out indirectly
through their mutual contacts, and this keeps reputation mechanism stable. Secondly, all
the data of drivers’ reviews and ratings are accumulated on the system, which makes
UBER drivers impossible to escape from the evaluation. When an individual just drives
a taxi, actually he doesn’t really need to care about his reputation. This is because the
previous passenger would almost has no connection with the next passenger, which
allows the driver to escape from having reputation cost even he does impropriate
behaviors. In contrast, each trip would be evaluated on UBER and be explored by others,
so when a driver provides a service which is not good enough, he has to bear the result of
receiving bad evaluation, and this would instantly reflect on his personal score that
appears on the system. And certainly, passengers will never take a driver’s car who has
low score which directly cause the driver has less income in the future. Hence, the
reputation is worthy because reputation cost is literally existed and unescapable, and this
is why reputation mechanism works on the system.
While drivers would care about their evaluation because of the reputation mechanism,
passengers would tend to perceive the benevolence of drivers. In the context that all the
drivers are evaluated by passengers, drivers tend to behave well and provide good services
in order to gain higher scores. Accordingly, passengers would know that their evaluation
to drivers are effective. Thus, when passengers know that drivers would do their best to
get higher evaluations from them, it means that passengers would perceive high
benevolence from drivers because of the evaluating system.
Second, information can increase the transparency of the driver’s ability and integrity.
While the historical ratings and reviews and the personal information of the driver are
shown to the passenger on the network, passengers can comprehensively speculate the
driver’s upcoming serving behaviors through these information. For example, the
passenger will consider the driver is competent when the driver has enough serving
experiences recorded on the system, which means the passenger recognizes the driver has
enough ability to provide the service. Also, when the passenger see positive comments of
the driver written by previous passengers, the passenger would consider the driver has
good reputation, which means the driver’s integrity is recognized. Hence, the trustor’s
ability and integrity are much more easily to express to the trustee than before in this
network, because the system would remember each previous behaviors, and publish all
of them for the trustee’s future judgement.
To sum up, while the review and rating system raises passengers perception on
drivers’ ability, integrity, and benevolence, this research consider it is exactly because of
its high quality information that truly helps passengers for judgment of the trustworthiness
of the drivers. Therefore, this research develops the hypothesis below:
H2: Information quality has a positive influence on people’s trust of the sharing peer.
This research posits that information can increase people’s trust on the sharing peer
through a special kind of trust called institutional-based trust. Institution-based trust is
based on third-party structures (Pavlou & Gefen, 2004). While two people have to share
and be shared with the other one, and there is no previous interaction between them, a
third party will be helpful. A third party would create a structure which can make an
environment feel trustworthy (McKnight, Choudhury, & Kacmar, 2002). Two people
would trust each other and start their sharing activity based on both of their trust on the
third party institution, which is independent of the dyadic action. Therefore, this research
considers that while information have a positive influence on people’s trust of the sharing
economy platform, these kind of information can also increase people’s trust of the
sharing peer through the effect of institutional-based trust, that causes the trust on the
platform become the mediator between the information quality and the trust on the sharing
peer. The hypothesis is below,
H3: Information quality which can facilitate information sharing has a positive influence on people’s trust of the sharing peer through the mediation effect of trust on the sharing economy platform.
After arguing that information will increase people’s trust towards sharing peers and
the sharing economy platform, this research would further propose that these information
will increase people’s participating intention of sharing economy platform by the
mediation effect of trust. Trust is a subjective feeling that the trustee will behave in a
certain way according to an implicit or explicit promise he makes (Gefen, Karahanna, &
Straub, 2003). It is an essential ingredient for transactions in sharing economy programs.
In the process of participating in the sharing economy program, an individual would
receive specific services from another person by the assistance of the platform (Ert,
Fleischer, & Magen, 2016), but the individual often does not know that person before,
and the individual also may not be familiar with the platform. At this moment, if the
individual can trust that person and the platform, it means that the individual believes that
his expectation of participating in the sharing economy platform will be met by both of
them, s/he should be more likely to participate in the sharing economy program, which
means s/he has high participating intention. Thus, while trust would increase people’s
intention of participating sharing economy programs, it would be the mediator between
the information quality and participating intention, that information quality indirectly
increase participating intention through the effect of trust on the sharing peers and the
sharing platform:
H4: Information Quality has a positive influence on people’s intention of participating in sharing economy programs through the mediation effect of people’s trust on the sharing economy platform.
H5: Information Quality has a positive influence on people’s intention of participating in sharing economy programs through the mediation effect of people’s trust on the sharing peer.
Further, extended hypothesis 3, a hypothesis is also developed below,
H6: Information Quality has a positive influence on people’s intention of participating in sharing economy programs through the mediation effect of people’s
trust on the sharing economy platform and then through the sharing peer.
Figure 1
Chapter 3. Methodology
3.1. Research Method 3.1.1. Research Target
This research would mainly focus on figuring out how information increase peoples’
trust on the operating company and the peers, further increase people’s participating
intention. UBER is selected as the sample of the sharing economy program, which their
users include drivers and passengers. This research would focus on passenger side’s
intention of using UBER service rather than the driver’s side, because this research
considers that theses information mainly focus on passengers. Comparing with taking
taxis in the past that there was seldom information disclosure before the trip, UBER
mainly provides passengers flourish information which mentioned before. Drivers have
to fill in their personal information, car information before they can officially accept
passenger’s service requesting, while passengers don’t, and these information are
disclosed to passengers. Therefore, because this study mainly focus on the effect of
information, UBER passengers will be the research sample instead of drivers.
3.1.2. Variables
This present research attempts to conduct surveys, which includes questions and
statements to which the participants are expected to respond anonymously. As the
research model (Figure 1) shows, intention of participation is the dependent variable,
information quality is the independent variable, and trust on the sharing company, trust
on the sharing peers are independent and dependent variables.
3.1.3. Intention of Participation
When measuring passenger side’s participating intention, the way of participation
should be discussed first. Hence, this research would firstly distinguish people into two
parts by their past experience, people who have used UBER before, and people who have
never tried UBER before. Then, the participating intention of people who have used
UBER before will be defined and measured as the intention of continuously using UBER
in the future, which the questionnaire is adapted from Hamari’s research (Hamari et al.,
2016). In contrast, to people who have never used UBER before, their participating
intention will be defined and measured as the intention of starting to try UBER, which is
adapted from Klopping’s research (Klopping & McKinney, 2004). By measuring with
different questions, people’s true intention of using UBER in the future will be observed
correctly under different conditions.
3.1.4. Information Quality
While UBER uses IT mechanisms to provide flourish information to passengers
which are mentioned before, this research adapts the concept of information quality,
which is an essential element of the IS successful model, for measurement. In E-
commerce field, Bock progressed and examine the quality of information in four
perspective, content, accuracy, timeliness, and usefulness. Through the questionnaire
derived from these perspectives, passengers would be asked whether they consider the
information that UBER provides have enough quality according to these perspectives.
3.1.5. Trust on the Sharing Company and the Sharing Peers
To measure trust, this research adapts McKnight’s research (McKnight et al., 2002)
to focus on measuring the trustee’s ability, benevolence, and integrity. In passengers’
perspective, the sharing company would be UBER, and the sharing peers would be drivers.
3.2. Research Procedure
This research conducts surveys to examine the research model. Survey participants
will be recruited from the Internet, and the participants must have heard about UBER
before. The survey will be conducted in a laboratory with computers for participants to
finish the survey. There are five parts of the survey. At the beginning part, this research
will firstly ask whether the participant have used UBER before, and the answer of this
question will influence the measurement of participating intention later. Second, this
research will briefly introduce UBER to participants again. The introduction mainly
includes two parts, the passenger’s platform using process, and the information that
UBER provides to the passenger. To deliver these two parts of information to participants,
the introduction will provide screenshots of the process of using UBER by each steps,
and the information which UBER provides to passengers at each steps will also be marked
and emphasized. Thus, before answering the following questions, participants will have
the knowledge of UBER which this research needs. Then, while the information which
UBER provides is described to participants at the previous part, information quality will
be implemented and measured in this part. Fourth, participants would be asked about their
perception of trust on the UBER company and drivers, and their participating intention in
the future as well. As mentioned, the measurement participating intention will depend on
the participant’s previous using experience on UBER. And finally, demographic questions
will be asked. Demographic information collected from the participants will be compared
against the results of a field survey conducted by Market Intelligence & Consulting
Institute (MIC) (2016), the largest survey institution in Taiwan’s information and
communication technology industry, on sharing economy usage, purpose and behavior.
After finishing the surveys, participants will be rewarded with NT$150 as compensation
for their involvement.
3.3. Participants
This study has collected 394 participants as the research sample. In this sample, 288
of the participants had used UBER before, whereas the other 106 of the participants had
no using experience of UBER. Besides, the demographic distributions and sharing
economy usage of the sample is listed and compared with MIC’s reports for examination
of external validity at the following section,
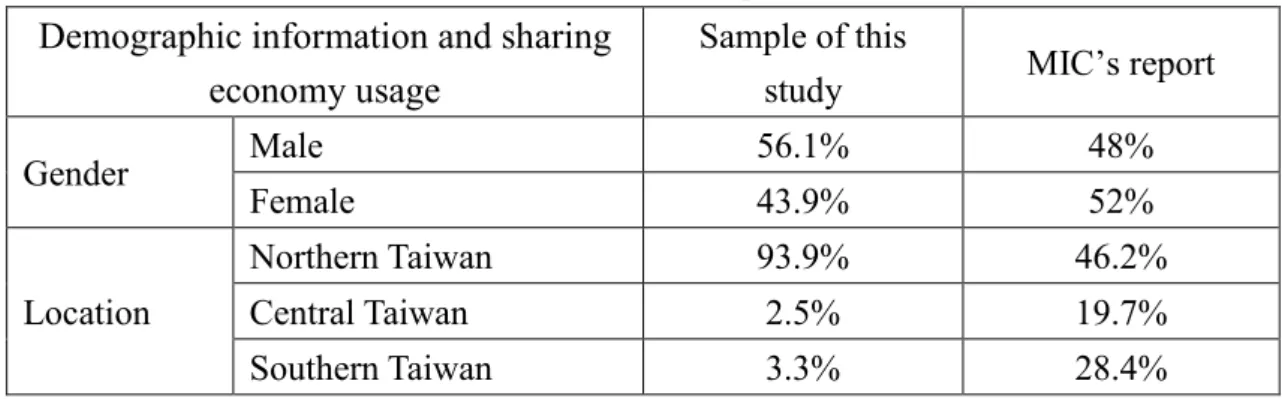
Table 1. Demographic Information and Sharing Economy Usage Comparing against That of MIC’s Report
Demographic information and sharing economy usage
Sample of this
study MIC’s report
Gender Male 56.1% 48%
Female 43.9% 52%
Location
Northern Taiwan 93.9% 46.2%
Central Taiwan 2.5% 19.7%
Southern Taiwan 3.3% 28.4%
Eastern Taiwan 0% 5.7%
Else provision 0.3% 0%
Operating System of Cellphone
Windows 1% 4.1%
Android 40.4% 67.2%
IOS 58.6% 28.7%
Age
13~15 0% 2.5%
16~20 20.1% 10.2%
21~25 69.3% 10.2%
26~30 7.1% 11.1%
31~35 2% 11.1%
36~40 1% 9.7%
41~45 0.3% 8.8%
46~50 0.3% 12.1%
51~55 0% 10.3%
56~60 0% 8.3%
Equal or more than 61 0% 5.7%
Contracts of the Mobile Internet traffic
No Internet Traffic 2% 11.6%
Less than 3GB/month 5.8% 21.7%
>3GB, but <5GB/month 6.6% 13.1%
>5GB, but <10GB/month 12.4% 8.8%
>10GB/month, but has limitation
10.2% 6.3%
Without limitation 62.7% 38.4%
Other(Please Describe) 0.3% 0.2%
Job Status
Full time 9.4% 51.1%
Part time 9.1% 8.9%
Student 78.9 12.8%
Freelancer 0% 9.7%
Retired 0% 4.6%
Looking for Job 1.5% 4.4%
Housewife/Househusband 0% 0.3%
No need to work 0.8% 0.3%
Other(Please Describe) 0.3% 0.9%
Availability of Income
Less Than $5,000 12.7% 15.2%
$5,001 ~$10,000 36.8% 12.2%
$10,001~$20,000 29.9% 14.4%
$20,001~$30,000 11.2% 14.2%
$30,001~$40,000 4.3% 11.2%
$40,001~$50,000 3% 7.6%
$50,001~$60,000 0.5% 4.4%
$60,001~$70,000 0.3% 2.5%
$70,001~$80,000 0% 1.3%
More Than $80001 1.3% 2.7%
Reasons to use sharing economy programs
Cost Saving 32.2% 37.2%
Resource sharing 9.6% 27.9%
Environment protection 2.8% 13.1%
Relationship building 1% 9.5%
Convenience 53.8% 34.8%
Other(Please Describe) 0.6% 0.5%
Most used service of sharing economy programs
Multimedia entertainments
33% 48.4%
Second-hand trading 18.5% 39.3%
Picking up service 18.8% 34.2%
Knowledge sharing 8.9% 33.1%
House renting 2.5% 21.3%
Lessons by experts 0.3% 15.3%
Pets keeping 0% 15.3%
House cleaning 0% 19.9
Food delivering 7.1% 20.8%
Online course 9.6% 14.6%
Other(Please Describe) 1.5% 0%
Note: This survey collected data on March, 2017. The survey totally recruited 1208 respondents.
Chapter 4. Empirical Results
4.1. Procedure of Data Analyzing
This study adopted the following methods to analyze the data. First, the reliability
and validity of the data will be examined. The validity includes external validity and
internal validity. External validity will be examined by comparing the demographic
information between the sample of this study and MIC’s research, thereby making sure
the results of this study can be generalized across various situations and people. In internal
validity, EFA will firstly be conducted to exclude items with low loadings, cross-factor
loadings, or loaded on a wrong factor, and then CFA will be conducted to examine the
construct validity (convergent and discriminant validity). On the other hand, reliability
will be assessed with Cronbach ’ s α . After the examinations above, a structural
equation model analysis will be adopted to test the research hypothesis.
4.2. Reliability and Validity
` First of all, to examine the external validity, the demographic information of this
study is compared with MIC’s report. While this study is conducted in National Taiwan
University, it is found that the percentage of participants’ career status is extremely
different from MIC’s report. There are 78.9% of the participants in this study are
students, whereas MIC’s report contains only 12.8% as students. This also caused
strong difference of participants’ salary and age distribution between this study and
MIC’s report, which are shown in table 1 above. Due to the difference, this research
conducted alternative examination. Since the percentage of the students may be the
main issue, this research conducted ks-test to the responses between students and non-
students in the sample. After taking averages of the responding items respectively by
each constructs (i.e., information quality, trust on the platform, trust on the sharing peer,
and participating intention), the result is below,
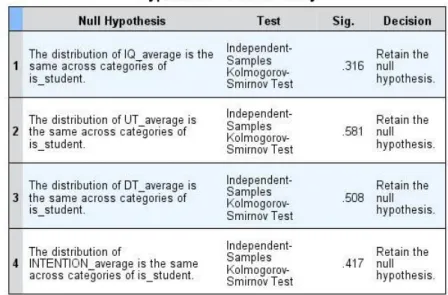
Table 2. ks-test result of comparison between student and non-student groups
Note: IQ_average: Information Quality, UT_average: Trust on UBER, DT_average:
Trust on Drivers, INT_average: Intention.
Table 2 shows that the responses of each construct between students and non-
students are not significantly different. Based on the result, whether a person is a student
or not can be assumed to have no impact on the research model, which means this study
has acceptable external validity.
After that, whether participants had used UBER before would influence the
participants’ responses should also be verified. Thus, another ks-test was conducted below,
before and had never used UBER before
Note: IQ_average: Information Quality, UT_average: Trust on UBER, DT_average:
Trust on Drivers, INTENTION_average: Intention.
According to table 3, however, participants’ responses of trust on drivers and their
participating intention are significantly different. Participants with different using
experience may influence their behavior in the survey. Hence, These two groups of people
cannot be treated as one sample in the following analysis. This research would later
separate the whole sample into two subsamples. 288 participants of which had the
experience of using UBER before, while the remaining 106 people don’t, and both of
which will respectively being assessed.
4.2.1. Sample with participants which had used UBER before
The validity and reliability of the sample which had used UBER before is examined
firstly. This research adopted Exploratory factor analysis (EFA) to eliminate low loadings,
cross-loadings, or items loaded on the wrong factors. To test the suitability of the EFA
analysis, Kaiser-Meyer-Olkin (KMO) measure of sampling adequacy was adopted for
assessment beforehand. While KMO index is considered to be greater than 0.50 for factor
analysis (Hair, Anderson, Tatham, & Black, 1998), the KMO index of this study is 0.893
and is significant (p<0.001), which is regarded to be suitable. The EFA result with
varimax rotation is listed below in table 4,
Table 4. EFA and Cumulative Percentage of Variance Explained before taking average on sample which participants had used UBER before
Component
1 2 3 4 5 6
IQ1 .829
IQ2 .711
IQ3 .739
IQ4 .791
INT1 .802
INT2 .911
INT3 .909
INT4 .906
UT1 .681
UT2 .710
UT3 .771
UT4 .796
UT5 .761
UT6 .635
UT7 .794
UT8 .752
UT9 .682
UT10 .583
DT1 .706
DT2 .729
DT3 .742
DT4 .811
DT5 .775
DT6 .663
DT7 .842
DT8 .669
DT9 .730
DT10 .838
.812
Eigen Value 4.864 4.433 3.381 3.159 2.833 2.152
% variance explained 16.771 15.286 11.658 10.892 9.768 7.422 Cumulative % variance
explained 16.771 32.057 43.715 54.607 64.375 71.798 Extraction method: Principal component analysis; rotation method: Varimax with Kaiser normalization; IQ: Information Quality, UT: Trust on UBER, DT: Trust on Drivers, INT: Intention.
Based on the result of EFA, there are few issues to discuss. One item from the scale
of participants trust on UBER (UT11) was dropped due to wrong factor loading
(perceived trust on drivers: 0.608). Besides, the number of factors extracted should also
be discussed. The construct “trust” in this study contains 3 elements: benevolence,
integrity, and competence, and trust on UBER and drivers are measured respectively.
Hence, the number of factors should theoretically be 8 (Information Quality, perceived
benevolence, integrity, and competence respectively on UBER and drivers, and
participating intention). However, the factors of perceived benevolence and integrity on
benevolence and integrity on drivers. Therefore, there are finally 29 items only loaded on
6 factors, which is shown in table 4. Further, while benevolence, integrity, and
competence are formed to be trust, this study took averages respectively by the perception
of benevolence, integrity, and competence on UBER and drivers to became trust on
UBER and drivers, and did another EFA analysis below,
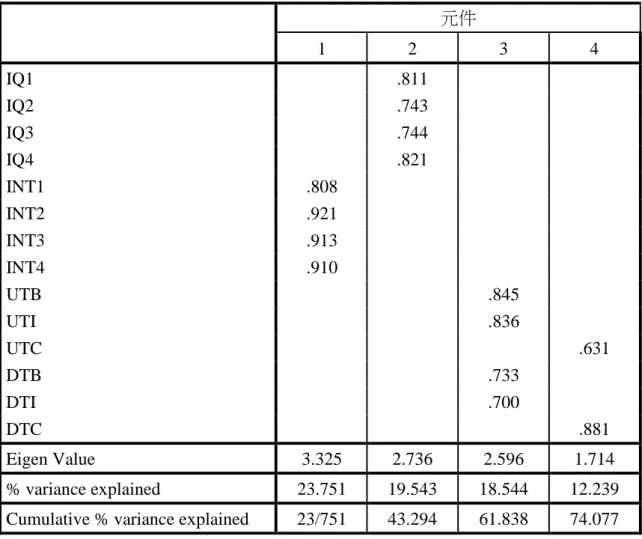
Table 5. EFA and Cumulative Percentage of Variance Explained after taking average on sample which participants had used UBER before
元件
1 2 3 4
IQ1 .811
IQ2 .743
IQ3 .744
IQ4 .821
INT1 .808
INT2 .921
INT3 .913
INT4 .910
UTB .845
UTI .836
UTC .631
DTB .733
DTI .700
DTC .881
Eigen Value 3.325 2.736 2.596 1.714
% variance explained 23.751 19.543 18.544 12.239
Cumulative % variance explained 23/751 43.294 61.838 74.077 Extraction method: Principal component analysis; rotation method: Varimax with Kaiser normalization; IQ: Information Quality, UTB: Trust on UBER_Benevolence, UTI: Trust on UBER_Integrity, UTC: Trust on UBER_Competence, DTB: Trust on Drivers_Benevolence, DTI: Trust on Drivers _Integrity, UTC: Trust on Drivers _Competence, INT: Intention.
Unfortunately, the result of table 5 reveals few concerns toward the data’s validity.
Theoretically, the perception on UBER’s benevolence, integrity, and competence should
be categorized to the factor which represent people’s trust on UBER, and so is the
elements on people’s trust on drivers. However, through the EFA result, people’s
perception on UBER’s benevolence, integrity and people’s perception on drivers’
benevolence, integrity are regarded as one factor. On the other hand, the perception on UBER’s competence and the perception on drivers’ competence are regarded as another
factor. The result threatens this research’s construct validity, which includes convergent
validity and discriminant validity. As the perspective of convergent validity, the trust on
UBER do not contain benevolence, integrity, and competence as one construct, and the
trust on drivers have the same concern. And as the perspective of discriminant validity,
theoretically trust on UBER and trust on drivers should be separated. However, the
benevolence and integrity of UBER are related with the benevolence and integrity of
drivers, and UBER’s competence are related with drivers’ competence. Therefore, due to
the concerns on the convergent validity and discriminant validity, this research conducted
additional analysis for further examination on validity.
Confirmatory factor analysis (CFA) is performed for further evaluation. For
discussion of construct validity, table 6 shows the factor loadings, AVEs, CRs as
assessments of convergent validity, and displays Cronbach’s α as an index of reliability.
Besides, table 7 shows the square root the AVEs and the correlation of between each
constructs to discuss discriminant validity. The tables are shown below,
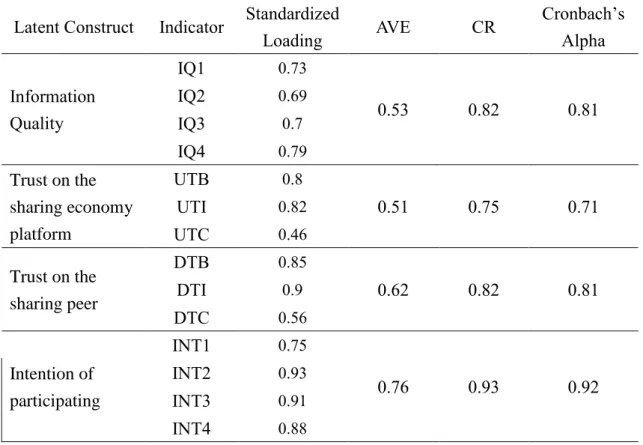
Table 6. Reliability and Validity: Standardized Factor Loadings for the Construct Indexes, Cronbach’s α, Average Variance Extracted, and Construct Reliability of sample
which participants had used UBER before Latent Construct Indicator Standardized
Loading AVE CR Cronbach’s
Alpha
Information Quality
IQ1 0.73
0.53 0.82 0.81
IQ2 0.69
IQ3 0.7
IQ4 0.79
Trust on the sharing economy platform
UTB 0.8
0.51 0.75 0.71
UTI 0.82
UTC 0.46
Trust on the sharing peer
DTB 0.85
0.62 0.82 0.81
DTI 0.9
DTC 0.56
Intention of participating
INT1 0.75
0.76 0.93 0.92
INT2 0.93
INT3 0.91
INT4 0.88
IQ: Information Quality, UTB: Trust on UBER_Benevolence, UTI: Trust on UBER_Integrity, UTC: Trust on UBER_Competence, DTB: Trust on Drivers_Benevolence, DTI: Trust on Drivers _Integrity, UTC: Trust on Drivers _Competence, INT: Intention.
Table 7. Discriminant Validity: The Square Root of AVEs of sample which participants had used UBER before
1 2 3 4
1. Information Quality 0.729 2. Trust on the sharing economy
platform
0.436 0.713
3. Trust on the sharing peer 0.314 0.625 0.784
Note: The diagonal numbers are square root of AVE.
Factor loadings, AVEs, CRs in table 6 will be assessed to examine convergent
validity. Factor loadings are suggested to be greater than .40 (Hair et al., 1998), and the
result reveals that the standardized loadings of all items exceed the threshold. Besides,
the AVEs and CRs of all the items are above the recommended cut-off level respectively,
which AVE is suggested to be more than 0.5 and CR should be more than 0.7 (Fornell &
Larcker, 1981). Further, the Cronbach’s α value of the items also exceed the satisfactory level which is above 0.7, which means that the items have good reliability.
Therefore, convergent validity is considered to be acceptable when regarding factor
loadings, AVEs, and CRs as its reflections, that the indexes show the constructs, especially
trust, can still be formed by their original sub items, like benevolence, integrity, and
competence.
After that, discriminant validity is assessed by comparing the root square of AVEs
of each constructs and their correlation coefficient between other constructs. As
illustrated in table 7, it is found that the diagonal numbers which representing the root
square of AVEs of all the constructs are higher than off-diagonal values which means the
correlation coefficients. The result is considered reaching the satisfactory level of
discriminant validity (Fornell & Larcker, 1981).
According to the result revealed by EFA and CFA analysis above, this study would
like to discuss the construct validity again, especially focus on trust on UBER and trust
on drivers. Based on the analysis of EFA, this research admits that the convergent validity
and discriminant validity would be questioned because benevolence, integrity, and
competence cannot be formed as one factor that represent trust, and trust on UBER and
trust on drivers have components that are categorized as same factors. However, the
indexes through CFA not only suggest convergent validity of the measurements is
acceptable, but also indicated the discriminant validity of all construct are suitable.
Therefore, collecting the perspective from different analysis, this research suggests that
though the issues of construct validity existed, but is still tolerable.
Another issue is discovered through table 7 that the coefficient correlation between
trust on UBER and trust on drivers is 0.625. The number is high and reveals that
collinearity may existed between these two factors. Thus, this research conducted
Variance Inflation Factor (vif) examination below to test whether the factors have
collinearity effect,
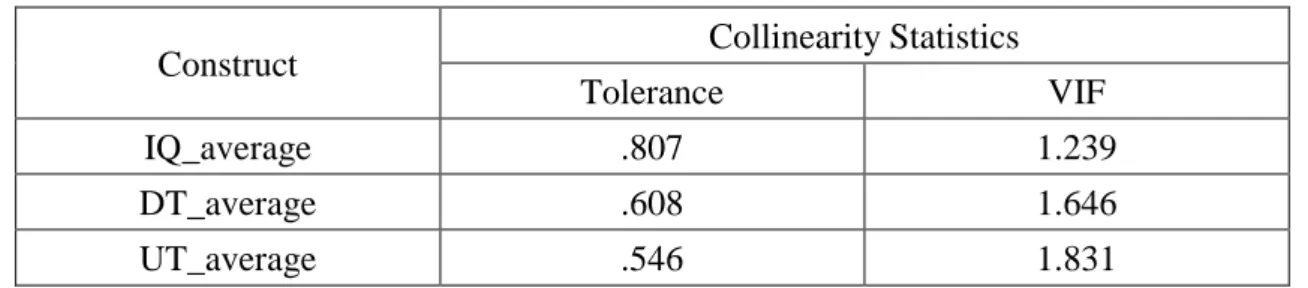
Table 8. Vif Table of sample which participants had used UBER before
IQ_average: Information Quality, DT_average: Trust on Drivers, UT_average: Trust on
Construct Collinearity Statistics
Tolerance VIF
IQ_average .807 1.239
DT_average .608 1.646
UT_average .546 1.831
UBER
Constructs will be considered having collinearity effect when vif value is greater
than 10 (Cohen, West, & Aiken, 2014). Table 8 shows that all the vif value of the
constructs are much less than 10. Thus, even though trust on UBER and drivers have high
coefficient correlation in table 7, the vif result eliminate the concern of their collinearity
to a certain extent.
4.2.2. Sample with participants which had never used UBER before
After examining the validity and reliability of the sample which people had used
UBER before, this study would move on to discuss the validity and reliability of the
sample which participants had never used UBER before. EFA with varimax rotation is
conducted firstly below. The KMO index is 0.911 in a significant level (p<0.001).
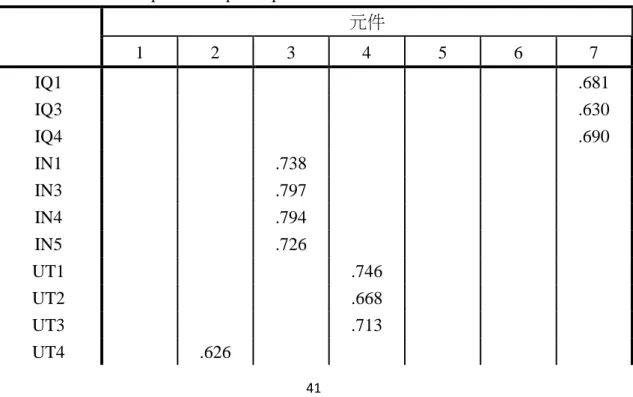
Table 9. EFA and Cumulative Percentage of Variance Explained before taking average of sample which participants had never used UBER before
元件
1 2 3 4 5 6 7
IQ1 .681
IQ3 .630
IQ4 .690
IN1 .738
IN3 .797
IN4 .794
IN5 .726
UT1 .746
UT2 .668
UT3 .713
UT4 .626
UT5 .804
UT6 .740
UT7 .745
UT8 .760
UT9 .779
UT10 .587
DT2 .651
DT3 .783
DT4 .853
DT5 .803
DT6 .724
DT7 .799
DT8 .808
DT9 .741
DT10 .716
Eigen Value 5.153 3.335 2.868 2.762 2.515 2.390 2.039
% variance
explained 19.819 12.828 11.030 10.622 9.672 9.191 7.841 Cumulative
% variance explained
19.819 32.647 43.677 54.298 63.971 73.162 81.003
Extraction method: Principal component analysis; rotation method: Varimax with Kaiser normalization; IQ: Information Quality, UT: Trust on UBER, DT: Trust on Drivers, INT: Intention.
Based on the EFA result, 26 items are extracted to 7 factors. IQ2, INT2, UT11, DT11
are dropped due to wrong loading or cross-loading. Besides, theoretically there are 8
factors extracted (Information Quality, perceived benevolence, integrity, and competence
respectively on UBER and drivers, and participating intention). However, perceived
benevolence, integrity of drivers are not distinguishable through EFA. Further, another
EFA were conducted after taking averages respectively by the perception of benevolence,
integrity, and competence on UBER and drivers, which becoming trust on UBER and
drivers. The result is below,
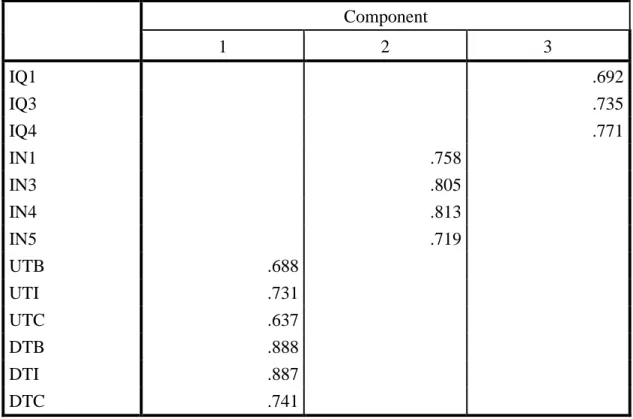
Table 10. EFA and Cumulative Percentage of Variance Explained after taking average of sample which participants had never used UBER before
Component
1 2 3
IQ1 .692
IQ3 .735
IQ4 .771
IN1 .758
IN3 .805
IN4 .813
IN5 .719
UTB .688
UTI .731
UTC .637
DTB .888
DTI .887
DTC .741
Extraction method: Principal component analysis; rotation method: Varimax with Kaiser normalization; IQ: Information Quality, UTB: Trust on UBER_Benevolence, UTI: Trust on UBER_Integrity, UTC: Trust on UBER_Competence, DTB: Trust on Drivers_Benevolence, DTI: Trust on Drivers _Integrity, UTC: Trust on Drivers _Competence, INT: Intention.
EFA shows that items are extracted to 3 factors. Through table 10, trust on UBER
and trust on drivers are regarded as a same factor which is undistinguishable. Similar
with the sample which participants had used UBER before, this result threaten the
construct validity especially discriminant validity. Thus, CFA were adopted to provide
more evidence to discuss construct validity and reliability.
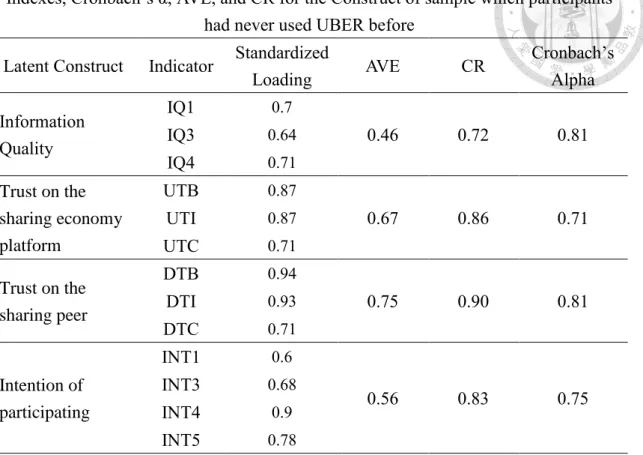
Table 11. Reliability and Validity: Standardized Factor Loadings for the Construct Indexes, Cronbach’s α, AVE, and CR for the Construct of sample which participants
had never used UBER before Latent Construct Indicator Standardized
Loading AVE CR Cronbach’s
Alpha Information
Quality
IQ1 0.7
0.46 0.72 0.81
IQ3 0.64
IQ4 0.71
Trust on the sharing economy platform
UTB 0.87
0.67 0.86 0.71
UTI 0.87
UTC 0.71
Trust on the sharing peer
DTB 0.94
0.75 0.90 0.81
DTI 0.93
DTC 0.71
Intention of participating
INT1 0.6
0.56 0.83 0.75
INT3 0.68
INT4 0.9
INT5 0.78
IQ: Information Quality, UTB: Trust on UBER_Benevolence, UTI: Trust on UBER_Integrity, UTC: Trust on UBER_Competence, DTB: Trust on Drivers_Benevolence, DTI: Trust on Drivers _Integrity, UTC: Trust on Drivers _Competence, INT: Intention.
Table 12. Discriminant Validity: The Square Root of AVEs of sample which participants had never used UBER before
1 2 3 4
5. Information Quality 0.684 6. Trust on the sharing economy
platform
0.610 0.820
7. Trust on the sharing peer 0.448 0.759 0.867
8. Intention of participating 0.391 0.473 0.452 0.785 Note: The diagonal numbers are square root of AVE.
Table 11 and table 12 discusses about the construct validity and reliability. In table
11, all the factor loadings of the items are above the suggested value 0.40, and CRs are
also exceed 0.70. While AVE is commonly suggested to be higher than 0.5 (Fornell &
Larcker, 1981), information quality has 0.46 which is a little bit lower than the threshold,
and the other constructs both fulfill the suggested value. Besides, the Cronbach’s α are
all greater than the threshold 0.70. These indexes points out the sample still has acceptable
convergent validity and good reliability. Table 12 presents the square root of AVEs and
the coefficient correlation between constructs for judgement of discriminant validity.
Since all the square root of AVEs are all greater than the coefficient correlations,
discriminant validity can also be regarded as acceptable.
The result of validity and reliability examination through EFA and CFA analysis
presents similar condition to the result of the sample which participants had used UBER
before. The EFA result is not ideal because trust on UBER and trust on drivers are
regarded as similar factors. However, CFA provided different perspective to propose that
the sample still has acceptable construct validity. Thus, the conclusion this study raises at
this part is similar to previous sample, that the validity is not favorable, but still tolerable.
Also, when focusing more on table 12, it is discovered that the coefficient correlation
between trust on UBER and trust on drivers is 0.759, which is considerably high. Hence,
vif examination is also conducted below,
Table 13. Vif Table of sample which participants had never used UBER before
IQ_average: Information Quality, DT_average: Trust on Drivers, UT_average: Trust on UBER
The numbers of vif value from table 13 are all less than the threshold 10.0 (Cohen
et al., 2014).Thus, in this sample, even though trust on UBER and drivers have high
coefficient correlation in table 12, the vif result eliminate the concern of their collinearity
to a certain extent.
4.3. SEM Analysis
Structural equation model was run on LISREL8.54 program to test the research
model. Because of the separation of two samples, this study respectively construct the
SEM model based on the samples which participants had used or never used UBER before.
The goodness of fit of two models will be provided firstly, and then hypothesizes will be
tested afterward. Table 14 shows the goodness of the models.
Table 14. Goodness of Fit Statistics Results of SEM Analysis
Sample χ2/df GFI AGFI CFI NFI NNFI IFI RMSEA SRMR Used UBER 4.06 0.87 0.81 0.93 0.91 0.92 0.93 0.10 0.09
Never Used UBER before
2.17 0.84 0.76 0.95 0.91 0.93 0.95 0.11 0.07
Construct Collinearity Statistics
Tolerance VIF
IQ_average .627 1.594
DT_average .333 3.007
UT_average .423 2.362
Hypothesizes will be tested by looking at the correlation coefficients, direct and
indirect effect between constructs. Table 15 displays all the coefficients below and two
samples will be discussed respectively.
Table 15. Results of SEM Analysis
Sample Hypothesis
Direct Effect Coefficients
(std.)
Indirect Effect Coefficients
(std.) Total Effect Coefficients
(std.)
Results of Hypothesis
Testing X->M
M->M’
(If existed)
M(M’)-
>Y
Used UBER before
H1 IQ->UT
0.45**
(0.09) - - - 0.45**
(0.09) Supported H2
IQ->DT
0
(0.10) - - - 0
(0.10)
Not Supported H3
IQ->UT-
>DT
0 (0.10)
0.45**
(0.09) - 0.72**
(0.12)
0.33**
(0.10) Supported H4
IQ->UT-
>INT
- 0.45**
(0.09) - 0.06 (0.10)
0.11**
(0.04)
Not Supported H5
IQ->DT-
>INT
- 0
(0.10) - 0.25*
(0.08)
Not Supported H6
IQ->UT ->DT->INT
- 0.45**
(0.09)
0.72**
(0.12)
0.25*
(0.08) Supported
Never Use UBER before
H1 IQ->UT
0.78**
(0.28) - - - 0.78**
(0.28) Supported H2
IQ->DT
-0.32
(0.29) - - - -0.32
(0.29)
Not Supported H3
IQ->UT-
-0.32 (0.29)
0.78**
(0.28) - 1.11**
(0.38)
0.55**
(0.29) Supported