國立交通大學
土木工程學系碩士班
碩士論文
反復扭轉剪力夯實造成之砂土密度增加
Densification of Sand Due to Cyclic Torsional
Shear Compaction
研 究 生 : 陳冠宇
指導教授 : 方永壽 博士
反復扭轉剪力夯實造成之砂土密度增加
Densification of Sand Due to Cyclic Torsional Shear Compaction
研 究 生: 陳冠宇
Student:Kuan-Yu Chen
指導教授:方永壽 博士
Advisor:Dr. Yung-Show Fang
國 立 交 通 大 學 土 木 工 程 學 系 碩 士 班
碩士論文
A Thesis
Submitted to the Department of Civil Engineering
College of Engineering
National Chiao Tung University
in Partial Fulfillment of the Requirements
for the Degree of
Master of Engineering
in Civil Engineering
September, 2011
Hsinchu, Taiwan, Republic of China
中華民國一百年九月
反復扭轉剪力夯實造成之砂土密度增加
研究生 : 陳冠宇 指導教授 : 方永壽 博士
國立交通大學土木工程學系碩士班
摘要
本論文以實驗方法探討反復扭轉剪力夯實造成之沉陷量及相對密度的變化。 本研究使用自行設計建造之交通大學反復扭轉剪力夯實儀。扭力板手被安裝在夯 實儀上,用來施加反復扭矩和反復剪應力在土層表面。本研究以氣乾之渥太華砂 為回填土,試體整層填土高度為 0.6 m。回填土初始相對密度為 34.5 %,試體採 用直徑為 0.3 m 的鋼質圓盤施加垂直正向應力 9.24 kPa。施加反復剪應力的扭剪轉 角為+5°,反復扭剪作用次數包含 1、2、5、10、20、30 及 40 次。本研究採用雷 射測距儀來量測土體表面沉陷量,密度控制盒埋置於試體內部以量測各點土壤相 對密度。實驗結果顯示,靜態垂直載重在深度 150 mm (圓盤半徑)以內有效的造成 土壤密度增加,在深度 150 mm 以下區域造成的土壤密度增加量不明顯。在前 2 次反復扭轉剪力作用後,土壤表面沉陷量增加明顯。在反復扭轉剪力作用 20 次 後,土壤的顆粒重新排列趨於緊密,後續扭轉造成之沉陷量會趨緩。在 20 次反復 扭轉剪力作用後,深度 150 mm 以內土壤的相對密度增加至大於 70 %,反復扭剪 方法改良的有效深度僅限於土層深度 150 mm 以內。土壤的相對密度會隨著反復 扭剪次數的增加而增大,在反復扭剪 20 次以後,夯實的效果會趨緩。對 4 層各 0.15 m 厚的土層表面分別進行反復扭轉剪力夯實 20 次後,各土層內的土壤的相對 密度值都被成功的增加至大於 70 %. 關鍵字:土壤夯實;反復扭轉剪力;相對密度;砂;沉陷量Densification of Sand Due to Cyclic Torsional
Shear Compaction
Student: Kuan-Yu Chen Advisor: Dr. Yung-Show Fang Department of Civil Engineering
National Chiao Tung University
Abstract
This paper presents experimental data on the settlement and relative density change of a cohesionless soil due to cyclic torsional shearing compaction. A new cyclic torsional shearing compactor was designed and constructed at National Chiao Tung University. Torque wrenches were attached to the compactor to apply the cyclic torque and cyclic shearing to the soil surface. Air-dry Ottawa sand was used as fill material. The thickness of the soil to be compacted was 0.6 m. The initial relative density of the backfill was 34.5 %. The static vertical normal stress of 9.24 kPa was applied on the soil surface with a 0.3 m-diameter circular steel disc. Then cyclic shearing was applied with rotation angles of plus and minus 5 degrees, and the number of cycles of 1, 2, 5, 10, 20, 30 and 40. Surface settlement of the fill was measured with a laser distance meter. Soil density cups were buried in the cohesionless specimen to monitor the relative density of soil. Test results showed that the density increase due to the static vertical load was obvious in the top 150 mm (radius of the circular loading disc) of the fill. Below the depth of 150 mm, the density increase due to the static surface loading was less obvious. In the first 2 cycles of cyclic torque application, surface settlement increased significantly. However, after 20 cycles, soil particles were rearranged and reached a densely-packed condition, little surface settlement was observed. After 20 cycles, the relative density of soil located 150 mm below the surface was successfally increased to a value greater than 70 %. The cyclic torsional shear soil improvement was effective for the top 150 mm (disc radius) of soil. The relative density of soil increased with increasing number of cycles of torsional shearing. After the first 20
cycles of shearing, the compaction effect became less significant. For the compaction on four 0.15 m-thick lifts, the relative density achieved in each lift was greater than the required value of 70 %.
Keywords: Cyclic torsional shearing; Relative density; Sand; Settlement; Soil
Acknowledgements
The author wishes to give his sincere appreciation to his advisor, Dr. Yung-Show Fang for his enthusiastic advice and continuous encouragement in the past two years. If there is not the guidance from him, the thesis can not be accomplished.
Very special thanks are extended to Dr. Yi-Wen Pan, Dr. Jhih-Jhong Liao, Dr. An-Bin Huang, Dr. Shen-Yu Shan and Dr. Chih-Ping Lin for their teaching and valuable suggestions. In addition, the author also felt a great gratitude to the members of his supervisory committee, Dr. Huei-Wen Chang and Dr. Tao-Wei Feng for their suggestions and discussions.
The author must extend his gratitude to Dr. Tsang-Jiang Chen, Mr. Kuo-Hua Li, Mr. Po-Shou Chen, Mr. Sheng-Feng Huang and Miss Yi-Jhen Jiang for their support and encouragement. Appreciation is extended to all my friends and classmates, especially for Mr. Cho-Min Lin, Mr. Ting-Yuen Huang, Mr. Min-Yi Huang, Mr. Yu-An Huang, Mr. Cheng Liu, Mr. Jia-Hao Dai, Yi-Chang Li and Mr. Cheng-You Li for their encouragement and assistance.
Finally, the author would dedicate this thesis to his grandmother, parents and brother for their continuing encouragement and moral support.
Table of Contents
Abstract (in Chinese) ... i
Abstract ... ii
Table of Contents ... iv
List of Tables ... vi
List of Figures ... vii
List of Symbol ... xii
Chapter 1 Introduction ... 1
1.1 Objectives of Study ... 1
1.2 Research Outline ... 2
1.3 Organization of Thesis ... 2
Chapter 2 Literature Review ... 4
2.1 Soil Improvement Methods ... 4
2.1.1 Densification Techniques ... 5
2.1.2 Soil Densification with Vibratory Compactor ... 5
2.2 Cyclic Simple Shear Test ... 5
2.2.1 Study of Youd ... 6
2.2.2 Study of Hsu and Vucetic ... 6
2.3 Cyclic Torsional Simple Shear Test ... 7
2.3.1 Study of Ishibashi et al. ... 8
2.4 Soil Densification with Cyclic Torsional Shear Compactor ... 9
2.4.1 Study of Yang ... 9
2.4.2 Study of Ren ... 9
2.4.3 Study of Huang ... 10
2.5 Assessment of Relative Density ... 10
Chapter 3 Experimental Apparatus... 12
3.1 Soil Bin... 12
4.1 Shearing Disc ... 14
4.2 Normal Loading Discs ... 15
4.3 Torque Loading Frame ... 15
4.4 Torque wrench ... 16
Chapter 5 Backfill and Interface Characteristics ... 17
5.1 Backfill Properties ... 17
5.2 Lubricated Side Wall Friction ... 18
5.3 Control of Soil Density ... 18
5.3.1 Air-Pluviation Loose Ottawa Sand ... 18
5.3.2 Uniformity of Soil Density ... 19
Chapter 6 Testing Procedure ... 21
6.1 Specimen Preparation ... 21
6.2 Application of Vertical Static Load... 22
6.3 Application of Cyclic Torsional Shear ... 22
Chapter 7 Test Results ... 24
7.1 Applied Cyclic Torsional Shearing ... 24
7.2 Compaction of a 0.6 m-thick Lift ... 25
7.2.1 Settlement Due to Static Vertical Load ... 25
7.2.2 Settlement Due to Cyclic Torsional Shearing ... 26
7.2.3 Relative Density Change Due to Static Vertical Load ... 27
7.2.4 Relative Density Change Due to Cyclic Torsional Shearing ... 27
7.3 Compaction of Four 0.15 m-thick Lifts ... 28
Chapter 8 Conclusions ... 31
References ... 33
Tables ... 36
List of Tables
Table 2.1. Qualitative description of granular soil deposits ...366 Table 4.1. Characteristics of normal loading discs ………..37
List of Figures
Fig. 2.1. Arrangement of uniform spheres 38
Fig. 2.2. Unit weight vs. depth relation for vibratory roller compaction 39
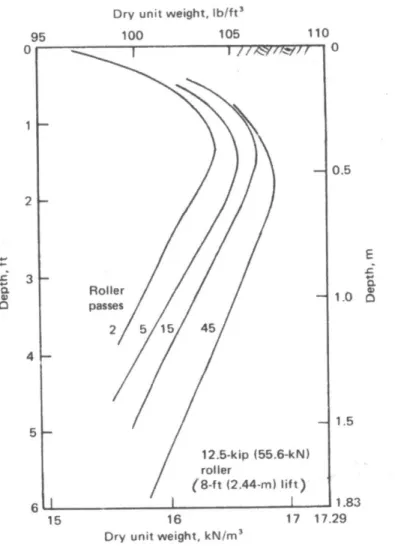
Fig. 2.3. Compacted unit weight profiles for 8-ft lift heights for 2, 5, 15, and 45 vibratory roller passes
40
Fig. 2.4. Approximate method for determining lift height required to achieve a minimum compacted relative density of 75% with five roller passes using data for a large lift height
41
Fig. 2.5. NGI cyclic simple shear apparatus 42
Fig. 2.6. Stress conditions of a soil specimen cyclic horizontal shear stress 43
Fig. 2.7. Void ratio versus cyclic displacement for densification of a sand with successive cycles of shear
44
Fig. 2.8. Sketch of typical results of cyclic simple shear strain-controlled tests with definitions of volumetric cyclic threshold strain
45
Fig. 2.9. Torsional simple shear device 46
Fig. 2.10. Variation of cyclic volumetric strain as a function of cyclic shear strain 47
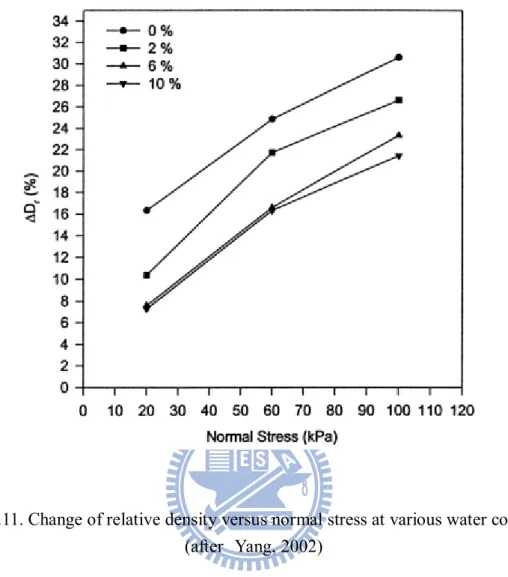
Fig. 2.11. Change of relative density versus normal stress at various water content 48
Fig. 2.12. Change of relative density with one-way and cyclic disc shearing versus normal stress
49
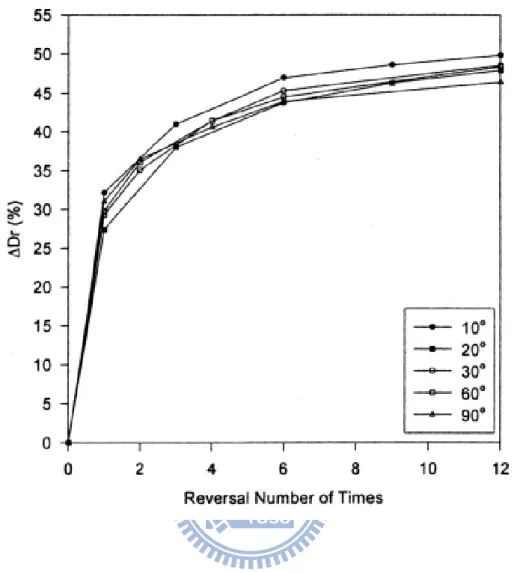
Fig. 2.13 Change of relative density due to cyclic disc shear with number of cycles 50
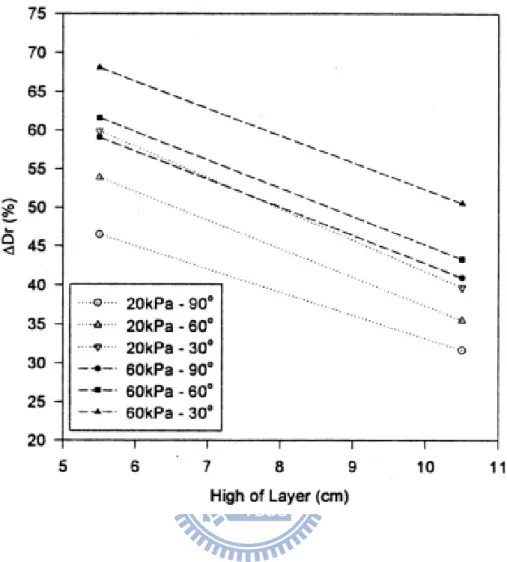
Fig. 2.14 Change of relative density due to cyclic disc shear at different depths with high of layer
51
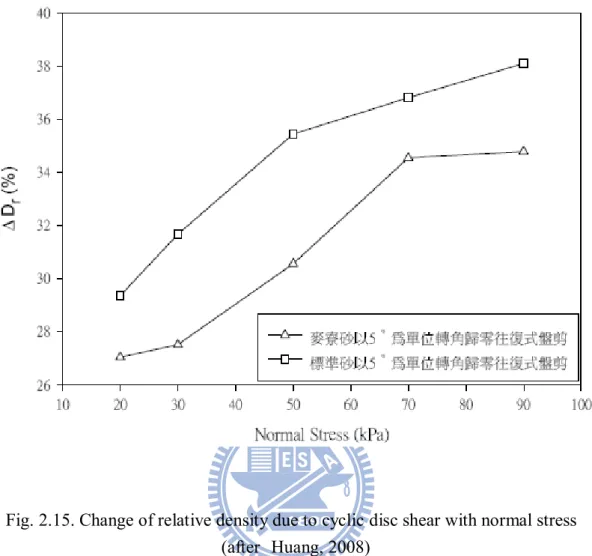
Fig. 2.15. Change of relative density due to cyclic disc shear with normal stress 52
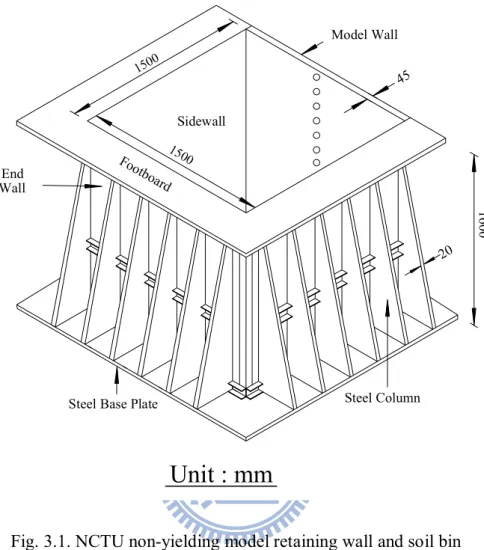
Fig. 3.1. NCTU non-yielding model retaining wall and soil bin 53
Fig.. 4.1. Dimensions of cyclic torsional shear compactor 54
Fig. 4.2. Cyclic torsional shear compactor 55
Fig. 4.3. Bottom of shearing disc with radial fins 56
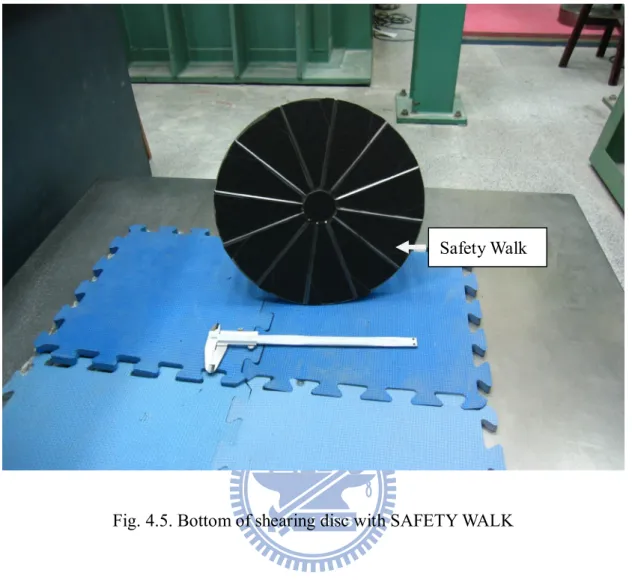
Fig. 4.5. Bottom of shearing disc with SAFETY WALK 58
Fig. 4.6. Several small hand tampers 59
Fig. 4.7. Dimensions of normal loading discs 60
Fig. 4.8. Dimensions of torque loading frame 61
Fig. 4.9. Torque loading frame 62
Fig. 4.10. Dimensions of torque wrench 63
Fig. 4.11. Dimensions of digital torque wrench 64
Fig. 4.12. Torque wrench are installed on the cyclic torsional loading frame 65
Fig. 5.1. Grain size distribution of Ottawa sand 66
Fig. 5.2. Lubrication layer on the side wall 67
Fig. 5.3. Variation of frition Angle with normal stress 68
Fig. 5.4. Relationship among slot opening, drop height, and relative density 69
Fig. 5.5. Soil hopper 70
Fig. 5.6. Pluviation of Ottawa sand into soil bin 71
Fig. 5.7. Dimensions of soil density cup 72
Fig. 5.8. Soil density cup 73
Fig. 5.9. Soil density cups buried at different elevations 74
Fig. 5.10. Arrangement of soil density cups at same elevation 75
Fig. 5.11. Measurement of soil mass in density cup 76
Fig. 5.12. Distribution of relative density with depth 77
Fig. 6.1. Soil storage 78
Fig. 6.2. Sand hopper and electrical scale 79
Fig. 6.3. Sand hopper lifted by overhead crane 80
Fig. 6.4. Air-pluviation of Ottawa sand into soil bin 81
Fig. 6.5. Portable hanging ladders and bridge board hanging on side walls 82
Fig. 6.6. Level soil surface with a brush 83
Fig. 6.7. Place soil density cup on soil surface 84
Fig. 6.8. Check density cup horizontal with a bubble level 85
Fig. 6.10. Measure soil surface location with a laser distance meter 87
Fig. 6.11. Measurement of soil surface location with laser distance meter 88
Fig. 6.12. Grid points on soil surface 89
Fig. 6.13. Hoist of CTSC with overhead crank 90
Fig. 6.14. 5×5 and 4×4 loading formations of disc shearing location 91
Fig. 6.15. Apply vertical static load on loose sand 92
Fig. 6.16. Measurement of surface settlement at center of disc shearing 93
Fig. 6.17. Fixed light dot from laser distance meter 94
Fig. 6.18. Apply cyclic torsional shear on loose fill 95
Fig. 6.19. Shear disc at initial position θ= 0° 96
Fig. 6.20. Shear disc rotated to θ= +5° 97
Fig. 6.21. Shear disc rotated to θ= - 5° 98
Fig. 6.22. Apply cyclic torsional shear to loose sand 99
Fig. 6.23. Compacted soil surface after 4×4 formation of cyclic torsional shear at N=5
100
Fig. 6.24. Compacted soil surface after 5×5 formation of cyclic torsional shear at N=10
101
Fig. 6.25. Soil density cup dug out of compacted soil mass 102
Fig. 6.26. Scraping of soils toward edge of density cup with a spatula 103
Fig. 6.27. Brush away soil particles from base plate of density cup 104
Fig. 7.1. Digital torque wrench 105
Fig. 7.2. Torque with rotation angle for N = 1 106
Fig. 7.3. Torque with rotation angle for N = 2 107
Fig. 7.4. Torque with rotation angle for N = 10 108
Fig. 7.5. Torque with rotation angle for N = 20 109
Fig. 7.6. Torque with number of cycle 110
Fig. 7.7. Determine the maximum torsional shear stress at the edge of the shearing disc due to the applied torque
111
Fig. 7.9. Settlement measurement was carried out with the laser distance meter 113
Fig. 7.10. Surface settlement due to static vertical load at N = 0 114
Fig. 7.11. Surface settlement due to static vertical load at N = 1 115
Fig. 7.12. Surface settlement due to static vertical load at N = 2 116
Fig. 7.13. Surface settlement due to static vertical load at N = 5 117
Fig. 7.14. Surface settlement due to static vertical load at N = 10 118
Fig. 7.15. Surface settlement due to static vertical load at N = 20 119
Fig. 7.16. Surface settlement due to static vertical load at N = 30 120
Fig. 7.17. Surface settlement due to static vertical load at N = 40 121
Fig. 7.18. Surface settlement due to static vertical load at N = 0 to N = 40 122
Fig. 7.19. Surface settlement due to static vertical load at N = 0 to N = 40 123
Fig. 7.20. Soil density cups buried at different elevations 124
Fig. 7.21. Soil dnsity cups place at different locations 125
Fig. 7.22. Distribution of relative density due to vertical static load 126
Fig. 7.23. Distribution of relative density due to cyclic torsional shearing at N = 1 127
Fig. 7.24. Distribution of relative density due to cyclic torsional shearing at N = 2 128
Fig. 7.25. Distribution of relative density due to cyclic torsional shearing at N = 5 129
Fig. 7.26. Distribution of relative density due to cyclic torsional shearing at N = 10 130
Fig. 7.27. Distribution of relative density due to cyclic torsional shearing at N = 20 131
Fig. 7.28. Distribution of relative density due to cyclic torsional shearing at N = 30 132
Fig. 7.29. Distribution of relative density due to cyclic torsional shearing at N = 40 133
Fig. 7.30. Distribution of relative density due to cyclic torsional shearing 134
Fig. 7.31. Soil density cups buried at different elevations in Lift 1 135
Fig. 7.32. Distribution of relative density in lift 1 136
Fig. 7.33. Soil density cups buried at different elevations in Lift 1 and 2 137
Fig. 7.34. Distribution of relative density in lift 1 and 2 138
Fig. 7.35. Soil density cups buried at different elevations in Lift 1 to 3 139
Fig. 7.36. Distribution of relative density in lift 1 to 2 140
List of Symbols
Cu = Uniformity Coefficient
Dr = Relative Density
D10 = Diameter of Ottawa Sand whose Percent finer is 10%
D60 = Diameter of Ottawa Sand whose Percent finer is 60%
emax = Maximum Void Ratio of Soil
emin = Minimum Void Ratio of Soil
f = Frequency
Gs = Specific Gravity
N = Number of Cycle
T = Torque
z = Depth from Surface
= Normal Stress
= Unit Weight of Soil
max = Maximum Torsional Shear Stress
= Disc Rotation Angle
= Angle of Internal Friction of Soil
i = Angle of Interface Friction
sw = Angle of Side-Wall Friction
Chapter 1
INTRODUCTION
In the construction of highway embankments, earth dams, and many other engineering structures, engineers are required to compact loose soils to increase their densities. The objective of the compaction operation is to improve the engineering properties of soil such as increasing shear strength bearing capacity and reducing permeability and settlement. Various techniques are used to reduce the settlement of structures, to improve the shear strength of soil and thus increase the bearing capacity of shallow foundations, to increase the factor of safety against possible slope failure of embankments and earth dams, and to reduce the shrinkage and swelling of soils.
1.1 Objectives of Study
Commonly used in the past some of the general principles of soil improvement, such as compaction, vibroflotation, vibratory roller, dynamic compaction, compaction sand pile, blasting method, compaction pile, vibro rod, and stone columns. These engineering methods may produce a shock and a big noise, not suitable for use in the metropolitan area. In this study, the site improvements with cyclic torsional shear compaction is a new construction method. The new method is no noise and no vibration, and the structure is simple. The purpose of the study is to investigate in different parameters the settlement and relative density due to cyclic torsional shear compaction
1.2 Research Outline
This research utilizes the NCTU model wall facility and Cyclic Torsional Shear Compaction Device to investigate the relative density and settlement against Disc shearing test. The Soil Improvement and experimental findings associated with cyclic torsional shear compaction are summarized in Chapter 2. Details of the NCTU non-yielding soil bin used for the experiments are discussed in Chapter 3. Design and construction of cyclic torsional shear compaction device are discussed in Chapter 4. Test results regarding the characteristics of backfill and soil density control are introduced in Chapter 5. The description of testing procedure are introduced in Chapter 6.
To investigate the relative density and settlement induced by cyclic torsional shear compaction, the backfill was prepared by air-pluviated method and cyclic torsional shear compaction method. A cyclic torsional shear compaction device was employed to density the cohesionless fill. Experimental results of the relative density and settlement due to cyclic torsional shear compaction are reported in Chapter 7.
1.3 Organization of Thesis
This paper is divided into the following parts:
1. Review of past investigations regarding cyclic torsional shear compaction of cohesionless soils. (Chapter 2)
2. Description of the National Chiao Tung University non-yielding soil bin. (Chapter 3)
3. Design and construction of cyclic torsional shear compactor. (Chapter 4) 4. Backfill and interface characteristics including soil density control. (Chapter
5)
6. Experimental results of soil surface settlement and distribution of relative density in the compacted soil layer due to cyclic torsional shear compaction. (Chapter 7)
Chapter 2
Literature Review
Das (2010) defined that the soil at a construction site may not always be totally suitable for supporting structures such as buildings, bridges, highways, and dams. For example, in granular soil deposits, the in situ soil may be very loose and indicate a large elastic settlement. In such a case, the soil needs to be densified to increase its unit weight and thus its shear strength.
Sometimes the top layers of soil are undesirable and must be removed and replaced with better soil on which the structural foundation can be built. The soil used as fill should be well compacted to sustain the desired structural load. Compacted fills may also be required in low-lying areas to raise the ground elevation for construction of the foundation.
Soft saturated clay layers are often encountered at shallow depths below foundations. Depending on the structural load and the depth of the layers, unusually large consolidation settlement may occur. Special soil-improvement techniques are required to minimize settlement.
Various techniques are used to reduce the settlement of structures, to improve the shear strength of soil and thus increase the bearing capacity of shallow foundations, to increase the factor of safety against possible slope failure of embankments and earth dams, and to reduce the shrinkage and swelling of soils.
2.1 Soil Improvement Method
Kramer (1996) defined the common soil improvement techniques to mitigate
seismic hazards, Soil Improvement Method is divided into four categories including densification techniques (vibrofloatation, vibro rod, dynamic compaction, blasting, and compaction grouting), reinforcement techniques (stone columns, compaction piles, and drilled inclusions), grouting and mixing techniques (permeation grouting, intrusion grouting, soil mixing, and jet grouting), and drainage techniques.
2.1.1 Densification Techniques
Fig. 2.1 shows two of the many possible ways that a system of equal-sized spheres can be packed. The dense packings represent the densest possible state for such a system. Looser systems than the simple cubic packing can be obtained by carefully constructing arches within the packing, but the simple cubic packing is the loosest of the stable arrangements.
2.1.2 Soil Densification with Vibratory Compactor
Whitman and D’Appolonia (1969) proposed the vibratory rollers are particularly
useful for compacting granular soils. Fig. 2.2 shows the nature of compaction of a dune sand achieved by a vibratory roller after five passes. The low unit weight that remains in the uppermost zone is due to vibration and lack of confinement in sand. Fig. 2.3 shows the compacted unit-weight profiles for 8-ft lifts of the same dune sand for 2, 5, 15, and 45 roller passes. For field compaction work, the specification requires that the granular soil be compacted to a certain minimum relative density at all depth. Determination of the height of each lift depends on the type of roller and the economic number of passes. The method for determination of the lift height is shown
in Fig. 2.4.
2.2 Cyclic Simple Shear Test
The cyclic simple shear test is a convenient method for determining the shear
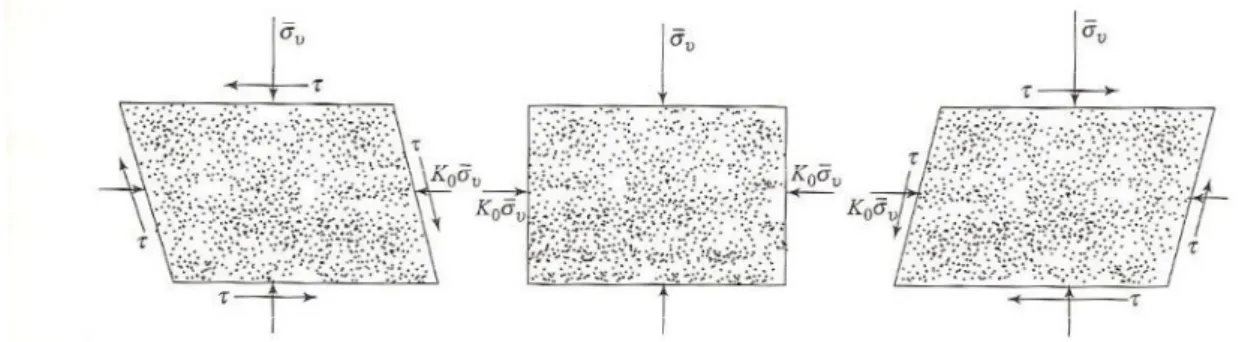
modulus and damping ratio of soils. It is also a convenient device for studying the liquefaction parameters of saturated cohesion less soils. Airey and Wood (1987) showed the NGI cyclic simple shear apparatus (Fig. 2.5). In the cyclic simple shear test, a soil specimen, usually 20-30 mm high with a diameter of 60-80 mm, is
subjected to a vertical effective stress and a cyclic shear stress τv cyc, as shown in
Fig. 2.6. The horizontal load necessary to deform the specimen is measured by the horizontal load cell, and the shear deformation of the specimen is measured by the linear variable differential transformer.
2.2.1 Study of Youd
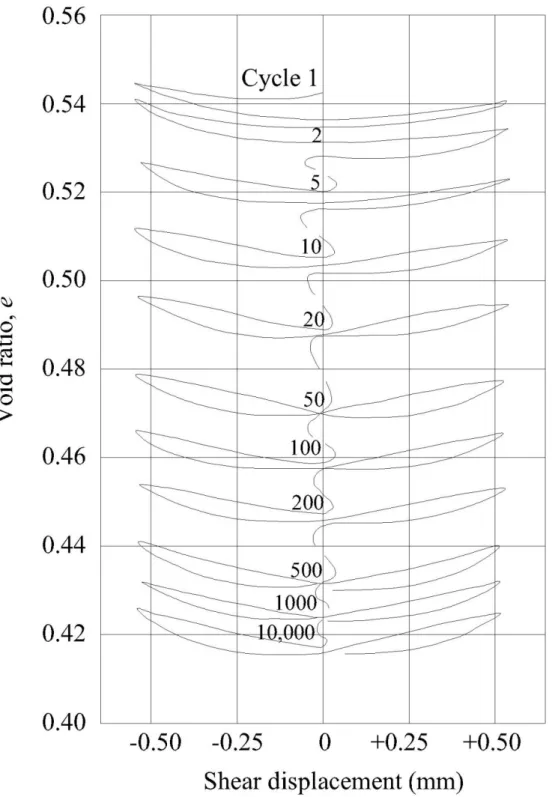
Youd (1972) reported the experimental results regarding the void-ratio reduction of sand due to cyclic simple shearing. Fig. 2.7 shows the gradual densification of sand by repeated back and forth straining in a simple shear test. For this case drainage from the soil occurs freely. Each cycle of straining reduces the void ratio of the soil by a certain amount, although at a decreasing rate. Decrease in volume of the sand, as shown in Fig. 2.7, can take place only if drainage occurs freely. In the figure, after 10000 cycles, the void ratio of sand was reduced from 0.54 to 0.42. It is obvious in the figure that cyclic shearing is an effect measure to densify the cohesion less soil.
2.2.2 Study of Hsu and Vucetic
sands subjected to several cycles of cyclic shear strain amplitudes γc. If the cyclic
shear strain amplitudesγc1 are small, smaller than a certain threshold value called the
volumetric cyclic threshold shear strain γtv (γc1<γtv) , their volume will not
change. Such cyclic behavior is depicted schematically in Fig. 2.8. In the figure the results of three cyclic strain-controlled direct simple shear (DSS) tests conducted on dry or partially saturated specimens are sketched. The variations of shear strain γ
over time t are presented in Fig. 2.8(a). The resulting variations of vertical strain εv
are presented in Fig. 2.8(b). The relationship betweenγc , the permanent cyclic
vertical strainεvc, and the number of cycles N, is presented in Fig. 2.8(c). The strain
εvc in Fig. 2.8(c) is taken asεv at the end of cycle N, and in this paper it is also
called the cyclic settlement strain.
It can be seen in Fig. 2.8(c) how below certainγc =γtv the soil does not settle
(εvc = 0), while above it, it settles significantly (εvc > 0). Accordingly, the amplitude
γtv represents the boundary between two fundamentally different types of volume
change behavior. Belowγtv , the soil particles are not displaced with respect to each
other and the soil’s mineral skeleton and volume remain practically unchanged during
cycling loading. When the soil is subjected toγc >γtv , the particles are displaced
with respect to each other irreversibly, resulting in permanent changes of the soil’s volume and microstructure. It is clear in Fig. 2.8 that the cyclic shearing is an effective method to reduce the vertical strain of soil, and to densify the soil mass.
2.3 Cyclic Torsional Simple Shear Test
Fig. 2.9 shows the cyclic torsional simple shear device. In this device a hollow, cylindrical specimen 71.1 mm in outside diameter, 50.8 mm in inside diameter, and 142.2 mm in height, can be subjected to independent variations of axial stress, inner
and outer confining pressure, and torsional shear stress or strain. Thus the device closely simulates the ideal in situ condition and enable us to apply a known value of the lateral confining stress.
Cyclic as well as static torsional shear stress can be applied by MTS closed-loop servo-hydraulic linear actuator by means of a torque loading rod, ball bearing spline, and axial loading piston. The movement of the MTS actuator is corrected by feedback signals either from the torque transducer for cyclic stress controlled tests, or from the rotational LVDT for cyclic strain controlled tests. Therefore, the specimen is subjected to the programmed cyclic motion by the MTS commanding unit without any effect of the piston friction and torsional distortion of the loading piston and transducers.
2.3.1 Study of Ishibashi et al.
Ishibashi et al. (1985) studied the volume change of a hollow cylindrical Ottawa
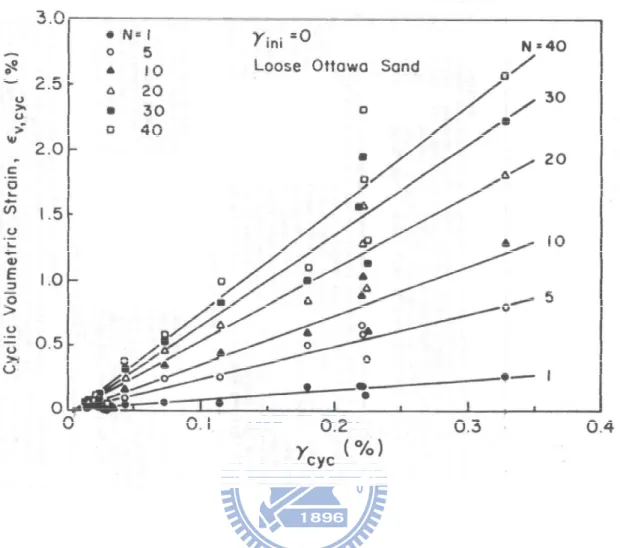
sand specimen subjected to cyclic torsional shearing in drained conditions. The experiments were conducted under uniform cyclic shear strains and the following conclusions was drawn. In Fig. 2.10, relationships between the cyclic volumetric
strain εv, cyc and the uniform cyclic shear strainγcyc for a given number of cycle is
nearly linear. It is clear in Fig. 2.7 that the volume reduction of the soil specimen is
significantly influenced by the cyclic shear strain load γcyc and the number of cyclic
2.4 Soil Densification with Cyclic Torsional Shear
Compactor
2.4.1 Study of Yang
Yang (2002) used the disc-shearing instrument at Chung-Yuan University to study the soil settlement due to cyclic torsional shearing. The diameter of the shearing disc was 98 m. The radius of the cylindrical sandy specimen was 100 mm, and the height of the specimen was 105 mm. The cyclic shear tests were carried out with initial relative densities from 30 % to 50 %, normal stresses from 7 kPa to 150 kPa, and water contents from 0 % to 10 %. One-way and cyclic shear stresses were applied on Mai Liao sand, Vietnam sand, and Ottawa sand.
Fig. 2.11 shows the relative density increased with increasing normal stress and decreasing water content. Fig. 2.12 shows the relative density increase due to cyclic shearing was about twice the relative density increase due to one-way shearing.
2.4.2 Study of Ren
Ren (2006) studied the effects of soil densification due to cyclic torsional shearing. The diameter of the sandy specimen was 200 mm and the height was 105 mm. The diameter of the shear disc was 198 mm. Mailiao sand, Ottawa sand and Vietnam sand specimens were tested with an initial relative density of 30 %. Normal stresses of 20 kPa, 60 kPa and 100 kPa, and shear angle 10˚, 20˚, 30˚, 60˚, 90˚.
Fig. 2.13 showed the relative density of sand increased with increasing number of
cyclic shear stress application N. The first 6 cycles ofτcyc application was most
shallow depth. Less Dr increment due to the cyclic shear stress was observed at a
deeper depth.
2.4.3 Study of Huang
To reduce the boundary effects due to a small soil tank, Huang (2008) used a 600 mm-diameter, 150 mm-high soil bin. The diameter of the shearing disc was 200 mm, and the (tank diameter)/ (disc diameter) ratio was 3.0.
To include two different grain characteristics, Mailiao sand and Ottawa sand were selected as soil specimen. The initial relative density of the soil sample before shearing was 50 %. The applied vertical normal stress varied 10 to 90 kPa, the cyclic shearing angle varied from 5∘to 45∘. Fig. 2.15 indicated, for both Mailiao and Ottawa sand, the relative density of sand increased with increasing normal stress σ.
2.5 Assessment of Relative Density
ASTM Test Designation D-4253 (2007) provide a procedure for determining the minimum and maximum dry unit weights of granular soils. These unit weights can be used to determine the relative density of soil compacted in the field. The term relative density is commonly used to indicate the in situ denseness or looseness of a granular soil. Relative density is defined as
( 2.1 )
Where e = in situ void ratio of the soil, emax = void ratio of the soil in the loosest state,
emin = void ratio of the soil in the densest state.
Das (2010) reported that the value of Dr may vary from a minimum of 0 % for very
describe the granular soil deposits according to their relative densities. In-place soils seldom have relative densities less than 20 to 30 %. Compacting a granular soil to a relative density greater than about 85 % is difficult. Lambe and Whitman (1969)
reported that the value of Dr was 65 to 85 % for dense soils as shown in Table. 2.1.
NAVFAC DM-7 (1982) reported the relative density was 70 to 75 % can be obtained by proper compaction procedures.
Chapter 3
Experimental Apparatus
To investigate the effects of cyclic torsional shear compaction on the relative density of in a cohesionless soil mass, the soil bin at National Chiao Tung University (NCTU) was used. This chapter introduced the soil bin. All soil improvement experiments described in this their were conducted in the soil bin of the NCTU non-yielding model retaining wall facility.
3.1 Soil Bin
The model wall shown in Fig. 3.1 is 1,500 mm-wide, 1,600 mm-high, and 45
mm-thick. To achieve an at-rest condition, the wall material should be nearly rigid. It is hoped that the deformation of the model wall could be neglected when the soil bin is filled with cohesionless soil. As indicated in Fig. 3.1, twenty-four 20 mm-thick steel columns were welded to the four sidewalls to reduce any lateral deformation during loading. In addition, twelve C-shaped steel beams were also welded horizontally around the box to further increase the stiffness of the box.
The soil bin is designed to minimize the lateral deflection of sidewalls during
testing. In Fig. 3.1, the soil bin was fabricated of steel plates with inside dimensions of 1,500 mm ×1,500 mm ×1,600 mm.
Assuming a 1,500 mm-thick cohesionless backfill with a unit weight = 17.1
kN/m3, and an internal friction angle = 41o was pluviated into the soil bin. A 45
material. The estimated deflection of the model wall would be only 1.22 × 10⁻³ mm.
Therefore, it can be concluded that the lateral movement of the model wall is negligible.
The end-wall and sidewalls of the soil bin were made of 35 mm-thick steel plates. Outside the steel walls, vertical steel columns and horizontal steel beams were welded to increase the stiffness of the end-wall and sidewalls. If the soil bin was filled with
dense sand, the estimated maximum deflection of the sidewall would be 1.86 × 10⁻³
mm. From a practical point of view, the deflection of the four walls around the soil bin can be neglected.
For this study, the thickness of the soil to the compacted in 0.6 m. The lateral earth pressure acting in the side wall would be much lows than that due to a 1.5 m- thick backfill. As a results, the deflection of the side walls of the soil bin can be achieved.
Chapter 4
Cyclic Torsional Shear Compactor
To enhance an effective soil compactor with less noise, and less vibration, a cyclic torsional shear compactor (CTSC) was developed at National Chiao Tung University (NCTU). Fig. 4.1 and 4.2 show the cyclic torsional shear compactor. The entire cyclic torsional shear compactor consists of four components, namely: (1) shearing disc; (2) normal loading discs; (3) torque loading frame; and (4) torque wrench. The design and construction of cyclic torsional shear compactor are discussed in this chapter. All of the experiments mentioned in this thesis were conducted with the NCTU cyclic torsional shear compactor, which is briefly introduced in the following sections.
4.1 Shearing Disc
Fig. 4.1 shows the disc diameter is 300 mm, and the steel disc is 15 mm-thick. To
efficiently carry the applied cyclic shear stress from the disc to the soil, 12 radial steel fins were carved on the bottom of the shearing disc as shown in Fig. 4.3. Fig. 4.4 shows, the steel radial fin was 2 mm-thick, 4 mm-wide and wedge angle of the fin was 90∘. During testing, the steel fin would bite into the soil mass. To provide adequate friction between the bottom of the disc and the soil, the bottom of the shearing disc is covered with a layer of anti-slip frictional material called SAFETY WALK (3M). The SAFETY WALK was attached to the disc bottom on the fan-shaped areas between the steel fins as shown in Fig. 4.5.
4.2 Normal Loading Discs
For the compaction of cohesion less soil in the field, Duncan et al. (1991)
summarized the dynamic total force due to five different types of soil compactor. For vibratory-plate soil compactors, assuming the contact pressure between the plate and soil was uniform, the total (static + dynamic) cyclic pressure applied to the soil
surface varied from 32.4 to 101.0 kN/m2. For rammer-plate soil compactors, the total
pressure applied varies from 72.2 to 175.6 kN/m2. Several small hand tampers used in
the field are illustrated in Fig. 4.6. The mass of the hand tampers varies from 50 kg to 80 kg. Assuming the mass of the hand-operated compactor is 66 kg, and the radius of the compaction disc is 0.36 m. The static normal load acting on the soil surface would
be 9.24 kN/m2, if the contact pressure between the plate and soil was uniform. For this
study, the normal pressure of 9.24 kPa was used throughout the investigation.
Table 4.1 shows the dimension and mass of the normal loading discs, which is made of iron. As shown in Fig. 4.7, the outside-diameter normal loading discs is 290 mm, the diameter of the screw rod hole is 21.6 mm, the diameter of the torque shaft hold is 43 mm, and the diameter of the hoist screw hole is 10.25 mm. Without any normal loading disc, the mass of the CTSC frame is 24.3 kg. Adding 2 pieces of 19.80 kg and 2 pieces of 1.05 kg loading discs, the total mass of the entire CTCS is 66.0 kg. It should be mentioned that this thesis is intended to report on the preliminary experimental data obtained from a light-weight cyclic torsional shear compactor.
4.3 Torque Loading Frame
Fig. 4.8 and 4.9 show the dimensions of the torque loading frame at the top of the
torsional shear device. The hoist ring was placed on top of the frame so that torsional shear compactor be lifted and lowered by the overhead crane in the laboratory. Two
hexagon caps were fixed on the arms of the torque frame, which enable the torque wrench to be hooked up to the torque frame. The applied torque was transmitted from the torque wrench, to the torque frame, then to the torque shaft and shear disc as illustrated in Fig. 4.1.
4.4 Torque Wrench
Fig. 4.10 shows, the torque wrenches are 600, 430, and 128 mm long. Fig. 4.10a
shows the torque wrench made of stainless steel. During testing, proper wrench length was selected so that no collision between the torque wrench with the sidewall of the soil bin would occur. The torque wrench was attached to the torque loading frame to induce torsional shear on the loose fill.
The digital torque wrench shown in Fig. 4.11 and 4.12 was used to measure torque applied to the soil. The digital torque wrench has a digital torque value readout. Accuracy in the clockwise direction was +/- 1%, and the accuracy in the counterclockwise direction was +/- 2%. Readout units included N-m, ft-lb, in-lb and kg-cm. The digital torque wrench made by OLY SCIENTIFIC Equipment Ltd. (model 921/200E) was 530 mm. The maximum operation range is 200 N-m. The square drive is 1/2 inch x 1/2 inch.
Chapter 5
Backfill and Interface Characteristics
The characteristics of the backfill, need for soil improvement experiment are introduced in this chapter. The s friction acting between the backfill and lubricated side wall is discussed. The measurement and control of soil density distribution in the backfill are also introduced.
5.1 Backfill Properties
Air-dry Ottawa sand (ASTM C-778) was used throughout this investigation.
Physical properties of the soil include Gs= 2.65, emax= 0.76, emin= 0.50, D60= 0.315
mm, and D10= 0.213 mm. Grain-size distribution of the backfill is shown in Fig. 5.1.
Major factors considered in choosing Ottawa sand as the backfill material are summarized as follows.
1. Its round shape, which avoids the effect of angularity of soil grains.
2. Its uniform distribution of grain size (coefficient of uniformity Cu = 1.5), which
avoids the effects due to soil gradation.
3. High rigidity of solid grains, which reduces possible disintegration of soil particles under loading.
4. Its high permeability, which allows fast drainage and therefore reduces water pressure behind the wall.
5.2 Lubricated Side-wall Friction
To simulate the field condition of a infinite half space for the compaction constitute, the shear stress between the backfill and the side walls should be minimized to nearly frictionless. To reduce the friction between side wall and backfill, a lubrication layer fabricated with plastic sheets was furnished for all experiments. Two types of plastic sheeting, one thick and two thin plastic sheets, were adopted to reduce the interface friction. All plastic sheets were hung vertically on the side walls before the backfill was deposited as shown in Fig. 5.2.
In this study, two thin (0.009 mm-thick) and one thick (0.152 mm-thick) plastic sheets were adopted for the soil improvement experiments. Fig. 5.3. shows the
variation of side-wall friction angle sw as a function of the normal stress n for the
plastic sheet method (1 thick + 2 thin sheeting) used in this study. The measured side-wall friction angle with this method is about 7.5°. For all experiments in this paper, the lubrication layers were wall applied on four side walls as indicated in Fig. 5.2.
5.3 Control of Soil Density
5.3.1 Air-Pluviated Loose Ottawa Sand
To achieve a uniform soil density in the backfill, Ottawa sand was deposited by air-pluviation method into the soil bin. The air-pluviation method had been widely used for a long period of time to reconstitute laboratory sand specimens. Rad and Tumay (1987) reported that pluviation is the method that provides reasonably homogeneous specimens with desired relative density. Lo Presti et al. (1992) reported
that the pluviation method could be performed for greater specimens in less time.
Das (2010) suggested that, for granular soil deposits, the relative density Dr of
15~50 %, is defined as loose, Dr = 50~70 % is defined as medium, and Dr = 70~85 %
is defined as dense. Ho (1999) established the relationship among slot opening, drop height, and density as shown in Fig. 5.4. To achieve a loose backfill, Chen (2003) adopted the drop height of 1 m and hopper slot opening of 15 mm. In this study, the drop height of 1.0 m and the hopper slot-opening of 15 mm were also selected to achieve the loose backfill. Fig. 5.5 shows the soil hopper let the sand flow through a calibrated slot opening at the lower end. A picture of the soil pluviating processes is shown in Fig. 5.6.
5.3.2 Uniformity of Soil Density
To observe the distribution of soil density in the soil bin, the soil density cups were made. The soil density control cup made of acrylic is illustrated in Fig. 5.7. The solid circular cup wall was only 10 mm-high, so that the shear definition and volume reduction could occur in the cup during testing. A picture of the soil density cup is shown in Fig. 5.8. During the preparation of the 0.6 m thick soil specimen, density cups were buried in the soil mass at different elevations and different locations in the backfill as shown in Fig. 5.9 and Fig. 5.10. After the loose soil had been filled up to 0.6 m from the bottom of the soil bin by air-pluviation, soil density cups were dug out from the soil mass carefully. Fig. 5.11 shows the mass of the cup and soil in the cap was measured with an electrical scale.
For a 0.6 m thick air-pluviated Ottawa sand layer, the distribution of soil density with depth is shown in Fig. 5.12. For the air-pluviated loose sand, the mean unit
deviation of 2.3%. Das (2010) suggested that for the granular soil deposit with a
relative density 15 % Dr 50 % is defined as loose sand. The relative density
Chapter 6
Testing Procedure
The procedure to conduct the cyclic torsional shear tests are introduced in this chapter. The testing procedure can be divided into three parts: (1) specimen preparation; (2) application of vertical static load; and (3) application of cyclic torsional shear. These parts will be introduced in the following sections with pictures. The “plastic-sheets” lubrication layers were hung on the sidewall of soil bin before testing.
6.1 Specimen Preparation
Fig. 6.1 shows air-dry Ottawa sand was placed in the soil storage. Fig. 6.2 shows sand was shoveled from the soil storage to the sand hopper, and the mass of the fill was measured with an electrical scale. Fig. 6.3 shows the sand hopper was lifted by overhead crane in the laboratory. Fig. 6.4 shows Ottawa sand was deposited by air-pluviation method into the soil bin. The drop height was controlled to be 1.0 m and the hopper slot-opening of 15 mm were selected to achieve the loose backfill, Fig. 6.5 (a) and (b) show portable hanging ladders were placed on top of the sidewalls, and a bridge board was placed between the ladders. Throughout the test, the operator will stay on the bridge board to avoid any unexpected surcharge on the soil specimen.
Leveling of the soil surface by the graduate student with a brush is shown in Fig. 6.6. Placement of a soil density cup on the soil surface is shown in Fig. 6.7. Fig. 6.8 shows how to check the density cup horizontal with a bubble level. Fig. 6.9 shows
density cups were buried in the soil mass at different elevations in the fill. The soil pulviation and density cup placement operations were repeated unit a backfill thickness T=0.6 m was reached.
Fig. 6.10 shows how to measure the fill surface location before loading. In the figure, a laser distance meter (Leica D3a) was placed between 2 L-shaped steel beams. The distance between the meter (top of sidewall) and the light dot (top of fill) in Fig. 6.11 was measured by the distance meter. After compaction, the soil surface will settle, and the distance between the light dot and the meter will increase.
6.2 Application of Vertical Static Load
The procedure to apply the vertical static load on top of the air-pluviated loose sand is introduced. The cyclic torsional shear compactor (Fig. 4.2) used to apply static load has a mass of (66 kg) and circular footing diameter of 0.3 m. Fig. 6.12 illustrates the grid points for the circular vertical load application.
Fig. 6.13 shows the CTSC was hoisted with overhead crane into the soil bin. Fig. 6.14 shows the vertical static load was applied on the loose sand with either 5x5 or 4x4 formations. Fig. 6.15 shows the circular static vertical load was applied on the surface of fill with the 5x5 loading formation (Fig. 6.14 (a)). To iron the differential settlement on the soil surface, the static vertical load was applied once more with the 4x4 loading formation (Fig. 6.14 (b)). Fig. 6.16 shows, the laser distance meter was used to measure the location of soil surface after the application of vertical static load.
6.3 Application of Cyclic Torsional Shear
In this study, the cyclic torsional shear was applied on the soil surface from +5∘to -5∘. Fig. 6.17 (a) and (b) show a light dot from the laser distance meter on the
angle steel bar was used as a fixed point to the soil surface. Fig. 6.18 shows the cyclic torsional shear was applied by the operator on the loose fill to increase its density. In Fig. 6.19, 6.20 and 6.21, with the guidance of the fixed light dot, the circular disc shears the soil from 0∘to +5∘and -5∘. The application of cyclic torsional shear to loose sand is shown in Fig. 6.22 (a) and (b).
For the test for N=10, the torsional shear was first applied on the 4x4 loading formation for the first 5 cycles is shown in Fig. 6.23. To prevent disc penetration due to continuous shearing at the same crater, the shearing was moved to the 5x5 formation for N = 6 to 10 is shown in Fig. 6.24. Fig. 6.25 shows the soil density cup was carefully dug out of compacted soil mass. Fig. 6.26 (a) to (d) show the density cup with a spatula. Fig. 6.27 shows the brush away soil particles from base plate of density cup. Soil mass in the cup was measured with an electrical scale and the density of the compacted soil determined.
Chapter 7
Test Results
This chapter reports experimental results regarding soil densification due to static load and cyclic torsional shearing. The cyclic torque T and shearing applied on the soil surface was measured and reported. Experiments were conducted on the surface of a 0.6 m-thick soil lift. The vertical static load applied was 9.24 kPa. The settlement and relative density distribution of the soil layer due to the static load and cyclic torsional shear were measured. The loading frequency f was 0.4 Hertz, the disc
rotation angle varied between +5∘and -5∘, and the number of loading cycle N
varied form 1 to 40. To obtain a soil mass with a relative density greater than 70 %, experiments were conducted to soil fill with four 0.15 m-thick lifts. Each lift was compacted with the cyclic torsional compactor with q = 9.24 kPa, f = 0.4 Hertz, = +
5∘, and N = 20.
7.1 Applied Cyclic Torsional Shearing
Fig. 7.1 showed the cyclic torque applied on the soil surface was measured with
a digital torque meter. For the disc rotation angle changing between +5∘and -5∘,
the torque measured at N = 1, 2, 10, and 20 was shown in Fig. 7.2, 7.3, 7.4 and 7.5, respectively. In Fig. 7.2, for N = 1 the applied torque varied between 48.6 to -44.2 N-m. In Fig. 7.5, for N = 20 the applied torque varied between 50.2 to -56.0. Fig. 7.6 showed the applied torque T as a function of number of cycle N. Test results indicted that the applied torque increased slowly with increasing number of cycle. On the
average, From N = 1 to 20 the applied torque increased from 47.4 to 51.85 N-m. The measured torque increased about 9.4 %.
Fig. 7.7 showed the how to determine the maximum torsional shear stress max at
the edge of the shearing disc due to the applied torque. A linear distribution of shear stress from the center to the edge of the disc was assumed. Fig. 7.8 shows the maximum shear stress as a function of N. Test results indicted that maximum shear stress increased slowly with increasing N value. On the average, From N = 1 to 20 the maximum shear stress increased from 8.94 to 9.78 kPa. The applied shear stress increased about 9.4 %. With increasing cycles of shear stress application, the soil density of compacted soil increased, therefore its stiffness and shear strength increased.
7.2 Compaction of a 0.6 m-thick Lift
In the experiments, the surface of a 0.6 m-thick single soil lift was compacted with the static vertical load (dead-load of the compactor) and cyclic torsional shearing. Effects of soil densification were indicated with the surface settlement and relative density change of the compacted soil fill.
7.2.1 Settlement Due to Static Vertical Load
The surface settlement of the 0.6 m-thick soil lift due the weight of the compactor was reported. The initial relative density of the loose fill was 34.5 %. The applied normal stress was = 9.24 kPa. To achieve a uniform settlement, the vertical static loading was first applied on the surface with the 5×5 formation (see Fig. 6.14), and then applied on the 4×4 formation. Fig. 7.9 showed the settlement measurement was carried out with the laser distance meter. The surface settlement measured at the
centers of loading disc was as shown in Fig. 7.10. For the 600 mm-thick soil lift, the minimum and maximum settlements due to = 9.24 kPa were 12.8 and 17.5 mm. The average settlement was 14.9 mm, which was about 2.5% of the soil thickness. It is obvious that static vertical loading is an effective method to compact the loose fill. To limit the scope of this thesis, only = 9.24 kPa was used throughout this study. It should be mentioned that the vertical strain distribution in the soil lift was not uniform. The vertical stress transmitted to a deeper location would be less, therefore the density increase at a deeper location was expected to be less significant.
7.2.2 Settlement Due to Cyclic Torsional Shearing
After the application of the static loading, cyclic torsional shearing was applied on the surface of the soil specimen. The shearing was applied on the circular areas of the 4×4 formation for N = 1 to 5, 11 to 20, and 31 to 40. The shearing was applied on the 5×5 formation for N = 6 to 10, and 21 to 30. Fig. 7.11 showed the surface settlements after the first cycle of shear stress application. The measured surface settlement varied from 17.5 to 20.8 mm, and the average value was 19.2 mm.
Fig. 7.17 showed the surface settlements after 40 cycles of shear stress application. The measured surface settlement varied from 32.4 to 35.8 mm, and the average value was 33.8 mm. The measured settlement values were relative uniform.
Fig. 7.18 showed the soil surface settlements after 1, 2, 5, 10, 20, 30 and 40 cycles of cyclic torsional shearing. It was obvious in the figure that the soil settlement increased with increasing number of cycles of torsional shearing. In the figure, the average settlement due to the static vertical loading was about 14.9 mm. After 40 cycles of torque application, the average settlement was 33.8 mm. The extra settlement due to the dynamic shearing cycles was about 18.9 mm, which was greater
than the settlement due to the static vertical load. It was obvious that cyclic the torsional shearing is an effective method to compact loose cohesionless soil.
Fig. 7.19 showed the variation of surface settlement with the number of cycle N. In the first 2 cycles of torque application, surface settlement increased significantly. However, after N = 20, the major part of settlement has accomplished, soil particles were sheared and reached a densely-packed condition. Therefore, it was difficult to increase the settlement any further with more cyclic shear application.
7.2.3 Relative Density Change Due to Static Vertical Load
To investigate the density distribution in the compacted soil, density cups were buried in the soil mass at different elevations and locations in the 0.6 m-thick soil lift as shown in Fig. 7.20 and Fig. 7.21. For the un-compacted loose soil, the average relative density was about 34.5 %. Fig. 7.22 showed, after applying the static normal stress 9.24 kPa, the distribution of relative density increased. This static normal loading represents the weight of the cyclic torsional shear compactor. At the depths z = 50, 100 and 150 mm, the relative density increased from 34.5 to 52.6, 47.8 and 40.5%, respectively. The segmental line was obtained by connecting data points closest to the average value for the depth. It was apparent that the effect of density increase was obvious in the top 150 mm (radius of the circular loading disc R) of fill. However, below the depth of 150 mm, the density increase due to the static surface loading was less obvious.
7.2.4 Relative Density Change Due to Cyclic Torsional Shearing
Fig. 7.23 to Fig. 7.29 showed the distribution of relative density due to cyclic torsional shearing from N=1 to 40. In Fig. 7.23 for N = 1, at the depth of 50, 100 and150 mm, the relative density increased to 61.6, 61.2 and 54.0, respectively. Below the depth of 150 mm (disc radius R), the density increase was less significant.
In Fig. 7.27 for N = 20, at the depth of 50, 100 and 150 mm, the relative density increased to 87.1, 83.5 and 71.3, respectively. Below the depth of 150 mm (disc radius R), the measured relative density was less than 70 %. It was apparent in the figure that, for = 9.24 kPa, = + 5∘, and N = 20, the cyclic torsional shear compaction could effectively increase the relative density up to 70 %. However, the soil improvement was effective only for the top 150 mm (disc radius) of soil.
Fig. 7.30 showed the relative density distributions of the compacted specimen for N = 1 , 2, 5, 10, 20 and 40. Test results showed that the density distribution increased with increasing number of cycles of torsional shearing. The US Navy design manual (NAVFAC DM-7.2) described that for coarse-grained, granular well-graded soils with less than 4 percent passing No. 200 sieve, 70 to 75 relative density can be obtained by
proper compaction procedures. In this study, Dr = 70 % is selected as the minimum
required density. In Fig. 7.30, if N = 20 is selected to save the compaction effort, the corresponding effective-depth of compaction would be 0.15 m. It should be mentioned that the effective depth of compaction could be influenced by the applied normal stress , angle of disc rotation , and number of shearing cycle N. Further study should be carried out regarding these parameters.
7.3 Compaction of Four 0.15 m-thick Lifts
In the field, it is often necessary to compact the entire soil mass to a required minimum relative density. For this study, a 0.6 m-high dense fill was accomplished by compacting four 0.15 m-thick (effective depth of compaction) lifts on the surface with the cyclic torsional shear compactor. The applied vertical stress was 9.24 kPa and the
number of shearing cycle was 20. Fig. 7.31 showed soil density cups were buried at different elevations in Lift 1. The distribution of relative density in Lift 1 was shown in Fig. 7.23. The initial relative density of soil was 34.5%. After cyclic shear compaction, at the depth of 50 mm, 100 mm, and 150 mm, the average relative density was 82.5, 77.1 and 71.0 %, respectively. The relative density in the 0.15 m-thick lift 1 was successfully increased to above 70%.
Fig. 7.33 showed density cups were buried at different elevations in Lift 1 and 2. Each lift was compacted on the surface with the CTSC. The distribution of relative density in Lifts 1 and 2 after compaction was shown in Fig. 7.34. Fig. 7.35 showed density cups were buried at different elevations in Lifts 1 to 3. After compaction on the surface of each lift, the relative density distribution in Lifts 1 to 3 was shown in Fig. 7.36.
Fig. 7.37 showed soil density cups buried at different elevations in lifts 1 to 4. Cyclic torsional shearing was applied on the surface of each lift. The distribution of relative density in Lifts 1 to 4 was shown in Fig. 7.38. Test results revealed that the trend of pressure distribution in each 0.15 m-thick lift was similar. The average relative density achieved in each lift was greater than the required value of 70 %. The entire sandy fill had been successfully compacted to the required density The proposed cyclic torsional shear compaction appears to be an effective method for soil improvement.
The effective depth of compaction plays an important role in field earthwork. Compaction with a smooth-wheel vibratory roller can easily reach an effective depth of compaction of 0.3 m. Although the compaction with the cyclic torsional shear compactor is less noisy and induce less vibration, the effective depth of compaction of 0.15 m might double the number of lifts in the field. However, the laboratory experimental investigation shown in this thesis is only preliminary. The effective
depth of compaction in construction can be enlarged by properly adjusting the radius of the shearing disc R, the applied normal stress during construction.
Chapter 8
CONCLUSIONS
In this study, the surface settlement and relative density change in the sandy soil
due to the cyclic torsional shearing compaction were investigated. Based on the experiment results, the following conclusions were drawn.
1. Under the vertical static load kPa for the 0.6 m-thick soil lift, the
minimum and maximum settlements were 12.8 and 17.5 mm. The average settlement was 14.9 mm. The vertical normal loading is an effective method to increase soil density.
2. The density increase due to the static vertical load was obvious in the top 150
mm (radius of the circular loading disc R) of fill. Below the depth of 150 mm, the density increase due to the static surface loading was less obvious.
3. From shearing cycle no. 1 to no. 40, the torque measured at θ= +5∘increased
about 9.4 %. With increasing cycles of shear stress application, the density of compacted soil increased.
4. The measured surface settlements due to cyclic torsional shearing were fairly
uniform. The surface settlement increased with increasing cycles of torsional shearing.
5. After 40 cycles of cyclic torsional shearing, the extra settlement due to the
dynamic shearing cycles was about 18.9 mm, which was greater than the settlement due to the static vertical load kPa. It was obvious that cyclic the torsional shearing is an effective method to compact loose cohesionless soil.
6. In the first 2 cycles of cyclic torque application, surface settlement increased
significantly. However, after 20 cycles, soil particles reached a densely-packed condition, less surface settlement was observed.
7. After 20 cycles, the relative density of soil 150 mm below the surface was successfally increased to a value greater than 70 %. The cyclic torsional shear soil improvement was effective only for the top 150 mm (disc radius) of soil.
8. The relative density of soil increased with increasing number of cycles of
torsional shearing. After the first 20 cycles of shearing, the compaction effect became less significant.
9. For the compaction on four 0.15 m-thick lifts, the relative density achieved in
References
1. ASTM D4253-93 (2007). “Standard Test Methods for Maximum Index Density and Unit Weight of Soils Using a Vibratory Table,” Section four, Construction, Volume 04.08, Soil and Rock (I): D420-D5779 Annual Book of ASTM Standards, ASTM, Conshohocken, PA, USA.
2. Burgess, G. P. (1999). “Performance of Two Full-scale Model Geosynthetic Reinforced Segmental Retaining Walls,” MS thesis, Royal Military College of Canada, Kingston, Ontario, 207.
3. Chang, S. Y., (2000), “Effect of Backfill Density on Active Earth Pressure,” Master of Engineering Thesis, Dept. of of Civil Engineering, National Chiao Tung University, Hsinchu, Taiwan. Chen, T. J., (2003). “Earth Pressures Due to Vibratory Compaction.” Ph.D. Dissertation, National Chiao Tung University, Hsinchu, Taiwan.
4. Chen, T. J., (2003). “Earth Pressures Due to Vibratory Compaction.” Ph.D. Dissertation, National Chiao Tung University, Hsinchu, Taiwan.
5. Chen, T. J., and Fang, Y. S, (2008). “Earth Pressure Due to Vibratory Compaction”, Journal of Geotechnical and Geoenvironmental Engineering, ASCE, 134 (4), 1-8. 6. Das, B. M., (2011), “Principles of Soil Dynamics.”, 2nd Ed., Cengage Learning,
Stamford, CT, USA.
7. Das, B. M. (2011), “Principles of Foundation Engineering”, 7th Ed., Cengage Learning, Stamford, CT, USA.
8. Das, B. M., (2010), “Principles of Geotechnical Engineering.”, 7th Ed., Cengage Learning, Stamford, CT, USA.
9. Fang, Y. S., Chen, T. J., Holtz, R. D., and Lee, W. F., (2004). “Reduction of Boundary Friction in Model Tests”, Geotechnical Testing Journal, ASTM, 27(1), 1-10.
10. Ho, Y. C., (1999), “Effects of Backfill Compaction on Passive Earth Pressure,” Master of Engineering Thesis, National Chaio Tung University, Hsinchu, Taiwan.
11. Hsu, C. C., and Vucetic, M., (2004), “Volumetric Threshold Shear Strain for Cyclic Settlement,” Journal of Geotechnical and Geoenvironmental Engineering, ASCE, 130 (11), 58-70.
12. Huang, Y. X., (2008) “A Study on the Disc Shearing Behavior of Sand in a Mid-size Soil Tank,“ Master of Engineering Thesis, Chung Yuan Christian University, Chungli, Taiwan.
13. Ishibashi, I., and Sherif, M. A., (1974), “Soil Liquefaction by Torsional Simple Shear Device,” Journal of the Geotechnical Engineering Division, ASCE, 100 (8), 871-888.
14. Ishibashi, I., Kawamura, M., and Bhatia, S. K., (1985), “Effect of Initial Shearing on Cyclic Drained and Undrained Characteristics of Sand.” Geotechnical Engineering Report 85-2, School of Civil and Environmental Engineering, Cornell University, Ithaca, New York, USA.
15. Kramer, S. L., (1996), “Geotechnical Earthquake Engineering”, Prentice-Hall, Inc., Upper Saddle River, New Jersey.
16. Lo Presti, D. C. F., Pedroni, S., and Crippa, V. (1992). “Maximum Dry Density of Cohesionless Soils by Pluviation and by ASTM D 4253-83: A comparative study.” Geotechnical Testing Journal, ASTM, 15(2), 180-189.
17. McElroy, J. A. (1997). “Seismic Stability of Geosynthetic Reinforced Slopes: A shaking table study.” MS thesis, University of Washington, Seattle, 286.
18. Miura, K., Tsukada, Y., Tsubokawa, Y., Ishito, M., Nishimura, N., Ohtani, Y., and You, G. L., (2000), “Bearing capacity during earthquake of the spread footing reinforced with micropiles.” Proceedings, 12th World Conference on Earthquake Engineering, pp. 1-8.
19. Ren, F. Y., (2006) “A Study on the Influence of Type of Plate Shearing on the Relative Density of Loose Sand,“ Master of Engineering Thesis, Chung Yuan Christian University, Chungli, Taiwan.
21. Yang, C. T., (2002) “A Study on Plate Shear to Improve Relative Density of Sand,“ Master of Engineering Thesis, Chung Yuan Christian University, Chungli, Taiwan.
22. Youd, T. L., (1972), “Compaction of Sand by Repeated Straining,” Journal of the Soil Mechanics and Foundations Division, ASCE, 98 (7), 709-725.
23. Ducan, J. M., Williams, G. W., Shen, A. L., and Seed, R. B. (1991). “Estimation Earth Pressures Due to Compaction,“ Journal of Geotechnical Engineerimg, ASCE, 117 (12), 1833-1847.
Table 4.1. Characteristics of normal loading discs Thickness Disc ( mm )
37.5
20.0
10.0
3.0
2.0
1.0
Mass ( kg )19.80
9.60
4.80
1.55
1.05
0.50
Quantity Ordered4
3
1
2
3
4
Fig. 2.2. Unit weight vs. depth relation for vibratory roller compaction (after Whitman and D’Appolonia, 1969)
Fig. 2.3. Compacted unit weight profiles for 8-ft lift heights for 2, 5, 15, and 45 vibratory roller passes
Fig. 2.4. Approximate method for determining lift height required to achieve a minimum compacted relative density of 75% with five roller passes using data for a
large lift height
Fig. 2.7. Void ratio versus cyclic displacement for densification of a sand with successive cycles of shear (after Youd, 1972)
Fig. 2.8. Sketch of typical results of cyclic simple shear strain-controlled tests with definitions of volumetric cyclic threshold strain
Fig. 2.10. Variation of cyclic volumetric strain as a function of cyclic shear strain
Fig. 2.11. Change of relative density versus normal stress at various water content