國立交通大學
光電工程研究所
碩士論文
利用
Stencil-FSC 法抑制色分離
並達低功率之色序型液晶顯示器
Stencil-FSC Method for Color Breakup
Suppression and Low Power Consumption
in Field Sequential Color LCDs
研究生:魏景明
指導教授:黃乙白助理教授
利用Stencil-FSC法抑制色分離
並達低功率之色序型液晶顯示器
Stencil-FSC Method for Color Breakup
Suppression and Low Power Consumption
in Field Sequential Color LCDs
研究生:魏景明 Student :Ching-Ming Wei
指導教授:黃乙白 Advisor: Dr. Yi-Pai Huang
國立交通大學 電機學院
光電工程研究所
碩士論文
A Thesis
Submitted to Institute of Electro-Optical Engineering
College of Electrical and Computer Engineering
National Chiao Tung University
in Partial Fulfillment of the Requirements
for the Degree of Master
in
Electro-Optical Engineering
July 2008
Hsinchu, Taiwan, Republic of China
利用 Stencil-FSC 法抑制色分離
並達低功率之色序型液晶顯示器
碩士研究生:魏景明 指導教授:黃乙白 助理教授
國立交通大學
光電工程研究所
摘要
色序法顯色技術是將各色場畫面時序顯示,利用人眼視覺暫留之特性,經由 時間混色法即可得到一全彩畫面。此技術應用於液晶顯示器將可省去彩色濾光片 的使用,因此該顯示器可提升光效率,具備低功率消耗,高影像解析度,高色彩 飽和度,以及低成本的優點,深有發展為次世代顯示器之潛能。然而應用色序法 型顯示器存在一嚴重問題,色分離現象,此將影響影像品質,且使觀測者感到不 適。近年來,已有許多方法被提出來抑制色序法液晶顯示器之色分離現象,然而 這些方法仍面臨許多問題,如:液晶反應速度以及影像失真…等,因此,色序型 液晶顯示器遲遲未能成為當前的主流顯示技術。 基於以上論述,在此論文中,我們提出一新 Stencil-FSC 法來抑制色序法液 晶顯示器之色分離現象。此新色序法為一四色場色序法,跳脫傳統色序法只顯示 單色影像於各子畫面之限制,而顯示彩色畫面於子畫面中。利用第一個彩色色場 顯示大致畫面,再使用紅、綠、藍三色場來顯示影像細節。藉由 Stencil-FSC 法將可降低紅、綠、藍三色場之色彩以及亮度,因此色分離的現象將可有效被抑 制。此法在利用軟體模擬以及實際 32 吋場色序型液晶顯示器實體驗證後,不僅 色分離問題可被大幅改善,且其對比可提升至 5000:1,NTSC 值為 114%,且平均 功 率 消 耗 降 為 40W 。 ( 現 行 32"LED 背 光 液 晶 顯 示 器 平 均 功 率 消 耗 約 為 180W;32"CCFL 背光液晶顯示器平均功率消耗約為 105W)Stencil Field Sequential Color Method for
Color Breakup Suppression and Low Power
Consumption in Field Sequential Color LCDs
Master student:Ching- Ming Wei Advisor:Dr. Yi-Pai Huang
Department of Photonics & Institute of Electro-Optical Engineering
National Chiao Tung University
ABSTRACT
The color sequential technique is a kind of display mechanisms. The field images
with different colors light in time sequence, by human eyes integration, a colorful image can be generated by temporal color mixing. The technique utilizing on LCDs called Field Sequential Color –LCD (FSC-LCD) can remove the color filters in displays, so it has several advantages, such as low power consumption, feasibility of high resolution, high color saturation, and low cost. Therefore, the FSC display has high potential to be a next generation display system. However, the FSC-LCDs have a serious issue, Color breakup (CBU), and it will degrade the image quality and make viewers uncomfortable. In resent years, several methods have been proposed to suppress CBU; nevertheless, the methods have some issues, like image distortion and limitation of LC response time…etc. Therefore, the FSC-LCD has not become a commercial display yet.
In the thesis, a color sequence called Stencil Field Sequential Color (Stencil-FSC) method was proposed to suppress CBU. Stencil-FSC is composed by four fields in each frame. The concept of displaying single-color field images of conventional color sequence is modified, and a multi-color image is utilized in the Stencil-FSC method. The multi-color image is displayed in first multi-color field, and red, green, and blue fields were utilized to add color details. By the method, the color and luminance of red, green, and blue field are reduced, and it is helpful to suppress CBU. Simulation and demonstration on a 32” FSC-LCD have been implemented to verify the CBU suppression of the method. Moreover, the FSC-LCD achieved the contrast ratio of 5000:1, NTSC of 114%, and the average power consumption is only 44W (Conventional 32” CCFL-LCD is 105W, and 32” LED-LCD is 180W).
致謝
首先,我要感謝我的指導教授 黃乙白老師在這兩年來對於外語表達能力及 研究上細心及嚴厲的指導,並在生活上提供良好的研究環境以及傳授許多人生的 哲學,亦師亦友的關係,不僅幫助我順利完成此論文,也獲得許多寶貴的經驗及 建議。 還必須感謝芳正學長在各方面對我的指導及協助,讓我在實驗思維上以及做 事方式上有根本的進步。除此之外,均合學長的寶貴意見給予我很大的幫助。也 感謝鄭榮安、莊喬舜、鄭裕國、楊柏儒、許精益、Wallen等其他實驗室的學長們 給予珍貴的意見及生活上的協助。同時感謝國振、仁杰、明農、其霖、宛徵、建 良、凌嶢、勝昌等同學們在課業、研究、生活上的幫助。也感謝實驗室學弟妹, 育誠、宗緯、浩彣、致維、宜伶、靖堯、博文、俊賢、祐禎、拓江、高銘,讓實 驗室充滿愉悅的氣氛。 最後我要感謝女友宜如,在沮喪時給我鼓勵及支持,一同歡笑,一同學習, 陪我走過研究所這些日子。對於我的家人,感謝你們從小的栽培及照顧,讓我無 後顧之憂的專心於研究。最後將這分喜悅分享給每一個關心我的人。Table of Contents
Abstract (Chinese) ………i
Abstract (English) ………..ii
Acknowledgement ………..iii
Table of Contents ………..iv
Figure Captions ………….………..vi
List of Tables ……….…….……….x
Chapter 1 Introduction ...1
1.1 Field Sequential Color Liquid Crystal Displays (FSC-LCD) ...1
1.2 Phenomenon of Color Breakup (CBU)...4
1.3 Motivation and Objective ...5
1.4 Organization...6
Chapter 2 Color Breakup and Prior Solutions ...7
2.1 Mechanism of Color Breakup in Conventional FSC-LCDs ...7
2.1.1 Physiology of eye movements ...8
2.1.2 Static CBU and dynamic CBU ...10
2.2 Prior Works of CBU Suppression ...12
2.2.1 Field rate increasing...12
2.2.2 Multi-primary color fields ...13
2.2.3 Motion compensation ...14
2.3 CBU Evaluation Index: ΔE*ab...15
2.4 Summary ...21
Chapter 3 Stencil Field Sequential Color Method...22
3.1 Stencil Field Sequential Color Method...22
3.1.1 Concept ...22
3.1.2 Display module ...24
3.1.3 Algorithm ...25
3.2 Algorithm Optimization ...27
3.3 Summary ...32
Chapter 4 Experimental Demonstration...33
4.1 Approximation of Backlight Intensity Distribution ...33
4.2 Experimental Demonstration I-15Hz/Frame...37
4.3 Experimental Demonstration II-60Hz/frame ...39
4.4 Summary ...42
Chapter 5 Optimization of Color Breakup Suppression...44
5.1 Classification of Test Images ...44
5.1.1 Detail complexity...44
5.1.2 Color complexity ...46
5.2 Backlight Division and Light Spread Function ...48
5.2.1 Light spread function vs. Backlight division ...48
5.2.2 Optimization of backlight divisions...51
5.3 Optimization of Dimming Ratio ...52
5.4 Discussions ...56
5.5 Summary ...58
Chapter 6 Conclusions and Future work...59
6.1 Conclusions...59
6.2 Future Work ...61
Figure Captions
Fig. 1-1. Display mechanism of conventional LCDs. (a) Display structure, (b)
pixel arrangement, and (c) spatial color mixing ...3
Fig. 1-2. The component costs of 15”and 30” displays ...3
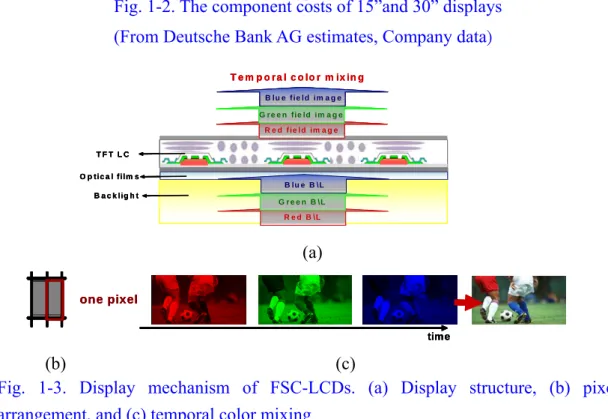
Fig. 1-3. Display mechanism of FSC-LCDs. (a) Display structure, (b) pixel arrangement, and (c) temporal color mixing...3
Fig. 1-4. Mechanism of color breakup...4
Fig. 2-1. Structure of human eye ...8
Fig. 2-2 (a) Perceived image, and (b) Saccade movement (black line) ...9
Fig. 2-3 Pursuit movement curve. If a target moves with a velocity faster than 90degree/sec, eye pursuit will not catch up. ...9
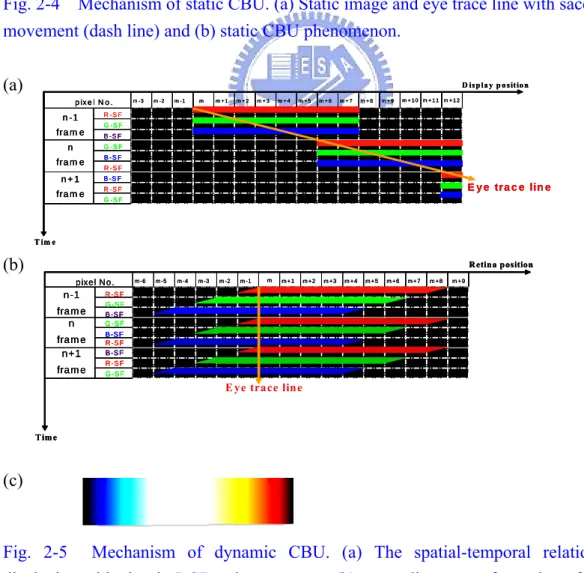
Fig. 2-4 Mechanism of static CBU. (a) Static image and eye trace line with saccade movement (dash line) and (b) static CBU phenomenon. ...11
Fig. 2-5 Mechanism of dynamic CBU. (a) The spatial-temporal relation of displaying white bar in RGB color sequence, (b) a coordinate transformation of (a) to make eye trace line to be a vertical line, and (c) dynamic CBU phenomenon...11
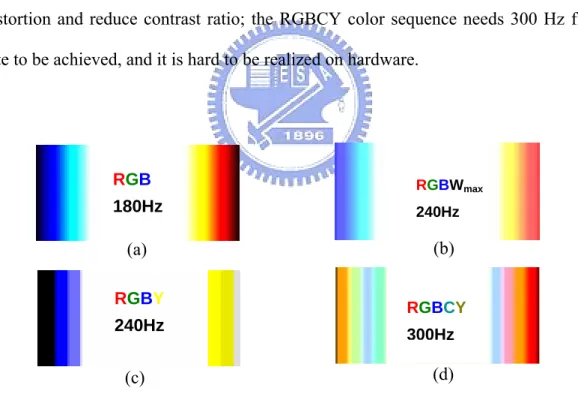
Fig. 2-6 CBU simulations of different color sequences. (a) RGB, (b) RGBWmax, (c) RGBY, and (d) RGBCY...13
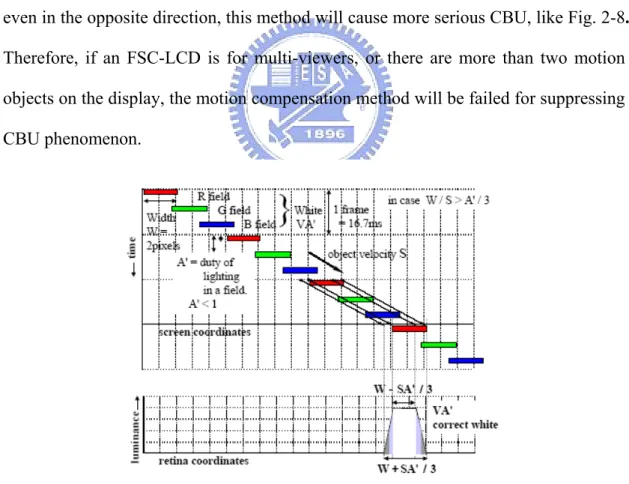
Fig. 2-7 Motion compensation method. CBU phenomenon with predictable eye movement...14
Fig. 2-8 Motion compensation method. CBU phenomenon with opposite eye movement...15
Fig. 2-9 The experimental setup of color matching ...17
Fig. 2-10 Curve of r, g, and b tristimulus values ...17
Fig. 2-11 Curve of x, y, and z tristimulus values ...18
Fig. 2-12 Color is determined by three components, light source (P), object reflection (R), and the tristimulus values (x, y, z)...18
Fig. 2-13 CIExyY chromaticity diagram ...20
Fig. 2-14 Experimental results of color difference in CIExyY chromaticity diagram ...20
Fig. 3-1 The flowchart of stencil method. (a) Put block of base image, (b) paint base color, (c) put blocks of detail parts with different colors and paint color, and (d) complete the painting. (From
http://www.wretch.cc/blog/Bbrother&article) ...23
Fig. 3-2 (a) Target image. The field images of (b) RGB color sequence and (c) Stencil-FSC method. ...23
Fig. 3-3 Locally controlled backlight technique. (a) Target image, (b) intensity locally controlled backlight, and (c) color locally controlled backlight. ...25
Fig. 3-4 The flowchart of locally controlled backlight technique ...25
Fig. 3-5 The algorithm of Stencil-FSC method ...26
Fig. 3-6 The field images of Stencil-FSC algorithm mentioned in last section...28
Fig. 3-7 The locally controlled backlight signal of (a) original algorithm and (b) algorithm with the backlight colorful method ...29
Fig. 3-8 The field images of Stencil-FSC algorithm with the backlight dimming method...29
Fig. 3-9 Convolution process. (a) Light spread function,(b)the locally controlled backlight signal, and (c) the convolution backlight...31
Fig. 3-10 Fourier transformation process. (a) The extended locally controlled backlight, (b) the backlight signal in frequency domain, (c) the Gaussian low-pass filter, and (d) The blurred image...31
Fig. 3-11 Ringing phenomenon. (a) Target image, (b) blurred image with ringing, and (c) blurred image without ringing. ...32
Fig. 4-1 Gaussian low-pass filter ...34
Fig. 4-2 (a) Target image. Blurry images by using FT process with (b) D0=0.01 and (c) D0=0.001...34
Fig. 4-3 Test images. (a) Soccer, (b) color balls, and (c) girl...35
Fig. 4-4 The relation between D0 and ΔE. When D0 is close to 0.0023, the minimum ΔE*ab can be gotten...36
Fig. 4-5 (a)Target images, (b) convolution backlights, and (c) FT blurry backlights with D0 =0.0023 of three test images...36
Fig. 4-6 The test image. (a) white image: Lily and (b) colorful image : Girl ...388
Fig. 4-7 The captured CBU image of Lily with (a) conventional RGB color sequence and (b) The Stencil-FSC method...38
Fig. 4-8 The captured CBU image of Gril with (a) conventional RGB color
sequence and (b) The Stencil-FSC method...38 Fig. 4-9 Test images of (a) Lily and (b) Sunflower and their field images...40 Fig. 4-10 The color locally controlled backlights of (a) Lily and (b) Sunflower ....41 Fig. 4-11 The Stencil-FSC images of (a) Lily and (b) Sunflower ...41 Fig. 4-12 The CBU image of Lily using (a) the Stencil-FSC method and (b) the
conventional RGB color sequence...41 Fig. 4-13 The CBU image of Sunflower using (a) the Stencil-FSC method and (b)
the conventional RGB color sequence...42 Fig. 5-1 (a) Target image, and (b) Edge image gotten by calculating image
gradient ...45 Fig. 5-2 (a) Image, Lily, with less detail complexity and the edge
summation=9437 ...46 Fig. 5-3 (a) Target image, (b) CIELAB color space divided into 20*20 regions,
and (c) probability distribution of color appearance...47 Fig. 5-4 (a) Image, Lily, with single color and the color entropy=0.88...47
Fig. 5-5 Relation between the number of backlight divisions and the D0 parameter
causing minimum CBU...50 Fig. 5-6 (a) Target image-Aborigine, (b) backlight signal with 2*4 division, (c)
backlight distribution with D0=0.001, and (d) backlight distribution with
D0=0.01 ...50
Fig. 5-7 (a) Backlight signal with 48*48 division, (c) backlight distribution with
D0=0.001, and (d) backlight distribution with D0=0.01...51
Fig. 5-8 Relation between the number of backlight divisions and ΔE caused by CBU ...52 Fig. 5-9 (a) Stencil-FSC field images without utilizing backlight colorful method
and (b) Stencil-FSC field images with dimming ratio=10% ...53 Fig. 5-10 Relation between the ΔE caused by CBU and dimming ratio...54 Fig. 5-11 Relations between distortion ratio and dimming ratio of nine test images
...55 Fig. 5-12 ΔE of CBU caused by RGB color sequence (blue bars) and ΔE of CBU
Fig. 5-13 CBU suppression of nine test images...57 Fig. 6-1 The concept of the Stencil-FSC three-field method. (a) Target image, (b)
first multi-color field of the Stencil-FSC method, (c) the remnant image, and (d) two multi-color-fields to display the remnant image...62 Fig. 6-2 Stencil-FSC three-field method...63 Fig. 6-3 (a) Target image, (b) the Stencil-FSC three-field image and the number
of backlight sub-regions equal 32*32, and (c) the Stencil-FSC three-field image with three fields and the number of backlight sub-regions equal
List of Tables
Table. 3-1The CBU and the distortion ratio (D) of image with different dimming ratio ...29 Table. 4-1 Schemes of the 32” FSC-LCD...39 Table. 4-2 The measured performance of CCFL-LCD, LED-LCD, and FSC-LCD
with the Stencil-FSC method ...42 Table. 5-1 Nine test images with different detail and color complexity ...48
Table. 5-2 ΔE caused by CBU with different division numbers and D0 parameters
Chapter 1
Introduction
Field Sequential Color (FSC) is a kind of the display techniques, and it can be utilized on LCD technology for power saving. In this chapter, FSC-LCD and its serious issue, Color Breakup (CBU), will be introduced, and the motivation and objective of the thesis will be given in the following. Final section is the organization of the thesis.
1.1 Field Sequential Color Liquid Crystal Displays (FSC-LCD)
Liquid crystal displays (LCDs) became more and more popular in the few decades because of its light weight, small volume, and no radiation emitting. The display mechanism of conventional LCDs can be explained by Fig. 1-1. At first, Full on white backlight (ex. Cold Cathode Fluorescent Lamps (CCFLs), white light LED) passes through some optical films to get the uniform and directed light and then goes through TFT LC layer to modulate light transmittance. Finally, the light passes through red, green, and blue color filters (CFs) to get three primary-colors and generate full color images by spatial color mixing. However, utilizing CFs to generate colors will lead to several drawbacks. First, the light efficiency is low. In general, the light observers perceiving is only 7% of backlight emitting because 1/2 of light is blocked by polarizer, 2/3 of light is blocked by color filter, and some percentage of light is blocked by optical films. Thus, the most power of backlight is wasted! Second, the pixel size is limited. By spatial color mixing, there are three color sub-pixels in one pixel so it is critical to reduce the pixel size since the limitation of TFT
manufacture. Third, the CFs cost about 28~32% in LCD module as shown in Fig. 1-2, so finding CF replacements or removing CF is a straight way to reduce LCD cost. Therefore, Field Sequential Color (FSC) LCDs were proposed to solve these drawbacks of conventional LCDs.
The concept of utilizing the FSC technique to generate colorful images was
proposed by Peter Goldmark in 1948[1].In the beginning, FSC technique was applied
to projector display systems. Until resent years, because of the development of fast response LC, such as optically compensated bend (OCB) mode[2-3], and high efficient light emitting diodes (LEDs) of three primary-colors[4-6], research of FSC-LCDs became popular in display technique since its attractive advantages[7-11].
The display mechanism of FSC-LCD can be explained byFig. 1-3. The backlight
module are composed by three primary-color LEDs, and lights in time sequence instead of full-on white backlight. Each primary-color passes through optical films and TFT LC layer to get red, green, and blue field images. Finally, three field images light sequentially with the frequency faster than the time resolution of eyes, and the display can show full color images by temporal color mixing. By using the temporal color mixing method, an FSC-LCD does not need CFs, so it has several advantages. First, light efficiency is three times higher than a conventional LCD because of removing CFs. Second, image resolution can be enhanced because there is no sub-pixel in a pixel. By TFT manufactures in the present day, the pixel size of FSC-LCD can be reduced easily. Third, CF cost can be removed, so display price may be lower. Furthermore, the FSC-LCD is based on the color LED backlight, and it is helpful to enhance color saturation and NTSC.
(a)
(b) (c)
Fig. 1-1. Display mechanism of conventional LCDs. (a) Display structure, (b) pixel arrangement, and (c) spatial color mixing
Fig. 1-2. The component costs of 15”and 30” displays
(From Deutsche Bank AG estimates, Company data)
(a)
(b) (c)
Fig. 1-3. Display mechanism of FSC-LCDs. (a) Display structure, (b) pixel arrangement, and (c) temporal color mixing
one pixel (b) (c) one pixel one pixel (b) (c) time time time one pixel one pixel one pixel R e d B \L B a c k lig h t O p t i c a l f i l m s T F T L C T e m p o r a l c o lo r m ix in g G r e e n B \L B lu e B \L R e d f ie l d im a g e G r e e n f ie ld i m a g e B lu e f ie l d im a g e ( a ) R e d B \L B a c k lig h t O p t i c a l f i l m s T F T L C T e m p o r a l c o lo r m ix in g G r e e n B \L B lu e B \L R e d f ie l d im a g e G r e e n f ie ld i m a g e B lu e f ie l d im a g e R e d B \L B a c k lig h t O p t i c a l f i l m s T F T L C T e m p o r a l c o lo r m ix in g G r e e n B \L B lu e B \L R e d f ie l d im a g e G r e e n f ie ld i m a g e B lu e f ie l d im a g e ( a ) W h ite B \L B a c k lig h t O p tic a l film s T F T L C R,G,BC o lo r filte r S p a tia l c o lo r m ix in g (a ) W h ite B \L B a c k lig h t O p tic a l film s T F T L C R,G,BC o lo r filte r S p a tia l c o lo r m ix in g W h ite B \L W h ite B \L W h ite B \L B a c k lig h t O p tic a l film s T F T L C R,G,BC o lo r filte r S p a tia l c o lo r m ix in g (a )
1.2 Phenomenon of Color Breakup (CBU)
The FSC-LCD achieves a novel display with lower power consumption, higher image resolution, and higher NTSC compared to those of conventional LCDs as mentioned in the previous section. However, a serious issue, color breakup (CBU)[12-16], causing viewers uncomfortable appears on the FSC-LCD when there is a relative velocity between viewer eyes and displayed images. Take a white bar showed on an FSC-LCD as the example, if the image is displayed in the FSC-LCD, red, green, and blue bars are displayed in time sequence to get white bar as shown in Fig. 1-4(a). Nevertheless, if there is a relative velocity between the viewer eyes and the displayed images, the field images of red, green, and blue bars will project at different positions on the retina. After eyes integration, the viewer will perceive a rainbow on the edges of the object, and it is called CBU phenomenon (Fig. 1-4 (b)). CBU is the most serious issues of FSC-LCDs, and it may happen in both stationary and moving images. The detail mechanism will be described in section 2.1.
(a)
(b)
Fig. 1-4. Mechanism of color breakup.
(a) Red, green, and blue bars are displayed in time sequence to a get white bar. (b) CBU phenomenon caused by separation of field images on Retina
=
……..
=
……..
Time of photogene time Retina position…
Time of photogene time Retina position…
1.3 Motivation and Objective
The FSC-LCD is a novel display which has several advantages compared to a conventional LCD. It does not need CFs, so it has higher light efficiency/lower power consumption, easier realization for higher image resolution, and lower cost. Besides, it based on color LED backlight module, so it has higher color saturation and NTSC. Therefore, the FSC-LCD has high potential to be commercial applications. However, it has a serious issue-CBU, and of course consumers are not willing to buy a uncomfortable display, even if the display has several advantages. Consequently, how to suppress CBU on FSC-LCDs will be an important research topic.
In recent years, several methods of CBU suppression, like frame rate increasing[21], multi-primary colors insertion[22-23], and motion compensation[24]…etc. The detail mechanism will be introduced in section 2.2. However, those methods face their own limitations and issues, so not only are the CBU suppressions limited, but also are hard to be commercial applications. Therefore, the objective of the thesis is to propose a color sequence with four fields (240Hz field rate), so it can be achieved by OCB mode LC easily. Moreover, the color sequence can make CBU imperceptible for human eyes, and it does not cause image distortion. Finally, the display with the color sequence is expected to achieve average power consumption less than 60W which is about 33% of conventional LED based LCD because it does not need color filters.
1.4 Organization
This thesis is organized as follows. In Chapter 2, the mechanism of different categories of the CBU phenomenon caused by different human eyes movements will be discussed. Then, some prior arts of the CBU suppression will be described. In Chapter 3, proposed method, Stencil Field Sequential Color (Stencil-FSC) method, will be introduced in detail, and some algorithm optimizations will be discussed. In Chapter 4, two experimental demonstrations will be presented and verified the Stencil-FSC method, and a comparison of display performance will be made between a conventional LCD and the FSC-LCD with the proposed method. In Chapter 5, by using created simulation program, hardware parameters will be optimized to get best CBU suppression. Finally, conclusions and future works will be summarized in Chapter 6.
Chapter 2
Color Breakup and Prior Solutions
The FSC-LCD is an effective display mechanism without CFs and has several advantages when compared to the conventional LCD. However, it faces a serious issue: color breakup (CBU). In order to suppress CBU, some basic concepts need to be understood. First, the eye movement response will be mentioned, and the different categories of CBU phenomenon caused by different human eyes movements will be discussed. Next, color difference (ΔE) between the target images and the CBU images was introduced and utilized to evaluate CBU phenomenon. Finally, several prior
works about CBU suppression will be mentioned.
2.1 Mechanism of Color Breakup in Conventional FSC-LCDs
The Human eye is a complex visual system, and its structure is shown in Fig. 2-1. Light goes through the cornea and then passes through the pupil controlled by the iris to adjust the incident magnitude of light. Then the lens focuses the light on the retina, and there are two kinds of receptors to detect intensity and color of light. The rod cells are sensitive to light intensity; the cone cells are sensitive to color. The receptors detect light and convert it into electrochemical signals. Finally, the signals pass through the optic nerve to the brain, and humans can perceive images[17]. The CBU phenomenon in the FSC-LCD has strong dependence on perceiving. According to research, humans use two major types of eye movement to perceive objects, saccade and pursuit. When watching an FSC-LCD, different eye movements will cause different CBU phenomenon; static CBU and dynamic CBU.
Fig. 2-1. Structure of human eye (From The Internet Encyclopedia of Science)
2.1.1 Physiology of eye movements
The fovea lies near the projection point at the center of the retina. This region has the highest resolution and is 0.1% of retina area. In order to see objects clearly, humans need to move their eyes to focus on the fovea. In perceiving research, two major types of eye movements are mentioned: saccade and pursuit[18]. They are caused by different observed object movements.
The first type of eye movements is saccade. Saccade is a rapid, random movement while perceiving static objects. Saccade movement moves around objects to focus on the fovea and gathers correct visual information. Take Fig. 2-2 for example. The test image is shown in the left picture, and the eye movement for the static image is lined with black on the right picture. In order to recognize the woman, the observer’s eye moves around her face to collect information. Generally, saccade is spontaneous, and the speed happens quickly at about 200 degree/sec[19].
The other type of eye movements is pursuit. Pursuit is a smooth and predictable movement when perceiving dynamic objects. When perceiving a moving object, the human eye will follow at the same velocity of the object to focus on the fovea and catch clear images. Compared to saccade, pursuit velocity is much slower, and some
research proposes the velocity is about 90 degree/sec. If a target moves at a velocity
faster than 90degree/sec, eye cannot pursuit it, as shown inFig. 2-3. Moreover, there
is one thing worth to noticing about pursuit movement: pursuit latency. Pursuit latency means the delay in eye pursuit, and it is defined as the difference in beginning motion time between the target and the eye. Refering to research, the pursuit latency is about 100 ms to 150 ms.
Fig. 2-2 (a) Perceived image, and (b) Saccade movement (black line) (Eye, Brain, and Vision, p.80, D.H. Hubel)
Fig. 2-3 Pursuit movement curve. If a target moves with a velocity faster than 90degree/sec, eye pursuit will not catch up.
2.1.2 Static CBU and dynamic CBU
There are two major kinds of eye movements when perceiving images, and the CBU phenomenon is strong dependent on the eye movement. Therefore, the CBU phenomenon can also be categorized into two types according to the image and the eye movement: static CBU and dynamic CBU.
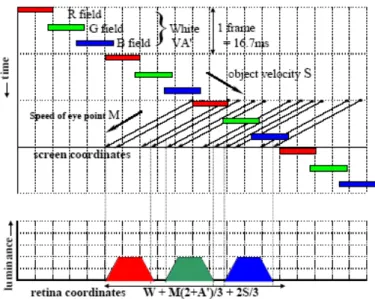
Static CBU phenomenon happens when perceiving static images. While humans perceive a static image, the eyes will move around the image to gather a clear image. The mechanism of static CBU can be explained by Fig. 2-4[20]. Fig. 2-4(a) is a static image. When perceiving the image, eyes will move between white bars with saccade movement to get visual information, like the dash line in the figure. In a conventional FSC-LCD with RGB color sequence, the display will show red, green, and blue fields in time sequence. When moving with saccade, like the dash line, the field images of different colors will separate. The pre-field is on the left side, and post-field is on the right side, so the CBU phenomenon appears as shown in Fig. 2-4(b). The effective factors of static CBU are image difference between each field and filed rate. Many methods have been proposed based on the adjustment of the factors to suppress the CBU. The mechanism of the methods will be given in the next section.
The other kind of CBU, dynamic CBU, happens when perceiving dynamic images. In order to focus on the fovea, the eyes will pursuit the moving object at the same velocity, and it will cause dynamic CBU. The mechanism of dynamic CBU can
be explained by Fig. 2-5. When a white bar is displayed on an FSC-LCD with RGB
color sequence, and viewer perceives it with the pursuit movement, the spatial-temporal relation can be indicated by Fig. 2-5(a). The horizontal axis is the display position, the vertical axis is time, and the eye trace line is indicated by the orange line. In order to make the eye integration easier to be understood, a coordinate
E y e tr a c e lin e R - S F G - S F B - S F G - S F B - S F R - S F B -S F R - S F G - S F m -3 m -2 m - 1 m m + 1 m + 2 m + 3 m + 4 m + 5 m + 6 m + 7 m + 8 m + 9 m + 1 0 m + 1 1m + 1 2 n -1 fra m e n fra m e n + 1 fra m e p ix e l N o . T im e D isp la y p o sitio n E y e tr a c e lin e R - S F G - S F B - S F G - S F B - S F R - S F B -S F R - S F G - S F m -3 m -2 m - 1 m m + 1 m + 2 m + 3 m + 4 m + 5 m + 6 m + 7 m + 8 m + 9 m + 1 0 m + 1 1m + 1 2 n -1 fra m e n fra m e n + 1 fra m e p ix e l N o . E y e tr a c e lin e R - S F G - S F B - S F G - S F B - S F R - S F B -S F R - S F G - S F m -3 m -2 m - 1 m m + 1 m + 2 m + 3 m + 4 m + 5 m + 6 m + 7 m + 8 m + 9 m + 1 0 m + 1 1m + 1 2 n -1 fra m e n fra m e n + 1 fra m e p ix e l N o . T im e D isp la y p o sitio n T im e D isp la y p o sitio n R -S F G -S F B -S F B -S F m -6 m -5 m -4 m -3 m -2 m -1 m m +1 m +2 m +3 m +4 m + 5 m +6 m + 7 m +8 m + 9 n-1 fram e n fram e n +1 fram e pixel N o. R -S F G -S F G -S F B -S F R -S F Tim e Retina position R -S F G -S F B -S F B -S F m -6 m -5 m -4 m -3 m -2 m -1 m m +1 m +2 m +3 m +4 m + 5 m +6 m + 7 m +8 m + 9 n-1 fram e n fram e n +1 fram e pixel N o. R -S F G -S F G -S F B -S F R -S F R -S F G -S F B -S F B -S F m -6 m -5 m -4 m -3 m -2 m -1 m m +1 m +2 m +3 m +4 m + 5 m +6 m + 7 m +8 m + 9 n-1 fram e n fram e n +1 fram e pixel N o. R -S F G -S F G -S F B -S F R -S F Tim e Retina position Tim e Retina position E ye trace line
transformation is used. The horizontal axis is transformed to the retina position, and the eye trace line change to a vertical line as shown in Fig. 2-5(b). After eye integration, the dynamic CBU will be perceived, like Fig. 2-5(c). The Dynamic CBU depends on the relation between the eye movement and the pursued object, and it also be affected by the display frequency. Some methods also proposed for suppressing dynamic CBU, and the mechanisms will be discussed in the next section.
(a) (b)
Fig. 2-4 Mechanism of static CBU. (a) Static image and eye trace line with saccade movement (dash line) and (b) static CBU phenomenon.
(a)
(b)
(c)
Fig. 2-5 Mechanism of dynamic CBU. (a) The spatial-temporal relation of displaying white bar in RGB color sequence, (b) a coordinate transformation of (a) to make eye trace line to be a vertical line, and (c) dynamic CBU phenomenon.
2.2 Prior Works of CBU Suppression
If the CBU issue on the FSC-LCDs can be suppressed effectively, the FSC-LCDs will have high potential to be a novel display with lower power consumption, higher color saturation, and lower cost. Therefore, how to suppress the CBU phenomenon has become an attractive research topic in the display technology, and many methods have been proposed. Those methods can be divided into three major categories: increasing field rate, inserting multi-primary color fields, and utilizing motion compensation. .
2.2.1 Field rate increasing
Field rate increasing is a direct method for suppressing CBU[21]. The CBU width (CBUW) depends on the field rate (F) and the relative velocity (V) between the viewer eye and the image. CBUW can be obtained by Eq. 2-1.
CBUW= V/F (2-1) If the field rate is increased, according to Eq. 2-1, the CBUW will be reduced, and human eye will be less sensitive to the CBU phenomenon. Moreover, prior research has implicated the field rate human can not perceive CBU phenomenon is about 1000Hz. For projector with color sequential technique, the field rate has been raised to more than 1000 Hz successfully by color wheel, and the CBU phenomenon is almost eliminated. However, utilizing color sequential technique on an LCD is extremely hard to raise field rate to 1000 Hz because the LC response time and TFT scanning time are limited.
2.2.2 Multi-primary color fields
Inserting multi-primary color fields to suppress CBU have been done by Tatsuo
Uchida research group in Tohoku University for years, and RGBY, RGBWmax,
RGBCY color sequences have been proposed[22-23]. The concept of these color sequences is to reduce the image difference between each field and prevent from the appearance of the sensitive colors on the CBU band. The CBU simulations of each
color sequence compared to RGB color sequence are sown in Fig. 2-6. By the
simulations, the colors of CBU widths are less sensitive to human eye compared to those of RGB color sequence, so CBU can be suppressed. However, these methods
face some issues. The RGBWmax and RGBY color sequence may cause color
distortion and reduce contrast ratio; the RGBCY color sequence needs 300 Hz field rate to be achieved, and it is hard to be realized on hardware.
Fig. 2-6 CBU simulations of different color sequences. (a) RGB, (b) RGBWmax, (c)
RGBY, and (d) RGBCY
RGBWmax 240Hz RGB 180Hz RGBCY 300Hz RGBY 240Hz (b) (a) (c) (d)
2.2.3 Motion compensation
Motion compensation method aims for suppressing dynamic CBU[24]. By image signal processing related to eye movements, compensated images are displayed to make each field of one frame at the same position on the retina. The compensation mechanism can be explained by Fig. 2-7. The figure of spatial-temporal relation has been used in the last section. In order to compensate the eye movement, field images will shift a distance according to the eye movement. After eye integration along the eye trace line, a white bar without CBU phenomenon will be perceived. Therefore, the dynamic CBU with predictable eye movement can be eliminated completely by the motion compensation method. However, if predicted eye movement is mistaken, or even in the opposite direction, this method will cause more serious CBU, like Fig. 2-8. Therefore, if an FSC-LCD is for multi-viewers, or there are more than two motion objects on the display, the motion compensation method will be failed for suppressing CBU phenomenon.
Fig. 2-7 Motion compensation method. CBU phenomenon with predictable eye movement
Fig. 2-8 Motion compensation method. CBU phenomenon with opposite eye movement
2.3 CBU Evaluation Index: ΔE*
abMany methods were proposed to reduce CBU. Therefore, how to evaluate the CBU phenomenon or improvement is important. The CBU phenomenon happens on the edge of images and causes difference between the perceived images and displayed target images. Therefore, utilizing the color difference between the target image and the CBU image to evaluate CBU phenomenon is straight and convenient. The concept of color difference had been discussed and proposed in Chromatics since early 1990s, and some optimized indexes of color difference were presented in recent decades.
In order to define the color difference, a uniform color space was established at first. In the late 1920s, two experiments were done by Wright and Guild to estimate the color matching function, and the experimental setup is shown in Fig. 2-9[25-26]. There was a circle region with the reference and test fields, and the size was defined by the visual angle with 2°. The reference field was projected by a monochromatic light with specific frequency, and the test field was composed by three adjustable
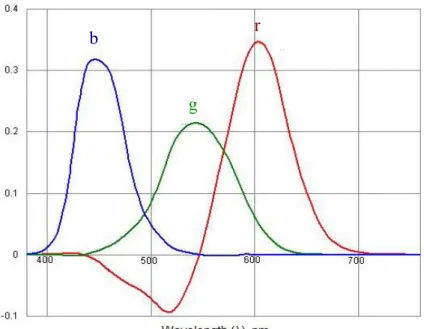
primary lights at wavelengths of 435.8, 546.1, and 700.0nm. In the experiment, the tester would be asked to control the components of the three primary lights and make the color of the test field the same as that of the reference field. Finally, the components of each reference monochromatic light would be recorded, and the experiment results of the tristimulus values of three primary lights could be gathered as r, g, and b as shown in Fig. 2-10. There was one thing worth to notice, the primary light component might be negative! In the experiment, it meant the adjustable primary color of the negative component was place on the side of reference field. However, the negative tristimulus value would lead to some calculation trouble in application, so it was transformed into the CIE system of colorimetry in 1931. This was accomplished by choosing two imaginary primaries, x and z, such that they produce no luminance response, leaving all of the luminance response in the third primary, y. The transformation matrix is presented in Eq. 2-1, and the figure of the tristimulus
values is shown in Fig. 2-11. By utilizing the process, there was no negative
tristimulus value in the figure.
⎥ ⎥ ⎥ ⎦ ⎤ ⎢ ⎢ ⎢ ⎣ ⎡ ⎥ ⎥ ⎥ ⎦ ⎤ ⎢ ⎢ ⎢ ⎣ ⎡ = ⎥ ⎥ ⎥ ⎦ ⎤ ⎢ ⎢ ⎢ ⎣ ⎡ b g r z y x 594 . 5 056 . 0 000 . 0 060 . 0 590 . 4 000 . 1 130 . 1 751 . 1 768 . 2 (2-1)
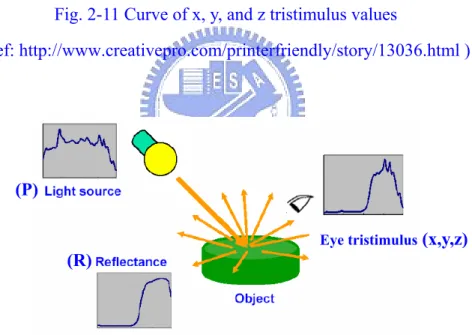
Then, because color is determined by three components, light source (P), object reflection(R), and the tristimulus values of human eye(x, y, and z) as shown in Fig. 2-12, the colored tristimulus could be defined by XYZ tristimulus by those components, like Eq. 2-2.
∑
= 780 380 ) ( ) ( ) (λ P λ x λ R k X∑
= 780 380 ) ( ) ( ) (λ P λ y λ R k Y (2-2)∑
=k780R(λ)P(λ)z(λ) Z∑
= 780 380 ) ( ) ( / 100 P λ y λ kFig. 2-9 The experimental setup of color matching
Fig. 2-10 Curve of r, g, and b tristimulus values
(Ref: http://www.math.ubc.ca/~cass/courses/m309-03a/m309-projects) Reference field Test field Test field Reference field r g b
Fig. 2-11 Curve of x, y, and z tristimulus values
(Ref: http://www.creativepro.com/printerfriendly/story/13036.html )
Fig. 2-12 Color is determined by three components, light source (P), object reflection (R), and the tristimulus values (x, y, z).
The XYZ tristimulus values were a three-dimensional space in which each axis was a primary, and a sample’s tristimulus values were defined by a coordinate. However, according to prior Chromatics research, color information was independent of luminance[25], and the objective was to establish a chromaticity diagram with
z y x Eye tristimulus (P) (R) (x,y,z)
taking the ratio of the tristimulus values to the sum, X+Y+Z, like Eq. 2-3, and it was meant to make a projection on the plane defined by X+Y+Z=1.
) /( ) /( ) /( Z Y X Z z Z Y X Y y Z Y X X x + + = + + = + + = (2-3) Finally, a chromaticity diagram called CIExyY was completed and presented in Fig. 2-13. However, the color difference on the CIExyY chromaticity diagram presented by MacAdam in 1942 is shown in Fig. 2-14[26]. Colors within an ellipse on the diagram denote that testers can not distinguish. From the results, the color difference is not uniform in the CIExyY chromaticity diagram. Therefore, the other optimized chromaticity diagram, CIELAB (1976) was proposed to overcome the issue. The equations for the CIE LAB chromaticity diagram are shown in the Eq. 2-4 where Xn, Yn, and Zn are the tristimulus values of the reference white.
Xn X as same the are Zn Z and Yn Y Xn X Xn X f Xn X for Xn X Xn X f Xn X for Zn Z f Yn Y f b Yn Y f Xn X f a Yn Y L Yn Y for Yn Y L Yn Y for / / / 116 / 16 ) / ( 787 . 7 ) / ( 00885 . 0 / ) / ( ) / ( 00885 . 0 / )] / ( ) / ( [ 200 * )] / ( ) / ( [ 500 * ) / ( 3 . 903 * 00885 . 0 / 16 ) / ( 116 * 00885 . 0 / 3 / 1 3 / 1 + = ≤ = > − = − = = ≤ − = > (2-4)
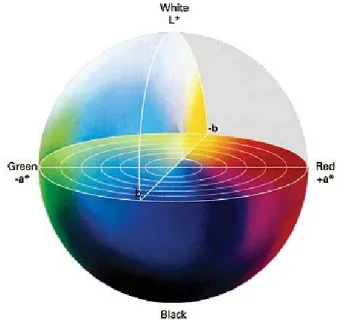
In the CIELAB chromaticity diagram, the L*, a*, and b* denote luminance, color component of yellow-blue, and color component of red-green, respectively, as shown in Fig. 2-15. By utilizing CIELAB, a more uniform chromaticity diagram could be
established. Therefore, the index of color difference was defined by ΔE*ab in the CIE
LAB chromaticity diagram, as in Eq. 2-5. Consequently, the CBU phenomenon will be evaluated by the ΔE index between the target image and the CBU image to verify the proposed Stencil-FSC method.
2 / 1 2 2 2 ( *) ( *) ] *) [( * L a b E ab = Δ + Δ + Δ Δ (2-5)
Fig. 2-13 CIExyY chromaticity diagram
(Ref. http://www.colblindor.com/2007/01/18/cie-1931-color-space)
Fig. 2-14 Experimental results of color difference in CIExyY chromaticity diagram
Fig. 2-15 CIE LAB chromaticity diagram
(Ref. http://www.newsandtech.com/issues/2002/02-02/ifra/02-02_greybalance.htm)
2.4 Summary
The physiology of eye movements and the mechanism of CBU caused by different eye movements have been introduced. In order to suppress the CBU issue on FSC-LCDs and achieve novel type displays with lower power consumption, higher color saturation, and lower cost, many researchers have proposed several methods for CBU suppression, like increasing field rate, inserting multi-primary color fields, and utilizing motion compensation. However, these methods have their own challenges, such as LC limitation, image distortion, and uncertain eye movement, so they are hard to be applied on the hardware. Therefore, we proposed the “Stencil Field Sequential Color (Stencil-FSC) method to effectively suppress CBU with field rate of 240 Hz, and it is easier to be implemented on hardware.
Chapter 3
Stencil Field Sequential Color Method
The “Stencil Field Sequential Color (Stencil-FSC)” method with 240 Hz field rate was proposed for suppressing CBU. The concept and algorithm will be introduced at first, and the two processes for optimization, backlight colorful method and Fourier transformation process in will be presented in the following. Finally, the performance and the feasibility of Stencil-FSC method could be obtained.
3.1 Stencil Field Sequential Color Method
3.1.1 Concept
The conventional RGB color sequence utilized to display full color image on the FSC-LCD causes serious CBU because the field images are colorful and bright, like Fig. 3-2(b). Therefore, the “Stencil” concept was utilized to suppress CBU. The
meaning of “stencil” is a unique technique of painting. TakeFig. 3-1 for example, if a
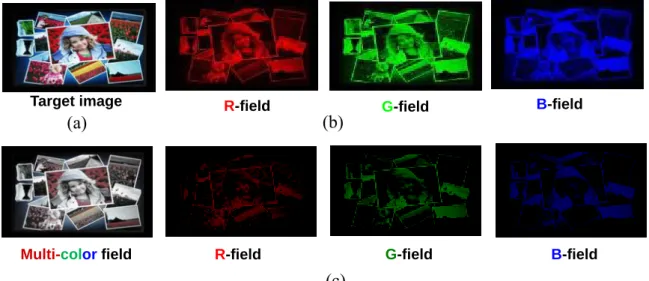
boy will be painted on the wall by the stencil technique, a base color, white (Fig. 3-1 (b)), is drawn firstly, and then blocks of detail parts with different colors are put on the base color in order to add each detail color (Fig. 3-1(c)). Finally, the painting can be completed by the stencil technique as shown in Fig. 3-1(d). By the concept of stencil, the “Stencil Field Sequential (Stencil-FSC) Method” was proposed to suppress CBU. The Stencil-FSC method is a color sequence with four fields. A multi-color image is displayed in the first multi-color field instead conventional single-color fields, and the red, green, and blue field images are displayed to add red, green, and
B-field
R-field G-field
R-field G-field B-field
Multi-color field
(b)
(c) (a)
Target image
blue image details as shown in Fig. 3-2(c). By the method, the most color and luminance information are shown at the first multi-color field, so the red, green, and blue field images are darker and less colorful compared to those of conventional RGB color sequence, and it will be helpful for suppressing CBU. Additionally, the concept of utilizing multi-color fields instead of conventional single-color fields to display images was first proposed in FSC technique.
Fig. 3-1 The flowchart of stencil method. (a) Put block of base image, (b) paint base color, (c) put blocks of detail parts with different colors and paint color, and (d) complete the painting. (From http://www.wretch.cc/blog/Bbrother&article)
Fig. 3-2 (a) Target image. The field images of (b) RGB color sequence and (c) Stencil-FSC method.
3.1.2 Display module
In order to get the first multi-color field, the FSC-LCD with Stencil-FSC method can be based on a locally controlled backlight system. The backlight system is divided into several regions, and it can be locally controlled according to the displayed image as shown in Fig. 3-3. Furthermore, the locally controlled backlight can be intensity or color, like Fig. 3-3(b) and Fig. 3-3(c) respectively. The technique is also called High Dynamic Range (HDR) technique [27-28], and the flowchart is given in Fig. 3-4. At first, the LC signal of target image with full-on white backlight (Io) is inputted, and
then backlight LED signals (ILED) of each region are gotten by an algorithm of locally
controlled backlight, such as maximum, root, or Inverse of a Mapping Function (IMF)[29]. Next, in order to get the compensated LC signal (Compensated LC), the backlight distribution of locally controlled backlight is obtained by convolution of
ILED and light spread function (LSF). The compensated LC can be gotten by
comparing the backlight distribution to the target image. Finally, the image can be
displayed by composing the real backlight distribution of ILED and compensated LC.
The backlight can be locally controlled according to the image, so it can enhance the contrast ratio, save power consumption, and increase color saturation compared to those of conventional full-on backlight system. Therefore, by implementing the technique on the FSC-LCD, not only can the first multi-color field be generated, but
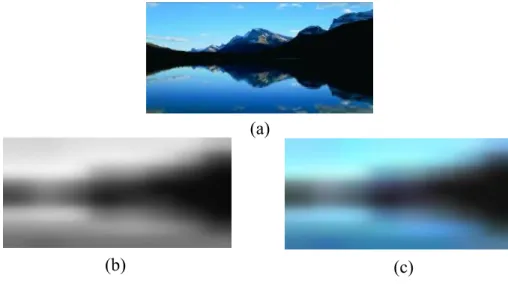
Fig. 3-3 Locally controlled backlight technique. (a) Target image, (b) intensity locally controlled backlight, and (c) color locally controlled backlight.
Fig. 3-4 The flowchart of locally controlled backlight technique
(High Dynamic Range technique)
3.1.3 Algorithm
The Stencil-FSC method displays multi-color image at the first field to reduce the luminance and color of red, green, and blue fields, and it is helpful to suppress CBU. The algorithm can be explained by Fig. 3-5. At first, the locally controlled
backlight and the compensated LC signals (LCR, LCG, and LCB) can be gotten by the
algorithm of locally controlled backlight process as show in Fig. 3-4. Then, the (a) (b) (c) Io ⊗ LED I LSF I ILED Target image ( 8 × 8 ) Compensated LC Locally controlled B/L ⊗ LED LSF I
minimum compensated LC signal of red, green, and blue is taken as LCmin, like Eq.
3-1, and it will be the LC signal of first multi-color field.
LCmin= min (LCR, LCG, LCB) (3-1)
By composing the LCmin with the color backlight from locally controlled backlight,
the first multi-color field can be completed. At the second red-field, the LC signal
(LCR’) is equal to Eq. 3-2 and the backlight signal is the red component of locally
controlled backlight (Red B/L).
LCR’= LCR- LCmin (3-2)
Then, the second red-field can be generated by composing the LC signal of LCR’ and
the backlight of Red B/L. Furthermore, the green and blue fields also can be gotten by the algorithm of red-field. Finally, the field images of color, red, green, and blue can be produced. By displaying them in time sequence, a full color image can be perceived on the FSC-LCD.
Fig. 3-5 The algorithm of Stencil-FSC method
Target image Compensated LC (LCR,LCG,LCB Locally controlled B\L
+
=
Red B\L LCR ‘=LCR-LCmin+
=
Green B\L LCG ‘=LCG-LCmin=
+
Blue B\L LCB ‘=LCB-LCmin+
=
B\L LCmin3.2 Algorithm Optimization
The Stencil-FSC method can be completed by utilizing the algorithm introduced in last section 3.1.2. However, the algorithm has two issues. First, the first multi-color field is not colorful enough, and it will cause the luminance and color of red, green, and blue field are obvious. Thus, it can not suppress CBU effectively. Second, the generating process of backlight distribution is too complicate. In general, convolution method is usually used to get backlight distribution. However, the method has complicate computation complexity, and it is almost impossible to be utilized on hardware. Therefore, backlight colorful method and Fourier transformation process are utilized to solve these two issues and optimize the algorithm of Stencil-FSC method.
3.2.1 Backlight colorful method
The field images generated from the algorithm mentioned in section 3.1.2 are shown in Fig. 3-6. Unfortunately, the multi-color field is not colorful enough. Therefore, the most color and luminance information are displayed at red, green, and blue field, and the CBU suppression is limited. Therefore, the backlight colorful method is proposed to overcome this issue. In order to make the first multi-color field be more colorful, it is important to reduce the difference between compensated LC signal of red, green, and blue, which the backlight colorful method is based on the concept. The original locally controlled backlight signal is gotten by the backlight process as show in Fig. 3-7(a). In order to make the backlight more colorful, the minimum backlight is dimmed by a ratio (ex. 10%), and new locally controlled backlight signal is gotten, like Fig. 3-7(b). By a fundamental equation of displaying,
respectively; GLLC denotes the gray level of LC signal.
Iimage = (GLLC/255)γ × IBL (3-3)
If the backlight intensity is reduced, the LC signal will be enhanced. Therefore, a larger minimum LC signal can be generated, and the multi-color field will be more colorful by the method, as shown in Fig. 3-8. Thus, the most color information is displayed in the first multi-color field, so the field images of red, green, and blue will be less colorful, and the CBU suppression will be more effective.
Furthermore, by utilizing the backlight colorful method to get the more colorful
multi-color field, the determination of the dimming ratio is a critical work. In Table.
3-1, a comparison of different dimming ratio is made to discuss the effect on the CBU
and the distortion ratio (D) of image, and the distortion ratio is defined by Eq. 3-4.
Distortion ratio (D) = number of distorted pixels/ number of total pixels (3-4)
There are three dimming ratios are presented, and some summaries can be made. The smaller dimming ratio can get more colorful multi-color field, and it is more helpful for suppressing CBU. The green components of CBU with different dimming ratios are shown in the brackets of second row. However, the smaller dimming ratio may cause more image distortion because the LC and backlight cannot display enough luminance. Thus, the dimming ratio of backlight dimming method is needed to be
optimized, and the optimization will be discussed in the Chapter 5.
Fig. 3-7 The locally controlled backlight signal of (a) original algorithm and (b) algorithm with the backlight colorful method
Fig. 3-8 The field images of Stencil-FSC algorithm with the backlight dimming method
Table. 3-1The CBU and the distortion ratio (D) of image with different dimming ratio (225,161,65) (225,161,7) 10% (a) (b)
5.558%
0.004%
0%
Distortion ratio (D) distorted pixel # D= total pixel # Simulated CBU image color-field10%
50%
100%
B\L dimming5.558%
0.004%
0%
Distortion ratio (D) distorted pixel # D= total pixel # Simulated CBU image color-field10%
50%
100%
B\L dimming(Gray level)G=151 (Gray level)G=137 (Gray level)G=87
3.2.2 Backlight distribution generation by Fourier transformation
process
In order to get the compensated LC signal, the backlight intensity distribution of the locally controlled backlight must be known. The usual method is utilizing convolution process. By measuring the light intensity distribution of an individual region, a light spread function can be gathered, like Fig. 3-9(a). Then, a backlight distribution can be generated by making a convolution of the light spread function and locally controlled backlight signal, like Fig. 3-9. The convolution method is a straight way to get the backlight distribution. However, the computation complexity is shown in Eq.3-5, and the X and Y mean the size of light spread function; the X1 and Y1 stand for the size of image size, and No. means the number of backlight regions. Computation complexity = (X*Y)*(No.)+ (No.)*(X1*Y1) (3-5) It is an elaborate computation, and it is extremely hard to be realized on hardware. Therefore, an alternative method, “Fourier transformation process,” is utilized to get backlight distribution.
A Fourier Transformation with low-pass filter is used to simplify the backlight distribution generation as shown in Fig. 3-10. At first, the locally controlled backlight signal is extended into the image size, and then the signal in frequency domain is gotten by making a Fourier Transformation to the extended locally controlled backlight signal. Next, a low-pass filter covers the locally controlled backlight signal in frequency domain to block the information of high frequency which is the edge part in spatial domain. In the step, a Gaussian low-pass filter is chosen because it can prevent from the ringing phenomenon in the image as shown in Fig. 3-11[30]. Finally, a blur image can be gotten by making an inverse Fourier Transformation to the locally controlled backlight signal passed filter in frequency domain. The computation
complexity is equal to Eq. 3-6, and the X and Y stand for image size.
Computation complexity =4*[(X*Y)+(X*Y)+ (X*Y)] (3-6) In order to prove the computation simplification, a comparison of computation complexity is made between the convolution process and the Fourier Transformation process. The image and light spread function size are set as 1366*768, and the number of backlight regions is divided into 16*12. By inserting the parameters into Eq. (3) and Eq. (4), Fourier transformation process has only 3% computation compared to convolution process. Therefore, generating the backlight distribution by Fourier Transformation process can simplify the computation effectively, and it can enhance the feasibility of the Stencil-FSC method on the hardware.
Fig. 3-9 Convolution process. (a) Light spread function,(b)the locally controlled backlight signal, and (c) the convolution backlight.
Fig. 3-10 Fourier transformation process. (a) The extended locally controlled backlight, (b) the backlight signal in frequency domain, (c) the Gaussian low-pass filter, and (d) The blurred image.
FT Low-pass filter (FT)-1 Locally controlled B/L (Spatial domain) Locally controlled B/L (Frequency domain) (a) (b) (c) (d) 12*16
=
Light spread function B/L distribution
X Y X1 (a) (b) (c) Y X B\L distribution
Fig. 3-11 Ringing phenomenon. (a) Target image, (b) blurred image with ringing, and (c) blurred image without ringing.
(From Digital Image Process, Gonzalez and Woods, p.180-185)
3.3 Summary
Base on the concept of “stencil” which is a technique of painting, a Stencil-FSC method was proposed to suppress the CBU on the FSC-LCD. The method was based on locally controlled backlight system, and it displays a multi-color image in the first multi-color field, so it could reduce the color and luminance of red, green, and blue fields to suppress CBU. However, the original algorithm had some issues, so the backlight colorful method was proposed to get more colorful multi-color field, and the Fourier transformation process was utilized to simplify the computation complexity. By the optimized algorithm, the Stencil-FSC can not only suppress CBU effectively, but also enhance the feasibility on the hardware. Moreover, Stencil-FSC will be verified by simulation and demonstration in the next two chapters.
Chapter 4
Experimental Demonstration
Stencil-FSC method was proposed to suppress CBU on the FSC-LCD. Furthermore, two optimize algorithms, the backlight colorful method and the Fourier Transformation process, have been utilized to enhance CBU suppression and reduce the computation complexity. In order to verify the Stencil-FSC method, a demonstration on the real FSC-LCD will be completed.
4.1Approximation of Backlight Intensity Distribution
In the demonstration, the Fourier Transformation (FT) process was utilized instead of the convolution method to generate light distribution of locally controlled backlight and simplify the computation complexity as mentioned in 3.2.2. Therefore, in order to demonstrate correctly, it is important to make the backlight intensity distribution generated form Fourier Transformation process the same as that form convolution process.
In the Fourier transformation process, a Gaussian low-pass filter was used to filter the high frequency component of locally controlled backlight image in frequency domain, and a blur backlight image can be got to be the simulated light distribution. The equation of the Gaussian low-pass filter is shown in Eq. 4-1, and the diagram is shown in Fig. 4-1
2 0 2( ,)/2 ) , ( D uv D e v u H = − (4-1)
H is the magnitude of the low-pass filter, D is a coordinate in frequency domain, and
is the ratio of the coordinate where the maximum magnitude deceases to 60.7% and
the total width of the Gaussian profile (W). Therefore, the lager D0 denote the
Gaussian profile is broader, the more high frequency component of image can pass through, and the clearer image can be generated as shown in Fig. 4-2(b). Conversely,
the smaller D0 denote the Gaussian profile is narrower, less high frequency component
of image can pass through, and the more blurry image can be generated, as in Fig. 4-2(c). Therefore, the blurry image with different blur level can be generated by
adjusting the D0 parameter, and it can be utilized to simulate the backlight intensity
distributions with different light spread function.
D0 W
H
60.7% 2 0 2(, )/2 ) , ( D uv D e v u H = −D
Fig. 4-1 Gaussian low-pass filter
(a) (b) (c)
Fig. 4-2 (a) Target image. Blurry images by using FT process with (b) D0=0.01 and (c)
D0=0.001
Then, an approximation of the real backlight intensity distribution on the 32” FSC-LCD
supported by C-Company was made by Fourier Transformation process. Parameter, D0,
used (Fig. 4-3 (a)-(c)), and the results are shown in Fig. 4-4. When D0 is close to 0.0023,
the minimum ΔE*ab can be gotten, that means the blurry backlight is closest to
convolution backlight, as in Fig. 4-5. Therefore, when implementing Fourier
Transformation process on the 32” FSC-LCD, the D0 will be chosen to be 0.0023 to get
the most realistic backlight distribution, and the compensated LC signal can be gotten.
(a) (b)
(c)
Fig. 4-3 Test images. (a) Soccer, (b) color balls, and (c) girl.
0 1 2 3 4 5 6 7 8 0 0.0005 0.001 0.0015 0.002 0.0025 0.003 0.0035 0.004 0.0045 Do D e lt a E to ta S oc c e r C olor ba ll Gril D0~0.0023 0 1 2 3 4 5 6 7 8 0 0.0005 0.001 0.0015 0.002 0.0025 0.003 0.0035 0.004 0.0045 Do D e lt a E to ta S oc c e r C olor ba ll Gril D0~0.0023 D0~0.0023
Fig. 4-4 The relation between D0 and ΔE. When D0 is close to 0.0023, the minimum
ΔE*ab can be gotten.
Fig. 4-5 (a)Target images, (b) convolution backlights, and (c) FT blurry backlights
with D0 =0.0023 of three test images.
(c)FT blurry B/L
4.2 Experimental Demonstration I-15Hz/Frame
A Conventional LCD was used to simulate a FSC-LCD with Stencil-FSC method, and the Stencil-FSC method can be verified by using the experimental demonstration. At first, simulated field images of the Stencil-FSC method are generated by a simulation program created by Matlab software, and the simulation parameters were set to match the real 32” FSC-LCD. The number of backlight sub-regions equals
12*16, D0 in Gaussian low-pass filter equals 0.0023, and the dimming ratio was set
50% to prevent image distortion. In the following, the simulate field images were displayed sequentially on the conventional LCD with 60Hz frame rate. However, Stencil-FSC method was a color sequence with four fields so the frame rate of the simulated FSC-LCD was only 15Hz, which was so low that human will perceive flicker phenomenon. Therefore, a High-speed CCD (Charge Coupled Device) camera was utilized to capture images with 15Hz capture frequency, and the images were displayed in 60Hz frame rate. Finally, Stencil-FSC images with 60Hz frame rate (240Hz field rate) can be simulated successfully. Finally, a moving camera was used to simulate eye movement and capture the CBU phenomenon in a conventional RGB color sequence and the Stencil-FSC method on the experimental LCD. Two test images, Lily and Girl, were used to verify the Stencil-FSC method as shown in Fig. 4-6. Lily is a white image which causes serious CBU using conventional RGB color sequence, and Girl is a colorful image utilized to test the CBU and image distortion for each color. The experimental results are presented in Fig. 4-7 and Fig. 4-8. In both test images, the CBU phenomenon is effectively suppressed by utilizing Stencil-FSC method, and there is no image distortion. Therefore, the Stencil-FSC method was
(a) (b)
Fig. 4-6 The test image. (a) white image: Lily and (b) colorful image : Girl
(a) RGB color sequence (b) Stencil-FSC method Fig. 4-7 The captured CBU image of Lily with (a) conventional RGB color sequence and (b) The Stencil-FSC method
(a) RGB color sequence (b) Stencil-FSC method Fig. 4-8 The captured CBU image of Gril with (a) conventional RGB color sequence and (b) The Stencil-FSC method
4.3 Experimental Demonstration II-60Hz/frame
The second experimental demonstration verified the Stencil-FSC method on a 32” FSC-LCD supported by C-company with local dimming backlight of 12*16 sub-regions and 180Hz field rate. The schemes of the FSC-LCD are presented in Table. 4-1.Because the field rate of the FSC-LCD was only 180Hz, and the frame rate must be set higher than 60Hz to prevent flickering, the panel could only display three fields sequentially in a frame. However, the Stencil-FSC method is a color sequence with four fields, so one of the fields must be rejected. Because human eye is less sensitive to blue compared to red or green, the blue field image can be rejected with less sensitivity to color distortion. Moreover, white and yellowish images were chosen to be the test images since the color contribution from blue field images were not important when utilizing the Stencil-FSC method. Therefore, two test images, Lily and Sunflower, were used in the experimental demonstration, and the field images are shown in Fig. 4-9.
Table. 4-1 Schemes of the 32” FSC-LCD
32-inch FSC-LCD OCB-mode LC 1366 × 768 16 × 12 Divisions BL 48 × 24 (1152) LEDs
(a)
(b)
Fig. 4-9 Test images of (a) Lily and (b) Sunflower and their field images
In the experimental demonstration, the backlight signal for 12*16 sub-regions was sent to the backlight system to get locally controlled color backlight, as in Fig. 4-10. The LC signal for the multi-color field, red-field, and green-field were implemented into the LC layers. Then, the multi-color field, red-field, and green field would light in sequence at 180Hz field rate, and a colorful image could be perceived as shown in Fig. 4-11. Finally, a moving camera was utilized to capture the CBU image and verify the Stencil-FSC method. The results are presented in Fig. 4-12 and Fig. 4-13, and verified that the Stencil-FSC method can suppress CBU effectively. Moreover, as mentioned previously, the Stencil-FSC method not only suppressed CBU, but it also performed better compared to a conventional LCD and an LED based LCD, such as ultra-low power, high contrast ratio, and high NTSC. Therefore, the display performances were measured and summarized in the Table. 4-2. By utilizing the Stencil-FSC method on the FSC-LCD, The average power consumption was reduced to 44W which is only about 24% of a conventional LED based LCD. The result is better than the objective, 33%, because the locally controlled backlight was
applied with Stencil-FSC method. Moreover, the contrast ratio was enhanced to 5900:1 in the normal image, Sunflower, which was ten times larger than conventional CCFL-LCDs. The contrast ratio can even be increased to 27000:1 in high contrast image, Lily. The NTSC can also be increased to 114% compared to 72% in conventional CCFL-LCDs. Therefore, the Stencil-FSC can suppress CBU effectively and get the attractive performances, and they have been verified by the experimental demonstration on the 32” FSC-LCD.
(a) (b)
Fig. 4-10 The color locally controlled backlights of (a) Lily and (b) Sunflower
(a) (b)
Fig. 4-11 The Stencil-FSC images of (a) Lily and (b) Sunflower
(a) (b)
Fig. 4-12 The CBU image of Lily using (a) the Stencil-FSC method and (b) the conventional RGB color sequence