國 立 交 通 大 學
財 務 金 融 研 究 所
碩 士 論 文
實質選擇權賽局與策略投資:
筆記型電腦 OEM/ODM 產業之應用
Strategic Investment as a Real Options Game:
An Application to Laptop OEM/ODM Industry
研 究 生:黃家維
指導教授:黃星華 博士
實質選擇權賽局與策略投資:
筆記型電腦 OEM/ODM 產業之應用
Strategic Investment as a Real Options Game:
An Application to Laptop OEM/ODM Industry
研 究 生:黃家維
Student: Huang, Chia-Wei
指導教授:黃星華 博士
Advisor: Dr. Huang, Hsing-Hua
國 立 交 通 大 學
財 務 金 融 研 究 所
碩 士 論 文
A Thesis
Submitted to Graduate Institute of Finance
College of Management
National Chiao Tung University
in partial Fulfillment of the Requirements
for the Degree of
Master of Science in Finance
July 2007
Hsinchu, Taiwan, Republic of China
實質選擇權賽局與策略投資:
筆記型電腦 OEM/ODM 產業之應用
研 究 生:黃家維
指導教授:黃星華 博士
國立交通大學財務金融研究所
2009 年 6 月
摘要
本篇研究建構於 Smit 與 Trigeorgis (2004) 之模型架構上,於雙占市場及 價格競爭產業基礎下,以實質選擇權賽局法分析全球筆記型電腦代工產業龍頭— 廣達電腦投資新型觸控式螢幕之筆記型電腦專案之可行性與價值。分析過程中不 僅將市場景氣變動因素納入考量,亦考慮廣達之競爭對手,包含仁寶電腦、緯創 資通及英業達之反應與決策。根據本研究結果顯示,投資該專案為廣達最適之決 策。當市場需求越大及市場不確定性越高時,廣達應加快投資速度,因為投資該 專案所產生之價值也會越高。 關鍵字:實質選擇權賽局、實質選擇權、賽局、筆記型電腦代工Strategic Investment as a Real Options Game:
An Application to Laptop OEM/ODM Industry
Student: Huang, Chia-Wei
Advisor: Dr. Huang, Hsing-Hua
Graduate Institute of Finance
National Chiao Tung University
June 2009
Abstract
This thesis follows the model of Smit and Trigeorgis (2004). Under the conditions of the price competition and the duopoly model, this thesis evaluates the feasibility and the value of the multi-touch panel laptop project for Quanta, the leader company of the laptop OEM/ODM industry, through the real options game methodology. This methodology not only considers the market uncertainty but deliberates Quanta’s competitors’ reactions including Compal Electronics, Inc., Wistron Corporation, and Inventec Corporation. The result demonstrates that investing in the project is the optimal decision for Quanta. Due to the high value of the real options of the project, Quanta should make this investment promptly when the market demand and market uncertainty are high.
Keywords: Real Options Game; Real Options; Game Theory; Laptop OEM/ODM Industry
誌 謝
「寫論文的過程只是一種訓練,重點在於獨立思考與解決問題的能力。你所 得到的,也是別人拿不走的!」恩師當時的ㄧ句話,現在聽來更加覺得深刻。最 感謝是我的恩師—黃星華博士。感激恩師在課業上細心的指導與叮嚀,感激恩師 在課餘外陪伴我打羽球紓解壓力,更感激恩師於我在上海交換學生期間給予之關 心以及回台後於我未來人生藍圖的建議。同時,感謝口試委員張興華老師、林信 助老師及李漢星老師對本篇論文所提供之諸多寶貴意見,使本篇論文更趨完善。 再者要感謝交大財金所嚴謹治學的諸位老師。首先是對我最照顧的謝鍾惠民 教授,感謝老師在所長任內對我的提攜與鼓勵。即使忙碌至極,也不曾忘記對於 我的關心;感謝本所王克陸老師、王淑芬老師、戴天時老師、李漢星老師以及應 數系吳慶堂老師,謝謝老師豐富了我的財金知識,更影響了我的人生;感謝語言 中心的吳思葦老師及秦毓婷老師,謝謝老師不嫌棄我的英語寫作能力,不斷地給 予鼓勵並耐心的指導,使自己的英語能力有些許的進步;感謝財金所辦公室的謝 佳芸小姐與沈稚螢小姐,謝謝於任職班代表期間給予所需的ㄧ切幫助。 我還要感謝親愛的家人。謝謝最疼愛我的父母親、兄嫂以及女友曉茹。正因 為你們無盡的關懷與無限的支持,我才有動力走到今天。 最後要感謝財金所九六級的同學們。雖然只有兩年短暫相處的時間,但一同 經歷了招說會、迎新、送舊以及各種大小比賽。我們一起瘋狂玩樂、一起熬夜唸 書、一起埋頭寫論文,這一切都將會是我碩班時期最美麗的回憶。謝謝星星幫的 景璁、璝志、嵐鈞、茹雲、昱聰與我一起走過研究的道路;謝謝ㄧ同住在復國社 區裡的俊文與博宇陪伴我度過寫論文的每一個夜晚;謝謝住在研二舍的祥霈、紜 齊及經銓與我一同上健身房運動紓解壓力的日子。 因為有你們,才讓我得以順利完成學業。願能與大家分享我內心之感激與喜 悅,家維在此致上最深的謝意。 黃家維 謹誌 中華民國九十八年六月Contents
Chinese Abstract ……..……….…….…….………....I
English Abstract ..……..……….…….…….………....II
Acknowledgements ..……….…….….….…...………....III
Section 1 Introduction ……….……..…….………....1
1.1 Background and Motivation ….………...………1
1.2 Purpose of the Thesis ……….…...……….…..….………...3
1.3 Research Area ………..………..…………...………...4
1.4 Procedure and Structure of the Thesis ………...…………..5
Section 2 Literature Reviews ……….…………8
2.1 Traditional Investment Methodologies ………8
2.2 Real Options ……….………...………8
2.3 Game Theory ………....………..11
2.4 Options Game ………...…….………....11
Section 3 Model Construction ………...17
3.1 Methodology ……….…..….…………...17
3.2 Model Assumptions and Constraints ………….…….…………..…….18
3.3 Decision Tree ……….………...……….18
3.4 Price Competition Model ………...…….………….……...…...22
Section 4 Case Study ……….………..30
4.1 Price Competition Industry ………...………..…..…...…………..30
4.2 Case Study ...……….………...……….……....… 31
4.3 Scenario Analyses ………..………...…….…...………….35
Section 5 Conclusions ………...…...……...……….47
Lists of Tables
TABLE 1.1: Main Differences between OEM and ODM ………...….6
TABLE 1.2: Global Market Shares and Main Clients of the Five Companies ….……..6
TABLE 2.1: Merits and Drawbacks of Six Traditional Investment Methodologies ...13
TABLE 2.2: Definitions of Important Variables between Real Options and Financial Options ………..……...………...14
TABLE 2.3: Common Corporate Real Options ………..…..15
TABLE 2.4: Successive Stages of Analysis for Real Options Game ……..……...…..16
TABLE 3.1: Definitions of the Symbols ………..…………...27
TABLE 3.2: Equilibrium Prices for Different Market Structures under Reciprocating Price Competition in Each Stage ………...………...28
TABLE 4.1: R&D Expenses of Quanta and PixArt for Touch Panel Laptops ...……39
TABLE 4.2: Estimated Quantity of Touch Panel Laptops in 2011 …………..…...…..39
TABLE 4.3: Comparison between Option Value with Game and Option Value without Game………44
TABLE 4.4: Reduced Form of the Time Period...……….……44
TABLE 4.5: Scenario Analysis of Theta of Quanta………...…………..…...…..44
TABLE 4.6: Scenario Analysis of Volatility……….…...…..……45
TABLE 4.7: Scenario Analysis of the Changes of Risk-free Rate.………...45
TABLE 4.8: Scenario Analysis of the Increment Changes of Up Moves…...…...……46
Lists of Chart and Figures
CHART 1.1: Market Shares of the Top Ten Laptop Companies ……...…….…………..7
FIGURE 1.1: Procedure of the Thesis ………....……….7 FIGURE 3.1: Illustration of the Decision Tree (Investing in the First Period) ….…….25
FIGURE 3.2: Illustration of the Decision Tree (Deferring in the First Period) …….…26
FIGURE 3.3: Illustration of the Possible Stock Prices with Two Periods ….….………29
FIGURE 3.4: Illustration of the Call Value ……….………...29
FIGURE 4.1: Outcome of the Up Moves of the Market in 2011 ……….………..40
FIGURE 4.2: Outcome of the Simultaneous Game with the Extensive and Normal Form in 2011 ……….………...40
FIGURE 4.3: Route of Decision Tree (Investing) ……….41 FIGURE 4.4: Route of Decision Tree (Deferring; up moves) …….……….…………..42
Section 1 Introduction
1.1 Background and Motivation
Eee PC, which is provided by ASUSTeK Computer Inc., was the best Christmas
present of electronic products division on Amazon.com in 2007. The features of this
small laptop, called “netbook” by Intel, are light, handy, and cheaper. In addition,
another netbook, called Aspire One, provided by Acer Inc. has become popular. Many
people know that both ASUS and Acer are Taiwanese companies; however, few
people know that more than 90 percent of laptops (also known as notebooks) around
the world are made by Taiwanese companies nowadays.
According to the statistics of Market Intelligence & Consulting Institute (MIC),
90 percent or more laptops worldwide are produced by Taiwanese laptop ODM/OEM
firms. Besides, more than 99 percent netbooks are manufactured by these firms as
well.
Tang (1999) defined that the original equipment manufacturer, or OEM, is
usually a company which uses components or parts made up by other firms in its
products, or sells an entire products of other firms under its own brand. Moreover, he
also defined that an original design manufacturer (ODM) is a company which designs
and manufactures a product which will be branded and sold by another brand firm.
TABLE 1.1 illustrates the main difference between OEM and ODM. In OEM
agreements, the OEM company focuses on fabrication and production, and the brand
company concentrates on sales and services. Moreover, most decision rights are
controlled by the brand company. Conversely, the ODM company has to design and
manufacture products, and the brand company focuses on sales and services as well.
Besides, the ODM company and the brand company usually decide and discuss
details of products together in ODM agreements.
There are five leading laptop OEM/ODM manufacturers in Taiwan. They are
Quanta Computer Inc., Compal Electronics, Inc., Wistron Corporation, Inventec
Corporation, and Pegatron Corporation. Their orders come from world famous
computer corporations, such as HP, Dell, Toshiba, SONY, Apple, etc.
(TABLE 1.2 is about here)
TABLE 1.2 shows the global market shares of the five laptop OEM/ODM
companies in 2007. Quanta and Compal own more than 50 percent of market shares
worldwide. CHART 1.1 exhibits the market shares of the top ten laptop companies,
called brand firms. They are also the critical clients for the laptop OEM/ODM
companies. Note that the market shares of the top five brand companies are more than
50 percent of the whole industry.
Quanta Research Institute, which has been training engineers to develop future
products, has invented a new laptop with touch panel responded by CMOS1. It is called “multi-touch panel laptop” by some analysts.
Besides, due to the low acceptability of Windows Vista, Microsoft is expected
to launch a brand-new operating system, called Windows 7, in the end of the third
quarter this year. The most attractive feature of Windows 7 is that it supports the
multi-touch panel function, making a keyboard and mouse assistant tools rather than
essential tools.
Because of high market shares between Quanta and other firms, this thesis is
going to look into the competitive relationship between Quanta, the leader company
of the industry, and three other companies and the value of investing in the new
multi-touch panel project. Note that Pegatron Corporation is excluded from this study
because Pegatron Corporation is not a listed company, and it is difficult to obtain the
financial statements of the company.
1.2 Purpose of the Thesis
This study aims at the four main laptop OEM/ODM firms in Taiwan. They are Quanta
Computer Inc., Compal Electronics, Inc., Wistron Corporation, and Inventec
Corporation.
Based on the industrial classification of Ministry of Economic Affair, a laptop,
which is designed for portable use and small enough to sit on one’s lap, includes a
keyboard, a display and other devices. The size is similar to an A4 paper, and the
weight is approximately to 3 kilograms.
Due to the background and motivation, this thesis is going to analyze:
1. the status of the laptop OEM/ODM industry,
2. the competitive relation between Quanta and other firms, and
3. whether Quanta should invest in the multi-touch panel laptop project by using the
options game methodology.
1.3 Research Area
1.3.1 Length of Time
Time horizon of the decision tree starts in 2008 and ends in 2011. On average, many
statistics show that most new electronic products’ life cycle are less than four years so
the lengths of time are decided. In addition, each period represents one year.
1.3.2 Source of the data
The data of this study was obtained by the financial reports of the four firms. The time
period of the data starts in the third quarter of 2002 and ends in the fourth quarter of
2008. The demand function of this research follows the Bertrand duopoly price
1.4 Procedure and Structure of the Thesis
The procedure is classified into five parts. Section one introduces the status of the
laptop OEM/ODM firms and industry. Section two reviews the related literature.
Section three derives the decision tree and the critical model. Section four calculates
the investing value of the multi-touch panel project through the options game
methodology; in addition, scenario analysis is used to evaluate the value of real
options given different conditions. Finally, Section five makes a conclusion. FIGURE
1.1 exhibits the procedure of this thesis.
TABLE 1.1
Main Differences between OEM and ODM
Main Differences OEM ODM
Works The OEM firm fabricates and produces products
The brand company focuses on sales and services; the ODM firm has to design and manufacture products Underlying Goods
of Contracts
Components, semi-finished
products, and finished products Finished products or services Contents
of Contracts The brand company decides
The brand company and the ODM firm decide each other Profits Allocation The brand company decides The brand company and the
ODM firm discuss each other Source: Chen (1996)
TABLE 1.2
Global Market Shares and Main Clients of the Five Companies
Company Market Share Main Clients
Quanta Computer Inc. 32.72 % HP, Acer, Dell, Apple, and Lenovo Compal Electronics, Inc. 23.26 % HP, Acer, Dell, Toshiba, and Lenovo
Wistron Corporation 12.42 %
HP, Acer, Dell, Lenovo, and Fujitsu -Simens
Inventec Corporation 9.36 %
HP, Acer, Toshiba, and Fujitsu -Simens
Pegatron Corporation 7.71 % Asus, Dell, and Toshiba Others’ Corporations 14.53 %
Total 100 %
CHART 1.1
Market Shares of the Top Ten Laptop Companies
0.00% 5.00% 10.00% 15.00% 20.00% 25.00% market shares 20.10% 15.90% 14.00% 8.60% 8.20% 4.90% 4.80% 4.70% 4.10% 16.80%
HP Acer Dell Toshiba Lenovo Fujitsu Sony Asus Apple Other
Source: DisplaySearch (March, 2008)
FIGURE 1.1 Procedure of the Thesis
Introduction
Literature Reviews
Decision Tree Model
Evaluation & Scenario Analyses
Section 2 Literature Reviews
2.1 Traditional Investment Methodologies
There are six traditional investment methodologies that we often use. These six
methodologies are net present value method (NPV method), internal rate of return
method (IRR method), accounting rate of return method (ARR method), payback
period method (PB method), discounted payback method (DPB method), and
profitability index method (PI method). Every method has its unique merits as well as
its drawbacks. The crucial merits and drawbacks of these six methodologies are
summarized in TABLE 2.1.
(TABLE 2.1 is about here)
Some investment projects have to invest vast amounts of money periodically
under high uncertainty, and traditional investment methodologies cannot help
managers decide whether managers should invest in the project. Because of the
problems, the method of real options evolves.
2.2 Real Options
Black and Scholes (1973) derived the famous B-S formula pricing European options,
and Merton (1973) not only expanded the mathematical comprehension of pricing
Hayes and Abernathy (1980) and Hayes and Garvin (1982) mentioned that the
traditional methods for investment decisions eliminated the value of flexibility.
Trigeorgis and Mason (1987) also stated that the discount cash flow (DCF) method
could not reflect the authentic value of managerial flexibility.
Myers (1977) brought up the concept to combine the relation between financial
options and real options, and he pointed out that real options could be priced by
financial options. In addition, Trigeorgis (1993) indicated that the main difference
between financial options and real options was the underlying assets. He also
classified explicitly that the underlying assets of financial options were financial
securities that could be issued; on the other hand, the underlying assets of real options
were real assets that could not be issued.
(TABLE 2.2 is about here)
TABLE 2.2 explains the definitions of important variables between financial
options (for financial assets) and real options (for projects). A call option gives its
holder the right, by paying a specified cost within a period of time, to exercise the
option and acquire the underlying asset. If there are no opportunity costs of waiting or
dividend-like benefits to hold the asset, the holder will postpone the decision to
exercise until the expiration date (T). In the real option case, the underlying asset is
while the exercise price is the necessary investment outlay (at time T), IT. The ability
to defer a project with an uncertain value, VT, creates valuable managerial flexibility.
If, during the later period, market demand develops favorably and VT > IT, the firm
can make the investment and gain the net present value of the project at that time,
NPVT = VT - IT. If, on the other hand, the project value turns out to be lower than
originally expected (VT < IT), management can decide not to make the investment and
its value is truncated at zero. In this situation, the firm only loses what it has spent to
obtain the option.
(TABLE 2.3 is about here)
TABLE 2.3 exhibits the concept of the basic types of real options analyzed in the
literature. This table contains the option to defer investment in a new uncertain market,
the option to expand or contract capacity, the option to abandon, the option to switch
inputs or outputs, and the option to temporarily shut down.
Taudes (1998) analyzed the decision model of an investment project by using
the real options approach in information technology (IT) industry. In Taudes’s paper,
the NPV of an irreversible investment project can be calculated by the following
formula:
Expanded (strategic) net present value (NPV*) = Passive NPV of expected cash flows
2.3 Game Theory
Zermelo (1913) brought up the first theorem of game theory, called Zermelo’s
Theorem. Borel (1921) published four notes of strategic games and gave the first
contemporary formula of the mixed strategy. Von Neumann and Morgenstern (1944)
analyzed people’s behaviors and interactions through the strict mathematical model
which includes game theory.
Furthermore, Nash (1950) concentrated on non-cooperative games including
the theory of Nash Equilibrium. Flood and Dresher (1950) finished a famous
experiment—the Prisoner’s Dilemma. Nash (1950, 1951) proved the existence of the
Nash Equilibrium, a strategic equilibrium for noncooperative games.
Harsanyi (1967, 1968) developed incomplete information of game theory.
Kreps et al. (1982) brought the concept that sequential equilibrium enlarged the
concept of a subgame perfect equilibrium to subgames in the extensive form.
2.4 Options Game
For a project with uncertainty, managers can make a good decision by using the real
options approach considering the flexibility of a project. Meanwhile, managers also
have to deliberate competitors’ behaviors, so game theory is involved. TABLE 2.4
shows the related literatures of successive stages of analysis for the options game
problems and their varieties.
(TABLE 2.4 is about here)
Kulatilaka and Perotti (1998) pointed out that a company would gain more
market shares when it had more strategic investment of growth options. Cottrell and
Sick (2001) indicated that an enterprise would own the first mover advantages when
the enterprise was the first investor of a field, and the investment project would
generate the convenience value. They also stated how a follower might gain more
profits by using the right of wait and see.
Isik et al. (2003) found that a project decision of a company was influenced by
costs, market demand, and competitiors’ uncertainty through using the options game
method. Furthermore, Murto (2004) found out the best timing for abandoning in a
declining duopoly market by the same method. Smit and Trigeorgis (2006) also
derived the best R&D strategy for consumer electronic products, telecommunications,
TABLE 2.1
Merits and Drawbacks of the Six Traditional Investment Methodologies
Investment Model Merits Drawbacks
Net Present Value (NPV method)
1.It is easy to calculate
2.It considers all cash flows and time value of money
3.Value can be added
4.The highest-value project can be chosen from many exclusive projects
It is hard to decide an appropriate discount rate
Internal Rate of Return (IRR method)
1.It considers all cash flows and time value of money
2.It obtains an implied rate of return
1.NPV and IRR may cause different results in the same project
2.It may result in multiple real or imaginary roots
3.It is not suitable for exclusive investment projects
Accounting Rate of Return (ARR method)
1.It is easy to decide a proper investment project
2.It considers all cash flows
1.It does not deliberate time value of money and cash flows of whole periods
2.The critical point of whether to invest is subjective rather than objective
Payback Period (PB method)
1.It is easy to calculate
2.It considers the liquidity of projects
1.It ignores the cash flows which come after payback periods
2.It is not suitable for long-term periods projects
3. Time value of money is not included
Discounted Payback Period (DPB method)
1.It is easy to calculate 2.The liquidity of projects is
considered
3. Time value of money is contained
1.It ignores the cash flows which come after payback periods
2.It is not suitable for long-term periods projects
3. Time value of money is not included Profitability Index
(PI method)
It is often collocated with IRR to evaluate a project
Sometimes it has different results with NVP
TABLE 2.2
Definitions of Important Variables between Real Options and Financial Options
Call option Variable Project
Stock price V Present value of expected cash flows Exercise price I Present value of investment outlays Time to maturity T Length of deferral time
Risk-free rate r Time value of money Variance of stock returns σ2
Volatility of project’s returns Source: Smit and Trigeorgis (2004), p. 12
TABLE 2.3
Common Corporate Real Options
Type of option Relevant Research Description
Option to defer (simple option)
McDonald and Siegel (1986); Paddock, Siegel and Smith (1988); Ingersoll and Ross (1992)
Management holds a lease on (or the option to buy) valuable land or natural resources. It can wait to see if output prices justify constructing a building or plant, or developing a field. Growth Option (compound option) Trigeorgis (1988); Pindyck (1987); Chung and Charoenwong (1991); Smit (1996)
An early investment (e.g., R&D investment) or a strategic investment is a prerequisite or a link in a chain of interrelated projects, opening up future growth opportunities (e.g., a new generation product or process).
Option to abandon
Kemna (1988); Myers and Majd (1990)
If market conditions decline severely, management can abandon current operations permanently and realize on secondary markets the resale value of capital
equipment and other assets.
Option to expand or contract
McDonald and Siegel (1985); Trigeorgis and Mason (1987); Pindyck (1988); Kemna (1988)
If market demand turns out to be more favorable than expected, management may increase capacity or accelerate resource utilization. Management may also extend production if the life of the project is longer than expected. Conversely, management may reduce the scale of operations.
Option to temporarily shut down
Bernnan and Schwartz (1985)
If operations are less favorable than expected, management may temporarily halt and then start up again.
Option to switch
Kulatilaka (1988 and 1995); Aggarwal (1991); Kogut and Kulatilaka (1994); Kamrad and Ernst (1995)
If prices or demand changes, management may change the project mix of the facility (“product flexibility”). Alternatively, the same outputs can be produced by different projection processes or inputs (“process flexibility”).
TABLE 2.4
Successive Stages of Analysis for Real Options Game
Type of option game Relevant Research Problems Description Implication One-stage games
with no competition (proprietary option)
McDonald and Siegel 1986; Brennan and Schwartz 1985
View investment opportunities as simple proprietary options to invest.
Incentive to delay investment under uncertainty One-stage games with endogenous competitive reactions (shared option) Dixit 1979, 1980; Spence 1977, 1979; Kester 1984; Baldwin 1987; Trigeorgis 1988; Ghemawat and del Sol 1998; McGahan 1993; Smit and Ankum 1993
When shared opportunities face a competitive loss, a game-theoretic treatment becomes necessary.
Timing is a tradeoff between flexibility value and commitment.
Two-stage games with no competition
McGrath 1997; Bettis and Hitt 1995; Bowman and Hurry 1993
Investment in growth options; for instance, the analysis of R&D
opportunities to acquire a proprietary option to proceed with the commercialization investment in the stage 2
Negative NPV of the first stage can be justified for its growth option value
Two-stage games with endogenous
competition in stage 2
Dasgupta and Stiglitz 1980; Appelbaum and Lim 1985; Daughety and Reinganum 1990;
Spencer and Brander 1992; Kulatilaka and Perotti 1998
R&D strategy of the stage 1 faces (endogenous)
competition in production (stage 2)
Competitive strategy based on the type of investment
(proprietary/shared) and the nature of competitive reaction (reciprocating/contrarian) Two-stage games with endogenous competition in both stage
Appelbaum and Lim 1985; Spencer and Brander 1992
Strategic investment with endogenous competition in the stage 1 influences the value of stage 2 Trade-off between cooperation and competition Competition vs. cooperation in stage 1
(joint R&D ventures)
Kogut 1991 The value of stage 2 is affected by the cooperation competition of stage 1
Evolution of cooperation in technology intensive industries
Section 3 Model Construction
In the laptop OEM/ODM market, there exists high competition and low profits.
Namely, each firm’s decisions and actions are strongly and easily affected by other
firms. The main purpose of this study is to look into the competitive relationship
between Quanta and the three other firms and the value of investing in the multi-touch
panel project through the options game methodology.
3.1 Methodology
Smit and Trigeorgis (2004) published a book; they introduced real options and game
theory in detail and integrated these two approaches into an analytical method. In
Chapter 6 of this book, they took an example of an R&D investment for the
development of the latest, economical, and technological process versus a base case of
no R&D investment which continues to use the existing technology. The option value
of this R&D investment depends on endogenous competitive reactions; this example
is illustrated by the two-stage game in extensive form under different market
structures.
Correspondingly, the model of this study expands the theoretic framework from
the book to the laptop OEM/ODM industry with four-stage game under complicated
3.2 Model Assumptions and Constraints
First of all, the market structure of this model is supposed to be a duopoly market; that
is, there are two main companies dominating the industry. In order to conform to the
model and ponder the other firms’ reactions, Compal, Wistron, and Inventec are
combined to form a group which is the Quanta’s competitor, called “Others.”
Pegatron Corporation is not a listed company, so it is excluded from the study.
Second, much evidence shows that the life cycle of most of innovative
electronic products lasts three or four years, so the lengths of time are decided in four
periods.
Third, the range of up moves and down moves is fixed to recombine the nodes
of this decision tree.
3.3 Decision Tree
The convenient and interesting function of the iPhone touch panel indeed created a
shopping rush around the world; therefore, engineers who work at Quanta thought of
implementing the ideas of the iPhone touch panel in their products. After that, Quanta
was expected to gain more market shares and profits by inventing new laptops with
touch panel.
At present, touch panels can be classified into two categories, which are
types of touch panels are controlled by foreign companies, such as Synaptics, Inc.,
ALPS ELECTRIC CO., LTD, and Texas Instruments Incorporated. Due to the
constraints of the touch panel patents, Quanta decided to invent a new type of laptops
with touch panels, called multi-touch panel laptops, which are responded by CMOS.
(FIGURE 3.1 is about here)
(FIGURE 3.2 is about here)
(TABLE 3.1 is about here)
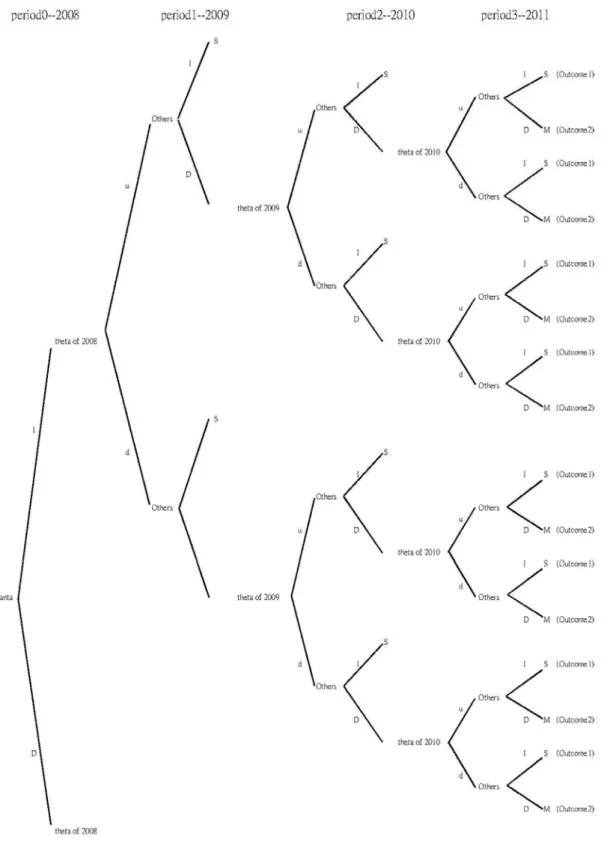
FIGURE 3.1 depicts the possible decisions and actions of Quanta and Others, if
Quanta decides to invest in the project in the first period (2008). Quanta, which is the
pioneer firm, has two options: to invest in the R&D project of multi-touch panel
laptops or not to invest in it this year. If Quanta decides to make a strategic investment
(I) for the project (investing in the project), a sequential game will occur. Investing in
the project also means that Quanta probably gains proprietary advantages and Others’
decisions must be influenced by Quanta’s decisions. One year later, the exogenous
market demand of multi-touch panel laptops, which is represented by the symbol “θ ”,
may move up (u) or down (d). Since Quanta already made the strategic investment in
2008, Others has to decide whether Others should invest in the project in this period
(2009). No matter if the market demand moves up or down, either of the two
Outcome 1: Stackelberg price leader/follower outcome (S and SL F)
If Others decides to make the strategic investment, a Stackelberg
leader/follower game is formed. In this situation, Quanta invests in the project first, so
it becomes a Stackelberg leader ( ); Others invests at a later period, so it becomes a
Stackelberg follower ( ). On the contrary, if Others invests in first, then it becomes
a Stackelberg leader; Quanta invests in a later period, it becomes a Stackelberg
follower.
L
S
F
S
Outcome 2: Monopolist outcome (M)
If Others decides not to make the strategic investment, the sequential game will
be repeated until the last period of time (2011). In 2011, if three other companies still
choose not to invest in the project, then Quanta finally turns into a monopolist (M) of
the touch panel laptop OEM/ODM market.
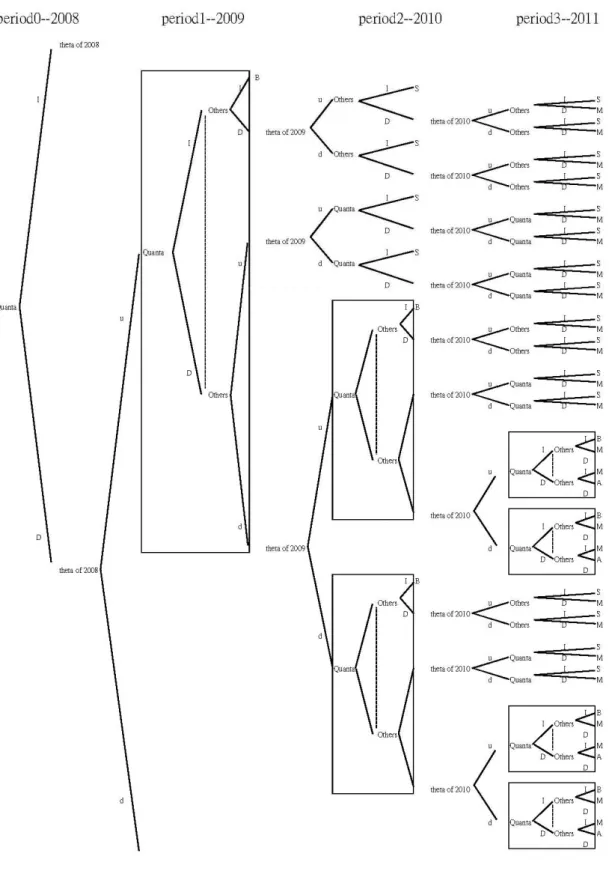
On the other hand, if Quanta decides to defer (D) for the project (not investing
in the project) in the first period, it means that Quanta and three other firms are
identical (producing similar laptops) and a simultaneous game will occur in the next
period (2009). FIGURE 3.2 illustrates the possible situations of deferring the project in
first period. In addition to FIGURE 3.1 and FIGURE 3.2, TABLE 3.1 shows the
In period 1 (2009), either of the two sides (Quanta and Others) can make the
investment for the project, and four possible outcomes will occur.
Outcome 3: Bertrand price equilibrium outcome (B)
First of all, if both Quanta and Others invest in this period (2009) simultaneously,
the outcome results in Bertrand price equilibrium.
Secondly, if Quanta invests in the project in this period, and Others chooses not
to invest in this period and chooses to invest in a later period, a Stackelberg
leader/follower game is formed. Accordingly, Quanta is a Stackelberg leader ( ),
and Others is a Stackelberg follower ( ). Conversely, if Quanta chooses not to
invest in the project in this period, and its competitor does; the outcome causes a
Stackelberg leader/follower game. In this situation, Quanta becomes a Stackelberg
follower ( ), and Others becomes a Stackelberg leader ( ).
L S F S F S SL
Thirdly, if Quanta invests and Others chooses to defer until the last period, then
Quanta becomes a monopolist (M) in the touch panel laptop OEM/ODM market and
vice versa.
Outcome 4: Abandon outcome (A)
Fourthly, no matter if the market demand moves up or down, if both sides
always decide to defer the project from 2008 to 2011, or they determine to abandon ,
3.4 Price Competition Model
3.4.1
Cash Flows of the ProjectSuppose that the demand for the touch panel laptops is linear in prices2:
( , , )
i i j it it i j
Q P P θ =θ −bP + dP (3.1)
where the quantity which is sold by company is related to its price and the
competitor’s price . The coefficients and ( , assuming demand
substitutes) capture the sensitive of the quantity sold to the firm’s own and its
competitor’s price settings, respectively.
i Pi
j
P b d b>0 d >0
The profits of each firm (where = Quanta or Others) are i i
πi( ,P Pi j,θi t, )=(Pi−ci)(θi t, −bPi+ Pd j)
i
i i i
(3.2)
where c is the variable cost of company . i
Based on (3.1) and (3.2), every competitive price can be obtained. The
equilibrium prices are showed in TABLE 3.2, and the derivation procedures are
exhibited in the appendix.
(TABLE 3.2 is about here)
By using these prices, predicted quantities, and the invested capital for the
touch panel laptop project, the cash flows in last period can be gained. Cash flow of the project *
(P c ) Qe stim a te d I
= − × − (3.3)
2
where = Quanta or Others, i *
i
P is the competiton price, is the variable cost,
is the estimated quantities of the touch panel laptops, and is the
invested capital for the project.
i
c
e stim a te d
Qi I
3.4.2
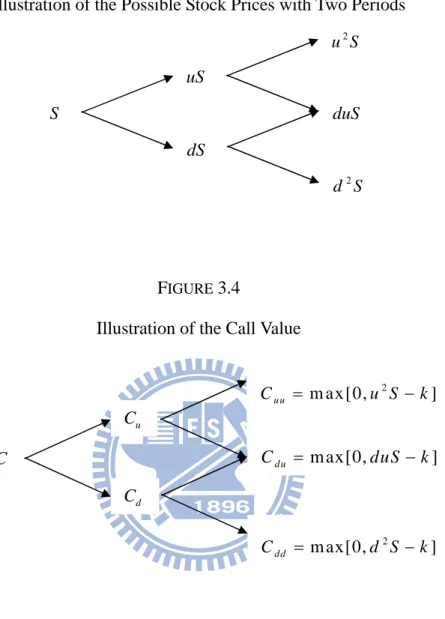
Backward Induction(FIGURE 3.3 is about here)
(FIGURE 3.4 is about here)
Cox, Ross, and Rubinstein (1979) manipulated the method of backward induction to
obtain the option value at the beginning in a discrete time structure. FIGURE 3.3
demonstrates the possible stock prices after two periods. In order to keep with the
binomial process, the stock price can take on three possible values after two periods,
where is the stock price, is the upper rate of return on the stock, and is the
lower rate of return on the stock. Besides, has to equal so that the binomial
tree can recombine in the last period.
S u d
d 1/ u
Similarly, FIGURE 3.4 shows a call with two periods remaining before its
expiration date, where is the call value, stands for a call two periods from
the current time if the stock price moves upward each period, and have
analogous definitions, and is the exercise price.
C Cuu
du
C Cdd
The call option can be obtained by3: 2 2 2 2 2 2 2 2 2 (1 ) (1 )
max[0, ] 2 (1 ) max[0, ] (1 ) max[0, ]
uu ud dd p C p p C p C C r p u S k p p duS k p d S k r + − + − = − + − − + − − = (3.4)
where p is the risk-neutral probability and r is the risk-free rate.
Finally, the option values in every node are determined through the backward
induction approach from the last period to the first period, and each firms’ optimal
decisions can be decided by the computation results at the beginning.
3
FIGURE 3.1
FIGURE 3.2
TABLE 3.1
Definitions of the Symbols
Symbol Definition Quanta Quanta Computer Inc.
Others
Three firms including Compal Electronics, Inc., Wistron Corporation, and Inventec Corporation
I A decision to invest in the project
D A decision to defer the project / Stay flexible (option value)
θ The state of market demand of multi-touch panel laptops (exogenous variable)
u Nature’s up moves d Nature’s down moves.
S Stackelberg leader (SL) / follower (SF) outcome M Monopolist outcome
B Bertrand quantity / price equilibrium outcome A Abandon (0 value)
TABLE 3.2
Equilibrium Prices for Different Market Structures under Reciprocating Price Competition in Each Stage Action (A,B) Market Structure N/M/S/A/D Equilibrium Price,
Pi
* (for qi =qj =0) Period 1(I,I) Bertrand price (B) 2 ( , )2 (2 , )
4 i t i j t j b bc d bc b d θ + + θ + − (I,D) (D,I)
Stackelberg price leader (SL) or
Stackelberg price follower (SF)
, , 2 2 2 ( ) ( ) 4 2 i t i j t j i b bc d bc dc b d θ + + θ + − − 2 , , , 2 2 2 ( ) ( ) 2 2 2 (4 2 ) j t cj bd i t bci d j t bcj dci b b b d θ θ + + θ + − + + − (D,D) Defer (D) Period 2
(DI,DI) (II,II) Bertrand price (B) 2 ( , )2 (2 , )
4 i t i j t j b bc d bc b d θ + + θ + −
(II,DI) (DI,II) Stackelberg price leader (S
L
) or
Stackelberg price follower (SF)
, , 2 2 2 ( ) ( ) 4 2 i t i j t j i b bc d bc dc b d θ + + θ + − − 2 , , , 2 2 2 ( ) ( ) 2 2 2 (4 2 ) j t cj bd i t bci d j t bcj dci b b b d θ θ + + θ + − + + − (D,D) Defer (D) Period 3
(DDI,DDI) Bertrand price (B) 2 ( , )2 (2 , ) 4 i t i j t j b bc d bc b d θ + + θ + − (DDI,III) (III,DDI) (DII,DDI)(DDI,DII)
Stackelberg price leader (SL) or
Stackelberg price follower (SF)
, , 2 2 2 ( ) ( ) 4 2 i t i j t j i b bc d bc dc b d θ + + θ + − − 2 , , , 2 2 2 ( ) ( ) 2 2 2 (4 2 ) j t cj bd i t bci d j t bcj dci b b b d θ θ + + θ + − + + −
(III,DDD) (DDD,III) Monopolist(M) ( )
2( ) t c b d b d θ + − − (DDD,DDD) Abandon (A)
FIGURE 3.3
Illustration of the Possible Stock Prices with Two Periods
2
u S uS
FIGURE 3.4
Illustration of the Call Value
S dS duS 2 d S C u C d C m ax[0, ] du C = duS −k 2 m ax [0, ] uu C = u S −k 2 m ax[0, ] dd C = d S −k
Section 4 Case Study
4.1 Price Competition Industry
Although much evidence shows that the laptop OEM/ODM industry is a price
competition industry, the competitive type of the industry still needs to be proved by
numbers. Bulow, Geanakoplos, and Klemperer (1985) and Sundaram, John, and John
(1996) indicated that the variable of Competitive Strategic Measure (CSM) is a direct
proxy of the second derivative of profit with respect to its own quantity and the
competitor’s quantity. By computing the coefficient of correlation between the change
in a firm’s profit margin (Δπf /Δ ) against the change in its competitor’s output Sf
( ), the market competitive type can be found. If CSM is greater than zero, the
market is defined as strategic complements (a price competition market); otherwise,
the market is defined as strategic substitutes (a quantity competition market). c
S
Δ
In the laptop OEM/ODM industry of Taiwan, the coefficient of correlation
between the profit margin of Quanta and the output of Others is 0.1033, so the market
is regarded as a price competition market. However, because of the highly seasonal
variation of the revenue in this industry, we use the approach of seasonal differential
4.2 Case Study
4.2.1 Assumptions
Firstly, based on the estimation of MIC, Quanta uses the CMOS technology of PixArt
Imaging Inc.4, so the invested capital for touch panel laptops in this study includes the R&D expenses of Quanta and PixArt. TABLE 4.1 shows the R&D expenses of Quanta
and PixArt for the touch panel laptop project in 2007 and 2008, and this study
assumes that 50 percent of the total R&D expenses are used in inventing touch panel
laptops.
(TABLE 4.1 is about here)
Secondly, this study assumes that the first mover (the company which invests in
the project first) can earn 5 percent additional quantity when the market moves up and
earn 3 percent additional quantity when the market moves down.
4.2.2 Estimation of Parameters
Equation (4.1) supposes that the demand for the touch panel laptops is linear in
prices5:
( , , )
i i j it it i j
Q P P θ =θ −bP + dP , = Quanta or Others (4.1) i
where the quantity which is sold by company is related to its price and the
competitor’s price . By putting the historical data of
i Pi
j
P Pi, Pj, and Qi (where
4
PixArt Imaging Inc., one of the leading companies of CMOS imaging sensors and related IC design, research, production, and sales.
i = Quanta and j = Others or = Others and i j = Quanta) into regression model, the
coefficients and d can be estimated. These two estimated coefficients and are 599.5746 and 572.3002. The time period of data starts in the third quarter of
2003 and ends in the fourth quarter of 2008. Equation (4.1) becomes:
b b
d
Q P Pi( i, j,θit)=θit −599.5746Pi+572.3002Pj, = Quanta or Others (4.2) i
After that, Pi, Pj, and Qi are put into the equation (4.2), a series of θi t,
(where = Quanta or Others) can be gained. The market demand for touch panel
laptops in 2008 is 82,573,618 when equals Quanta; the market demand for touch
panel laptops in 2008 is 107,666,161 when i equals Others. Besides, the annual
volatility of the growth rate of the laptop market demand (
i
i
σ ) is 0.4465. According to this statistic, the up moves (u) and down moves (d) are:
exp( ) exp(0.4465 1) 1.5628 u= σ T = × = , and 1 1 0.6399 1.5268 d u = = =
σ is annual volatility, and is the length of a trading period. T
where
In addition, the risk-neutral probability6 is defined by
0.02 1 e 0.4748 0.412 2.1062 0.4748 rT d e p u d × − − = = = − −
where r is the risk-free rate, which is 0.02 in this case.
4.2.3 Cash Flows of the Last Period
Equation (4.3) describes the cash flow of the last period under different outcomes,
including Cournot Nash price competition equilibrium outcome, monopolist outcome,
Stackelberg price leader/follower outcome, and abandon.
Cash flow of the project *
( ) e stim a te d i i i P c Q I = − × − (4.3) where * i
P is the competition price of different outcomes, is the variable cost,
is the estimated quantity of the touch panel laptops, and is the invested
capital for the project. In this project,
i
c
e stim a te d i
Q I
I equals NT$ 6,239(million). The average
operating costs of Quanta and Others are NT$41,290 and NT$44,091 respectively.
TABLE 4.2 illustrates the estimated quantity of touch panel laptops in the last period
(2011) under different nature moves.
(TABLE 4.2 is about here)
4.2.4 Backward Induction
If Quanta decides to invest in the project at the beginning (2008), the sequential game
will be formed.
(FIGURE 4.1 is about here)
FIGURE 4.1 illustrates the cash flow of the last period if the market moves up
decide whether it should invest in the last period (2011). If Others chooses to invest,
Quanta will become the Stackelberg leader and Others will become the Stackelberg
follower. The cash flow of Quanta is NT$ 19,969,659(million), and the cash flow of
Others is NT$ 25,350,106(million). If Others decides not to invest, then Quanta will
become the monopolist. The cash flow of Quanta is NT$ 154,182,726(million), and
the cash flow of Others is NT$ 0. After that, the option value can be obtained through
the backward induction. On the other hand, a similar result can be obtained when the
market moves down (d).
0.412 19,969,659,434,487 +(1-0.412) 2,515,880,963,735 9,514,334,503,328 (1 0.02) × × = +
If Quanta decides to defer in the project at the beginning (2008), then the
simultaneous game will be formed. There exists two equilibrium of the simultaneous
game, one is pure strategy equilibrium, and the other is mixed strategy equilibrium. (FIGURE 4.2 is about here)
FIGURE 4.2 shows the simultaneous game with the extensive and normal form
in 2011 when the market moves up three times in the past three years. There exists
pure strategy equilibrium in this situation. If Quanta chooses invest in the project,
Others will decide to invest in it. However, if Quanta choose not to invest in the
project, Others will still decide to invest in the project, because Others will gain more
the optimal decision for Others. Under this decision from Others, Quanta will decide
to invest in it finally since Quanta can earn more cash flow through investing in the
multi-touch panel laptop project.
The other equilibrium is mixed strategy equilibrium. The derivation process is
showed in the Appendix 2.
According to the ultimate value, which is computed through the options game
methodology, the result shows that investing in the multi-touch panel laptop project is
optimal decision for Quanta, and the option value is NT$ 2,082,601(million). FIGURE
4.3 illustrate the route of the decision tree for the project. FIGURE 4.4 and FIGURE 4.5
show the decision route if the market moves up and down respectively.
(FIGURE 4.3 is about here)
(FIGURE 4.4 is about here)
(FIGURE 4.5 is about here)
4.3 Scenario Analyses
The result of the case study is influenced by many parameters, such as the market
demand θ , volatility σ , risk-free rate , and invested capital r I . Based on
different information which provided by different research institutes, the value of
parameters is varied. Before starting analyses, we here compare the value with game
(TABLE 4.3 is about here)
TABLE 4.3 shows the option value with game theory, and the option value
without game theory. We can easily find that the option value without game theory is
lower than it with game theory. This is because the option value without game theory
deliberates less situation so that has lower value; on the other hand, the option value
with game theory not only considers the possible situation but also deliberates the
competitors’ decision.
(TABLE 4.4 is about here)
In order to simplify the structure of the tree, we classify the time period into
three years, two years, and one year. The shorter time period which considers fewer
situations causes less option value. TABLE 4.4 presents the result of the simplification.
(TABLE 4.5 is about here)
TABLE 4.5 exhibits the option value of investment and deferral and the
decisions at the beginning when the theta of Quanta changes. Investing in the project
in the first period will be the optimal decision for Quanta when the market demand of
the touch panel laptops is greater than the base case ( = 20,643,414). Conversely,
Quanta will choose to defer at the beginning when the market demand is less than
10,000,000.
2008
Quanta
(TABLE 4.6 is about here)
TABLE 4.6 shows the influences of the changes of the volatility. Higher
volatility has both higher investment value and deferral value because the market
faces more uncertainty in the future. Quanta will decide not to invest in the project if
the volatility is less than 0.1.
(TABLE 4.7 is about here)
TABLE 4.7 presents the decision outcomes and option value when the risk-free
rate changes. Risk-free rate not only affects the discount rate directly but influences
the risk-neutral probability indirectly. No matter how the risk-free rate shifts, it can be
found that investing in the project is the optimal decision for the managers of Quanta.
(TABLE 4.8 is about here)
(TABLE 4.9 is about here)
At the beginning of this chapter, we assume that the first mover will obtain 5
percent additional quantity. TABLE 4.8 illustrates the results while the increment of
the ratio changes. This additional quantity has to be equal or more than 3 percent
since the other additional quantity is 3 percent when the market moves down. This
table shows that Quanta will choose to invest in the project whether the additional
quantity increases or decreases. On the other hand, TABLE 4.9 exhibits the changes of
to equal or less than 5 percent since the additional ratio of the up moves for the first
mover is 5 percent. This table shows that investing in the project is still the optimal
decision for Quanta because this assumption is an accommodating decision, which
TABLE 4.1
R&D Expenses of Quanta and PixArt for Touch Panel Laptops
Year Quanta PixArt
2007 2,335 256
2008 3,108 538
Total 6,239 Unit: NT Million Dollars
TABLE 4.2
Estimated Quantity of Touch Panel Laptops in 2011
Nature Moves Quantity of Quanta Quantity of Others u, u, u 163,737,157 237,666,964 u, u, d 67,043,078 97,314,043 u, d, u 67,043,078 97,314,043 d, u, u 67,043,078 97,314,043 u, d, d 27,451,156 39,845,769 d, d, u 27,451,156 39,845,769 d, u, d 27,451,156 39,845,769 d, d, d 11,240,027 16,315,069
FIGURE 4.1
Outcome of the Up Moves of the Market in 2011
Unit: NT Million Dollars
FIGURE 4.2
Outcome of the Simultaneous Game with the Extensive Form in 2011
Normal Form Invest Defer Invest (14390163, 25149785)* (139847697, 0) Defer (0, 139257502) (0, 0) Unit: NT$ million 2010 θ 9,51 4,3 35 12 ,12 8,3 97 ⎡ ⎤ ⎢ ⎥ ⎣ ⎦ S S M M Others D D I I d u Others 19 ,96 9,6 59 2 5,3 50,106 ⎡ ⎤ ⎢ ⎥ ⎣ ⎦ 15 4,1 82,72 6 0 ⎡ ⎤ ⎢ ⎥ ⎣ ⎦ 2 ,515 ,88 1 3,281 ,50 3 ⎡ ⎤ ⎢ ⎥ ⎣ ⎦ 2 2,5 63 ,18 8 0 ⎡ ⎤ ⎢ ⎥ ⎣ ⎦ 14 ,39 0,1 63 2 5,1 49 ,78 5 ⎡ ⎤ ⎢ ⎥ ⎣ ⎦ C I 139 ,84 7,69 7 0 ⎡ ⎤ ⎢ ⎥ ⎣ ⎦ 0 139,257,502 ⎡ ⎤ ⎢ ⎥ ⎣ ⎦ 0 0 ⎡ ⎤ ⎢ ⎥ ⎣ ⎦ M A M D D I Others Others 2010 d u θ Others Quanta
FIGURE 4.3
Route of the Decision Tree (Investing)
FIGURE 4.4
Route of the Decision Tree (Deferring; up moves)
FIGURE 4.5
Route of the Decision Tree (Deferring; down moves)
TABLE 4.3
Comparison between Option Value with Game and Option Value without Game Status Value of Investment Value of Deferral Decision Value with Game 2,082,602 1,953,029 Invest
Value without Game 507,769 1,481,771 Defer
Unit: NT Million Dollars
TABLE 4.4
Reduced Form of the Time Period
Time Period Value of Investment Value of Deferral Decision
3 Years 2,082,601 1,953,029 Invest
2 Years 1,498,260 1,507,340 Defer
1 Year 896,762 764,978 Invest
Unit: NT Million Dollars
TABLE 4.5
Scenario Analysis of Theta of Quanta
Theta of Quanta Value of Investment Value of Deferral Decision
80,000,000 8,770,006 -46,674 Invest 60,000,000 6,516,708 2,745,245 Invest 40,000,000 4,263,410 2,605,089 Invest 2008 Quanta
θ
=20,643,414 2,082,601 1,953,029 Invest 10,000,000 883,463 1,010,7681 Defer 7,000,000 5454,468 714,785 Defer 5,000,000 320,139 335,608 DeferTABLE 4.6
Scenario Analysis of Volatility
Volatility Value of Investment Value of Deferral Decision
0.9 10,035,469 5,853,617 Invest 0.8 7,249,203 3,315,002 Invest o.6 3,399,745 3,166,193 Invest
σ
= 0.4465 2,082,601 1,953,029 Invest 0.2 1,049,097 1,234,717 Defer 0.1 893,873 1,100,404 Defer 0.05 864,189 1,066,856 DeferUnit: NT Million Dollars
TABLE 4.7
Scenario Analysis of the Changes of Risk-free Rate
Risk-free Rate Value of Investment Value of Deferral Decision
0.20 3,236,907 3,133,771 Invest 0.10 2,604,490 2,515,210 Invest 0.05 2,279,281 2,173,702 Invest r= 0.02 2,082,601 1,953,029 Invest 0.01 2,016,938 1,875,862 Invest 0.005 1,984,105 1,836,456 Invest 0.001 1,957,841 1,804,497 Invest
TABLE 4.8
Scenario Analysis of the Increment Changes of Up Moves
Increment of Up Moves Value of Investment Value of Deferral Decision
0.20 4,227,806 2,932,966 Invest 0.15 3,370,562 1,036,882 Invest 0.10 2,662,820 2,393,075 Invest u Increment = 0.05 2,082,601 1,953,029 Invest 0.04 1,980,112 1,875,365 Invest 0.03 1,881,796 1,795,272 Invest
Unit: NT Million Dollars
TABLE 4.9
Scenario Analysis of the Increment Changes of Down Moves
Increment of Down Moves Value of Investment Value of Deferral Decision
0.05 2,123,824 1,908,965 Invest 0.04 2,103,030 1,956,614 Invest d Increment = 0.03 2,082,601 1,953,029 Invest 0.01 2,042,820 1,952,113 Invest 0.005 2,033,095 1,952,929 Invest 0.001 2,025,379 1,953,802 Invest
Section 5 Conclusions
The model of this thesis follows the theoretical frameworks from Smit and Trigeorgis
(2004). We implement the model to the laptop OEM/ODM industry with four-stage
game under complicated market structures. Under the conditions of the price
competition and the duopoly market, this study assumes that the first mover, the
company which invests in the project first, can obtain 5 percent additional quantity
when the market moves up and 3 percent additional quantity when the market moves
down. This study uses the real options game methodology which considers the market
uncertainty but deliberates Quanta’s competitors’ reactions including Compal
Electronics, Inc., Wistron Corporation, and Inventec Corporation; the result
demonstrates that the optimal decision of Quanta, the leader company of the industry,
is to invest in the multi-touch panel laptop project in the first period (2008).
Besides, there are four vital results of the scenario analyses. First of all,
investing in the project in the first period will be the optimal decision for Quanta
when the market demand of the touch panel laptops is greater than 20,643,414.
Conversely, Quanta will choose to defer the project at the beginning when the market
demand is less than 10,000,000.
Secondly, higher volatility has higher investment value and deferral value.
Thirdly, no matter how the risk-free rate shifts, it can be found that investing in
the project is the optimal decision for Quanta.
Finally, if the market moves up, Quanta which is the first mover, will choose to
invest in the project when the additional quantity is more than three percent.
Accordingly, if the market moves down, investing in the project is still the optimal
decision for Quanta when the additional quantity is less than three percent.
By the way, there are two recommendations that we can do for the future
research. Firstly, the demand function of the Bertrand duopoly price competition
model can be modified to fit the status of the laptop OEM/ODM market appropriately.
Secondly, the competiton in the laptop OEM/ODM market is fierce recently. For
example, the total shipment of Wistron in the fourth quarter of 2008 is more than the
shipment of Compal. Moreover, the total shipment of Compal in March of 2009
surpasses the total shipment of Quanta. We recommend that the decision tree be
Appendixes
Appendix 1
Derivation of Equilibrium Prices
We assume for simplicity that the demand for the laptops is linear in prices:
( , , )
i i j it it i j
Q P P θ = θ − b P + d P (A.1)
where the quantity which is sold by company is related to its price and the
competitors’ price . Besides, The coefficients and ( , assuming
demand substitutes) capture the sensitive of the quantity sold to the firm’s own and its
competitor’s price settings, respectively. The profits of each firm i (where =
Quanta or Others) are given by
i Pi j P b d b>0 d >0 i , , ( , , ) ( )( ) i P Pi j i t P ci i i t bP dPi j π θ = − θ − + (A.2) The reaction function of each firm i is gained by maximizing its profit value
( , ) i i i j
V P P
k
π
≡ over its own price , where is a constant risk- adjusted discount rate. Setting i P k 0 i i V P ∂ = ∂ , obtains , ( )(1 ) ( ) (2 ) i t j i i i i j i dP bq bc P R P b bq θ + + + = = + (A.3)
A company engaged in price competition has a best (profit-maximizing) response
to competitor price changes according to its reaction function. Substituting the expression for R P in place of i( j) in equation (A.1) gives the general asymmetric
Nash equilibrium price expression: j
, , * 2 2 2 ( ) ( ) 4 i t i j t j i b bc d bc P b d θ + + θ + = − (A.4)
If firm i invests first and firm j defers until next period (I,D), the leader will
choose the price that maximizes its own profit value, using the reaction function of the follower. Maximizing V P R Pi( ,i j( ))i over Pi , given R Pj( )i , gives a Stackelberg leader price (for qi = qj= 0):
, , 2 2 2 ( ) ( ) 4 2 i t i j t j i i b bc d bc dc P b d θ + + θ + − = − (A.5)
Taking the Stackelberg leader price into its competitor’s reaction function R P j( )i
gives the Stackelberg follower price:
2 2 2 2 2 , , , 2 2 (4 2 ) 2 ( ) ( ) (4 2 ) ( ) 2 (4 2 ) j t i t i j t j i j j j i b d db bc d bc dc bc b d P R P b b d θ − + θ + + θ + − + − = = − (A.6)
Appendix 2
Mixed Strategy Equilibrium
7Let the decision nodes labeled by an indicator set I = {1, 2, …, n}. At node i, the action set is Ai =
{
a a1i, 2i, ...,ani}
. An individual’s behavior at node i is determined by a probability vector IPi =(
p a( ), (1i p a2i), ..., ( ain))
, and the set of pure strategies is given by the cross-product of all the action sets: si =A1×A2× ×... An. When there is only a single decision to be made, the sets of actions and pure strategies are identical.However, if there is more than one decision to be made, the action sets and pure
strategies are no longer identical and there are now two. To distinguish between them,
we shall call one a “mixed strategy” and the other a “behavioural strategy.”
A mixed strategy δ specifies the probability ( )p s with which each of the pure
strategies s∈S . Suppose the set of strategies is S =
{
s s sa, , then a mixed b, c, ...}
strategy can be represented as a vector of probabilities: δ =( ( ), ( ), ( ), ...)p sa p sb p sc .Consider a two player two action game with arbitrary payoffs:
P2
Invest Defer Invest (a, b) (c, d)
Defer (e, f) (g, h) P1
Usually, we will denote the probability of using the pure strategies s by p s ( ) for player 1, and q s( ) for player 2. The payoffs for mixed strategies are then given by
1 1 2 2 1 2 1 2 1 2 ( , ) ( ) ( ) ( , ) i s S s S i p s q s s s π δ δ π ∈ ∈ =
∑ ∑
× × (A.7) In this game, we look for a mixed strategies Nash equilibrium using the Equalityof Payoffs: let (δ1,δ2) be a Nash equilibrium, and let be the support of . Then . ∗ 1 S δ1∗ ) , ( ) , ( 1 δ2∗ =π δ1∗ δ2∗ πi s i ∀s∈S1∗ Then ) ( ) ( ) 1 ( ) 1 ( ) , ( ) , ( 2 1 2 1 a e g c g c q q g eq q c aq D I − + − − = ⇔ − + = − + ⇔ = ∗ ∗ ∗ ∗ ∗ ∗ ∗ π δ δ π and