國
立
交
通
大
學
生物資訊所
碩
士
論
文
蛋白質結構摺疊新能量函式的最佳化
Optimizing New Energy Functions for Protein Folding
研 究 生:邱一原
指導教授:楊進木 教授
黃鎮剛 教授
蛋白質結構摺疊新能量函式的最佳化
Optimizing New Energy Functions for Protein Folding
研 究 生:邱一原 Student:Yi-Yuan Chiu
指導教授:楊進木 Advisor:Jinn-Moon Yang
黃鎮鋼
Advisor:
Jenn-Kang Huang
國 立 交 通 大 學
生 物 資 訊 所
碩 士 論 文
A Thesis Submitted to Institute of Bioinformatics
National Chiao Tung University in partial Fulfillment of the Requirements for the Degree of Master in
Bioinformatics
June 2005
Hsinchu, Taiwan, Republic of China
蛋白質結構摺疊新能量函式的最佳化
學生:邱一原 指導教授:楊進木
黃鎮剛
國立交通大學生物資訊所碩士班
摘 要
蛋白質結構預測的方法中,一個可行的策略是產生大量可能的結構,再依據計分 函式或能量函式從中挑選出最適當的結構。蛋白質摺疊的結構範圍相當廣闊,直接利 用計算方法產生出類似自然結晶結構的結構有相當的難度;在理想的情況下,非自然 的摺疊結構或許可以提供相當的助益,利用非自然的摺疊結構來修正計分函式或能量 函式,並利用修正過後的計分函式或能量函式來分辨出自然和非自然的結構,也許是 個可行的方法。在這篇論文研究中,我們發展了兩個適用於蛋白質摺疊問題上的能量 函式,並且在常見的測試評量中有不錯的表現。其中的一個能量函式為 MOLSIM,是以 基本物理作用為基礎,所發展出的能量函式。另外一個能量函式是 GEMSCORE,也是以 物理作用為基礎,但是卻是以簡化過的物理公式來算能量。與其他利用物理作用所發 展出的能量函式不同的是設定的參數數量,一般以物理作用為基礎的能量函式可能會 需要幾百甚至幾千個參數設定。而我們的能量函式只針對不同的能量計算項目給予不 同的比例參數,並利用演化式方法來最佳化這些參數。我們詳細地分析和比較我們的 能量函式與之前其他研究者所發展的能量函式,在六個測試的資料中,包含有 96 種不 同的蛋白質,超過 70,000 個結構。MOLSIM 和 GEMSCORE 分別能從中辨識中 70 和 73 個 正確的自然結構。我們相信我們的能量函式夠快並且夠簡單,而且應用在結構預測上, 可以分辨出自然和非自然的結構。Optimizing New Energy Functions for Protein Folding
Student: Yi-Yuan Chiu Advisor: Dr. Jinn-Moon Yang
Student: Yi-Yuan Chiu Advisor:
Dr. Jenn-Kang Huang
Institute of Bioinformatics
National Chiao Tung University
Abstract
One strategy for protein structure prediction is to generate a large number of possible structures (decoys) and select the most fitting ones based on a scoring or energy function. The conformational spaces of a protein are huge, and chances are rare that any heuristically generated structures will directly fall in the neighborhood of the native structure. It is desirable that the unfitting decoy structures can provide insights into native structures, so prediction can be made progressively. In this thesis, we develop two simple energy functions for protein folding and show that their good performance with popular benchmarks. One is MOLSIM, a physics-based energy function; another is GEMSCORE, an empirical energy function based on physical mechanisms with simplified model. Instead of hundreds or thousands parameters used in other physics-based energy functions by previous authors, we adopt only few overall weights and use an evolutionary algorithm to optimize the parameters of these two energy functions. Here we present a systematic comparison of our results with the works based on physics-based energy functions by previous authors. Six testing decoy sets, including 96 protein sequences with more 70,000 structures were evaluated. There are 70 and 73 native proteins that identified from these decoy sets with MOLSIM and GEMSCORE, respectively. We believe that our energy functions are fast and simple to discriminate between native and nonnative structures for protein structure prediction.
Acknowledgements
The most appreciation is for my advisors, Dr. Jinn-Moon Yang and Dr. Jenn-Kang Huang. Because of their advices and instructions, I could finish this thesis. I am very grateful for Dr. Jenn-Kang Huang and thanks for his suggestions on energy functions and molecular dynamic. He helped me to understand the problem of protein folding and how to solve mistakes. I also thank goes to my thesis adviser, Dr. Jinn-Moon Yang. Without his suggestions and comments on writing thesis and GEMSCORE, I can’t accomplish this work. Thanks my two advisors very much.
I also must thank to everyone in Yang’s lab. We work together, and have funs together. Thanks for guys who discuss with me, especially Hung-Chu Chen. Thanks for their company with me during past two years. Finally, I would thank my whole family, for their support during past twenty-four years.
Table of Contents
摘 要...i Abstract...ii Acknowledgements ...iii Table of Contents...iv List of Tables ...v List of Figures...vii Chapter 1 Introduction...11.1 Protein Structure Prediction and Energy Functions...1
1.2 Related Works...2
1.3 Evolutionary Algorithms ...5
Chapter 2 Materials and Methods...8
2.1 Energy Functions...8
2.1.1 MOLSIM : physics-based energy function ...8
2.1.2 GEMSCORE : empirical energy function... 11
2.2 Optimization ...13
2.2.1 Representation and Initiation...14
2.2.2 Family Competition Evolutionary Algorithm (FCEA) ...14
2.2.3 Recombination and Mutation Operators...15
2.2.4 Objective Function of FCEA...17
2.3 Data Sets of Decoys...19
2.3.1 Training Sets...19
2.3.2 Testing Sets ...20
Chapter 3 Results and Discussions...24
3.1 Parameters in optimization ...24
3.2 Results of training set ...25
3.3 Test with popular benchmarks ...26
3.4 Hydrogen-bonding interactions in GEMSCORE ...28
3.5 Solvent effects in MOLSIM/GEMSCORE ...30
3.6 MOLSIM vs. GEMSCORE...31
Chapter 4 Conclusions and Future Works ...33
4.1 Conclusions ...33
4.2 Future Works ...33
List of Tables
Table 1. The energy terms and descriptions in MOLSIM and GEMSCORE... 35
Table 2. Atomic formal charge used in GEMSCORE...36
Table 3. The training set and testing sets... 37
Table 4. Variations of parameters of MOLSIM with different population sizes and the maximum number of generations of FCEA is set to 200 ...38
Table 5. Variations of parameters of MOLSIM with different maximum number of generations and the population size is set to 200 ...39
Table 6. Variations of parameters of GEMSCORE with different population sizes and the maximum number of generations of FCEA is set to 200 ...40
Table 7. Variations of weights of GEMSCORE with different maximum number of generations and the population size is set to 200 ...41
Table 8. The final weights of MOLSIM and GEMSCORE for energy terms ...42
Table 9. Content of the training decoy set ...43
Table 10. Content of the EMBL misfolded decoy set ...44
Table 11. Content of the 4state_reduced decoy set ...45
Table 12. Content of the local minima decoy set...46
Table 13. Content of the lattice_ssfit decoy set ...47
Table 14. Content of the fisa decoy set...48
Table 15. Content of the Rosetta all-atom decoy set ... 49
Table 16. Summary of our results and comparison with previous works on six testing data sets ...51
Table 18. Comparison of our methods with previous works on 4state_reduced decoy set
with refined 3icb...53
Table 19. Comparison of our methods with previous works on local minima decoy set ...54
Table 20. Comparison of our methods with previous works on lattice_ssfit decoy set...55
Table 21. Comparison of our methods with previous works on fisa decoy set ...56
Table 22. Comparison of GEMSCORE with different hydrogen-bond potentials, EHB and EbHB, on six testing sets ...57
Table 23. Comparison of different hydrogen-bonding potentials, EHB, EbHB, and EnbHB on 4state_reduced decoy set ...58
List of Figures
Figure 1. The flowchart of training step and testing step, including decoy sets preparation, energy calculation, and optimization...60 Figure 2. The linear energy function of the pairwise atoms for the van der Waals interactions
and hydrogen bonds, and electrostatic potential in GEMSCORE. ...61 Figure 3. The definition of a hydrogen bond used in GEMSCORE...62 Figure 4. Performances of (a) MOLSIM and (b) GEMSCORE on different structure
determination by X-ray and NMR on training set...63 Figure 5. The scatter plots of correlations between the energies and the all-atom RMSD of
decoys from their corresponding native structures on 4state_reduced decoy set using (a) MOLSIM energy function and (b) GEMSCORE energy function. ...64 Figure 6. The location of calcium ions in the three-dimension structure of protein 3icb in
4state_reduced decoy set.. ...65 Figure 7. The scatter plots of correlations between the energies and the all-atom RMSD of
decoys from their corresponding native structures on lmds decoy set using (a) MOLSIM energy function and (b) GEMSCORE energy function. ...66 Figure 8. The native structures of misidentified targets, (a) 1b0n-B and (b) 1fc2-C, in local minima decoy set (lmds) ...67 Figure 9. The scatter plots of correlations between the energies and the all-atom RMSD of
decoys from their corresponding native structures on lattice_ssfit decoy set using (a) MOLSIM energy function and (b) GEMSCORE energy function. ...68 Figure 10. The scatter plots of correlations between the energies and the all-atom RMSD of
decoys from their corresponding native structures on fisa decoy set using
Figure 11. Performances of (a) MOLSIM and (b) GEMSCORE on different structure determination by X-ray and NMR on five testing sets...70 Figure 12. Comparison of different hydrogen-bonding potentials, EHB, EbHB, and EnbHB on
Chapter 1 Introduction
1.1 Protein Structure Prediction and Energy Functions
Protein structure prediction (PSP) at atomic detail, which is an important aspect of the protein folding problem, remains one of the fundamental unsolved problems in the field of computational structural biology. The PSP computational method involves two basic critical elements: an efficient search method and a reliable energy function. The former should be able to search a large number of potential structure candidates with reasonable accuracy and speed. Energy functions for PSP should effectively discriminate between the native structure and non-native structures during the search structure candidates.
Many methods have been proposed to for PSP by generating a reliable structure from a given sequence whose structure is unknown. These methods are separated into three categories: homology modeling (comparative modeling), fold recognition (threading), and
ab initio folding. The main concept of homology modeling and fold recognition is to find
out the best known structure as template for a given target sequence. The evolutionary relationship can be deduced from sequence similarity [1-3] or by threading a sequence against a library of structures and selecting the best match [4, 5]. Then generate candidate structures by aligning the target sequence and the template structure. The template selection and alignment are the critical steps for modeling methods.
Unlike homology modeling and fold recognition, ab initio folding generates candidate structure only from sequence information. No dependence on database information is needed and predictions are based on sampling of the protein conformational space to optimize an energy function [6-14]. In one possible scenario for selecting the most reliable structure, a large number of candidate structures are generated and evaluated with an energy
function that can distinguish the native and misfolded ones (decoys).
Regardless of which class a prediction method belongs to, an effective energy function is usually required. These functions are typically used in one of two ways: they are either used as optimization criteria to drive conformational search algorithms to sift through the conformational space (folding problem) or they are used as selection criteria to select a conformation from a set of possible structures (reverse folding problem). Energy functions of PSP computational methods are generally rooted in the thermodynamic hypothesis that the native-state conformations is the most stable conformation and, therefore, must occupy the lowest energetic state [15]. Effective energy functions that can accurately depict the energy landscape of protein conformation space are a common requirement for all computational approaches to the PSP problem. Toward the aim of developing such energy functions, three different types of approaches are under investigation: knowledge-based energy functions, physics-based energy functions.
1.2 Related Works
Knowledge-based energy functions are generally derived from distributions of experiment structural data [16, 17]. A previous comparative study showed that knowledge-based functions usually perform better [18]. This is part of the reason that most previous works have been focused on knowledge-based energy functions in structure prediction applications [16, 17, 19-21]. Given a database of high-quality structural information, knowledge-based energy functions can often produce the desired results with far less computational overhead. However, there are a few exceptions. For example, the Park et al. compared various knowledge-based and physics-based functions and found that the knowledge-based functions are not better than physics-based functions at ranking native structures [22]. In addition, the Tobi et al. showed that it is not possible to find a pairwise
knowledge-based potential with a resolution of 1 Å or better [23, 24].
Energy functions derived from experimental structure information are constrained by their underlying statistics, which means that their accuracy and applicability are intrinsically tied to the data source used for parameterization; if the particular data set overrepresents a certain class of structural properties (e.g., helical structures), the resulting energy function would also reflect this statistical bias in its scoring. For the reasons of simplification and fast, reduced representation are usually used in knowledge-based energy functions. These energy functions may contain pseudo-potentials which lack the physical meanings.
On the other hand, physics-based energy functions are based on physical mechanisms. And they do not have such inherent limitations when they are carefully parameterized. Because they are derived from ab initio quantum mechanical calculations based on the principles of physics alone, they do not have any intrinsic bias toward any particular structural properties. Physics-based approaches assume that the protein potential energy functions can be broken down into terms of bond stretching, angle bending, torsional, and non-bonded interactions. These parameters in these terms are then fitted to high-level ab
initio quantum mechanical calculations and small molecule thermodynamic and
spectroscopy data. The advantage of a physics-based energy function is the clear physical meaning of each individual term. Great efforts have been invested to understand the driving forces or dominant forces in its discriminative ability.
Despite their perceived advantages, physics-based energy functions have not been widely considered practical for fold recognition or protein structure prediction types of applications. This finding was mostly due to the high-computation cost required and the cumulative inaccuracies introduced in parameterization of the energy functions compounded by the fact that most of the earlier energy functions were calibrated against
rather sparse and often qualitative experimental data. Because of the continued improvement in computer speed and advances in energy function design, this situation has begun to change in recent years; physics-based energy functions are now showing signs of living up to their potential [25-33].
As more new energy functions are being developed, one problem that became apparent was the lack of a standardized benchmark to allow comparisons of performances across different energy functions parameterized by using different properties and methodologies. One of the earliest studies that resembled a benchmarking test for protein potentials was the study carried out by Novotny et al. [34], in which two proteins with the same number of residues but different folds were considered and the sequence of one was “threaded” onto the fold of the other. The resulting correct and incorrect models were then evaluated with use of the CHARMM potential. The conclusion of this study was frequently misinterpreted as supporting evidence that modern molecular mechanics-based potentials were not of sufficient accuracy to discriminate between native and non-native folds.
In the spirit of the Novotny test, several groups have created decoy sets (non-native or near-native conformations) as a testing benchmark for evaluating the usefulness of a new scoring function [22, 35-37]. These decoy sets provide an objective common platform on which new energy functions can be evaluated. Furthermore, one may also view the decoys as the products of a previous step in a hierarchical structure prediction scheme; a high-quality scoring function could then be integrated as a filter to select the best candidate from among a set of low-resolution prediction of the native fold.
Another problem for developing a physics-based energy function is that the determination of potential parameters is conceptually and practically difficult. Although it would seem the most deductive and logical, determining potential parameters solely from
electronic structure calculation of small molecules does not necessarily give the best performance for modeling proteins in solvent. Instead of this bottom-up approach, we might ask whether we can infer physical forces from their consequences, that is, the structures of proteins already in the structural database. Recently, structural genomics projects have started to produce thousands of 3D protein structures. If we can use this information to improve protein energy functions, this would yield energy functions that are practically powerful for many purposes and should be conceptually helpful for gaining insight into the physical principles of protein architecture.
In this thesis, we try to develop a new energy function that combine the advantages both of knowledge-based and physics-based energy functions and avoid the disadvantages of them. We used simplified energy terms physical mechanisms to form our energy functions. In order to optimize the parameters of our energy functions for protein folding, we adopt a reduced optimization scheme that to consider the overall weight for each energy term as the parameter of each energy term. For our purpose, we use an evolutionary algorithm and a well-developed decoy sets as our training set to optimize the overall weights.
1.3 Evolutionary Algorithms
An evolutionary algorithm is a generally adaptable concept for problem solving, especially difficult optimization problems. It is based on ideas genetics and natural selection. First, a problem is coded to a chromosome, which is represented as solution and initialed randomly. Then find out batter solution in searching space by mutations and crossovers. Selection is most important step in an evolutionary algorithm. It is decided by the objective function of an evolutionary algorithm to pick up the batter solution. It is finished when find a reliable solution by repeating mutation, crossover, and selection again and again.
Evolutionary algorithms have been used to solve problems involving large search spaces where traditional optimization methods are less efficient. They were applied to many biological problems in varying ways. Currently, there are about three main independently developed but strongly related implementations of evolutionary algorithms: genetic algorithms [38], evolution strategies [39], and evolutionary programming [40].
In general the coding function of genetic algorithms was binary-represented. These genetic algorithms may introduce an additional multimodality, making the combined objective function more complex than the original function. To achieve better performance, real-coded genetic algorithms [41, 42] have been introduced. However, they generally employ random-based mutations and hence, still require lengthy local searches near local minimums. In contrast, evolution strategies and evolutionary programming [43, 44], mainly use real-valued representation and focus on self-adaptive Gaussian mutations. This type of mutation has succeeded in continuous optimization and has been widely regarded as a good operator for local searches. Unfortunately, experiments [45] show that self-adaptive Gaussian mutation leaves individuals trapped near local minimums for rugged functions.
Because none of these three types of original evolutionary algorithms is very efficient, many modifications have been proposed to improve solution quality and to speed up convergence. Such a hybrid approach may make a better tradeoff between computational cost and the global optimality of the solution. However, for existing methods local search techniques and genetic operators often work separately during the search process. Family competition evolutionary algorithm (FCEA) is proposed to improve the above approaches and has a good performance for many problems.
FCEA is a multi-operator approach that combines three mutation operators: decreasing-based Gaussian mutation, self-adaptive Gaussian mutation, and self-adaptive
Cauchy mutation. It incorporates family competition [46, 47] and adaptive rules for controlling step sizes to construct the relationship among these three operators. To balance the search power of exploration and exploitation, each of operators is designed to compensate for the disadvantages of the other.
In this thesis, we use the FCEA to look for the most suitable weights of energy terms for protein folding. The next section describes the energy functions and the details of FCEA, such as the scoring function and the representation. In the third section, we analyze the performance on training set and test our energy functions with optimal weights by popular benchmark testing sets. We also discuses the differences of energy functions in many situations. Conclusions and future works are drawn in the fourth section.
Chapter 2 Materials and Methods
For a realizable energy function for protein folding, we adopted two physics-based energy functions which developed for different problems. We modified these energy functions and optimized them using evolution algorithm. One of them is MOLSIM that is based on physical mechanism and originally developed for molecular dynamics. Another is modified from the energy function of GEMDOCK [48, 49] used in protein-ligand docking.
Figure 1 shows the flowchart of training and testing steps. The quality of native structures and decoy structures are not generally well and there are some errors in these structures, like lack of coordinates of atoms. First, we filter these error structures or incomplete structures in training set and testing sets. Second, calculate the energy values of each native and decoy structures in training set using our energy functions. Then, optimize the overall weights of energy terms in energy functions by evolutionary algorithm, FCEA, and get these optimal weights. Repeat above steps until convergence or maximum generations of FCEA. Final, apply these weights into our energy functions and calculate the energy values of the structures in four testing sets and analyze the results and performances. Through these steps, we train the optimal weights of energy terms and judge the quality of our energy functions with benchmarks.
2.1 Energy Functions
2.1.1 MOLSIM : physics-based energy function
MOLSIM is a physics-based energy function developed for molecular dynamics and simulation by Professor Jenn-Kang Huang. This energy function is based on physical mechanisms contain bond stretching, angle bending, torsional, and non-bonded interactions as other force fields for molecular dynamics.
The complete energy function is given as
Etot = Ebond + Eangle + Etorsion + Eelect + EvdW, (1)
where Ebond is covalent bond potential, Eangle and Etosion are bond angles and torsion angles
potentials, respectively. Eelect and EvdW are electrostatics potential and van der Waals
potential, respectively. MOLSIM uses these physics-based potentials for molecular dynamics and simulation. MOLSIM is all-atom energy function and polar hydrogen atoms are needed in the energy function. Therefore, there are several steps before the energy calculation.
First, MOLSIM program reads the information of protein structure from PDB-format file including coordinates of atoms and residue information. At secondary step, store the structure information with templates of 20 amino acid libraries and check the lacks of atoms and the errors of residues. Then, add the polar hydrogen atoms in specific location defined in the templates. The additional hydrogen atoms may lead to form steric crashes. Energy minimization, steepest descent, is used to reduce steric crashes. After energy minimization, we get the final structure for energy calculation.
Structures may crash or fold to another structure during long molecular dynamic, it could bring some errors and reduce the effect of protein energy functions. The energy values of native and decoy structures are calculated after energy minimization and no more dynamic steps is needed.
Physical mechanisms used in MOLSIM contain bond stretching, angle bending, torsional, and non-bonded interactions. In this thesis, we simplify the original energy function by removing bonded interactions which includes bond stretching, angle bending, and torsional interactions. We consider the energy terms of non-bonded interactions, Eelect
and EvdW, and add extra solvation energy (ESAS) to form new MOLSIM energy function. The
physics-based energy function, MOLSIM, we used is given as
Etot = Eelect + EvdW + ESAS. (2)
The electrostatic energy (Eelect) between atoms i and j is
∑∑
= = = N i N j ij j i elect r q q E 1 1 332 , (3)where rij is the distance between the atoms i and j, qi and qj are the atomic partial charges of
atoms i and j. and 332 is a factor that converts the electrostatic energy into kilocalories per mole. The van der Waals potential used here is Lennard-Jones 6,12 potential:
∑∑
= = − = N i N j ij ij vdW r B r A E 1 1 12 6 ) ( , (4)where rij is the distance between the atoms i and j, A and B are constants and predefined by
different atom types. For reducing the computational resource, a cutoff of non-bonded interactions, 6.0 Å, is adopted during energy calculation.
The solvent effect is an important potential in protein folding. Many methods are proposed to this issue, for example atomic solvation parameters (ASPs) [50, 51] and generalized Born model (GB) [52] . In this thesis, we use ASPs to approximate to the solvation energy. The solvation energy is calculated by ASPs and solvent-accessible surface area.
The solvation energy, ESAS, is given as
∑
= = N i i i sas A E 1 σ , (5)where σi is the atomic salvation parameter (ASPs) for atom type i, and Ai is the Lee and
Richards solvent-accessible surface area of atom type i. In our calculations, we use a probe radius of 1.4 Å to simulate a water molecule to calculate atomic solvent-accessible surface area. We divide all atoms into six atom types: C, non-charged O, non-charged N, S, charged O, and charged N, used with Eisenberg et al. [50, 51]. Table 1 shows the detail the description of each energy term.
2.1.2 GEMSCORE : empirical energy function
In this thesis, we developed another empirical energy function modified from GEMDOCK [48, 49]. The energy function of GEMDOCK has a good performance in flexible protein-ligend docking [48, 49] and screening [53, 54]. GEMDOCK was developed well for docking problem, but there are different between docking problem and protein folding. We need to revise the original energy function of GEMDOCK and redevelop a new empirical energy function by adding other energy terms for protein folding problem.
The energy function of GEMDOCK is given as
Etot = Einter + Eintra + Epenal, (6)
where Einter and Eintraare the intermolecular and intramolecular energy, respectively, Epenalis
a large penalty value. We only retain Einter and use ASPs and solvent-accessible surface area
as energy term of solvent effect (ESAS). Einter is including electrostatic energy, simplified van
der Waals and hydrogen-bonding potentials. As for the requirement of later optimization, we divide the intermolecular energy (Einter) to three terms: electrostatic energy (Eelect), van
der Waals potential (EvdW) and hydrogen-bonding potential on backbone (EbHB).
Etot = Eelect + EvdW + EbHB + ESAS. (7)
Electrostatic energy, Eelect, is based on general Columbic electrostatic function:
∑∑
= = = N i N j ij j i elect r q q E 1 1 4 2 332 , (8)where rij is the distance between the atoms i and j, qi and qj are the formal charges and 332
is a factor that converts the electrostatic energy into kilocalories per mole. The formal charge of atoms is indicated in Table 2. In order to decrease the incorrect situation, we set the low bound of electrostatic energy to -10 (see Figure 2).
The van der Waals potential, EvdW, and hydrogen-bonding potential on backbone, EbHB,
are both simplified atomic pair-wise potential functions (see Figure 2). In this model, these two potentials are calculated by the same function form but with different parameters. The model is given as ⎪ ⎪ ⎪ ⎪ ⎪ ⎪ ⎪ ⎩ ⎪⎪ ⎪ ⎪ ⎪ ⎪ ⎪ ⎨ ⎧ − − − − − − = 0 3 ) 3 ( ) ( , 4 5 5 5 1 2 1 5 1 6 6 V V V V V V V V V V V V V E E
r
r
r
ij ij ij B ij B ij B ij bHB vdW if . (9) V <r
≤ 1 Vr
Bij ij ≤ 2 1 V Vr
Bij ij ≤ < 3 2 V ij B ij 4 3 V Vr
Bij ij ≤ < 4 Vr
Bij ij >r
Bijij is the distance between the atoms i and j with the interaction type Bij forming by the
atomic pairwise where Bij is a state of either van der Waals potential or hydrogen-bonding
Figure 2. The value of the hydrogen-bonding potential on backbone should be larger than the one of the van der Waals potential.
In order to calculate the value of the hydrogen-bonding potential, it is must to identify the hydrogen bond. We assigned hydrogen bonds according to the method used with Baker and Hubbard [55]. Figure 3 shows the definition of a hydrogen bond used in GEMSCORE. If the angle of N-H-O (θNHO) is more than 120∘and the distance between hydrogen atom and oxygen atom (rOH) is less than 2.5 Å, a hydrogen bond is assigned.
To decide hydrogen bonds, we have to add extra hydrogen atoms which don’t be contained in PDB-format file before energy calculation. Only the hydrogen bonds formed with both hydrogen atoms and oxygen atoms located at backbone are considered, and we ignore the hydrogen bonds located between backbone and side-chain or side-chain and side-chain.
The solvation energy, ESAS, which is the same as MOLSIM is given as
∑
= = N i i i sas A E 1 σ , (10) where σi is the ASPs for atom type i, and Ai is the Lee and Richards solvent-accessiblesurface area of atom type i. We use a probe radius of 1.4 Å to simulate a water molecule to calculate atomic solvent-accessible surface area. We divide all atoms into six atom types: C, non-charged O, non-charged N, S, charged O, and charged N, used with Eisenberg et al. [50, 51]. Table 1 shows the detail description of each energy term.
2.2 Optimization
The core idea of our evolutionary approach was to design multiple operators that cooperate using the family competition model [46, 47], which is similar to a local search
procedure. The Gaussian and Cauchy mutations, continuous genetic operators, search the weights for the energy terms.
2.2.1 Representation and Initiation
Our optimized method works as follows: It randomly generates a starting population with N solutions of weights for energy function. Each solution is represented as a set of 3n-dimensional vectors (xi, σi, ψi), where n is the number of energy terms of an energy function and i = 1,…,N, where N is the population size. The vector x is the adjustable variables representing a particular weights of a energy term to be optimized. σ and ψ are the step-size vectors of decreasing-based Gaussian mutation and self-adaptive Cauchy mutation. In other words, each solution x is associated with some parameters for step-size control. The initial step size σ is 0.8 and ψ is 0.2.
2.2.2 Family Competition Evolutionary Algorithm (FCEA)
After initializes the solutions, it enters the main evolutionary loop, which consists of 2 stages in everyone iteration: decreasing-based Gaussian mutation and self-adaptive Cauchy mutation. Each stage is realized by generating a new quasi-population (with N solutions) as the parent of the next stage. These stages apply a general procedure “FC_adaptive” with only different working population and the mutation operator. The FC_adaptive procedure employs 2 parameters, namely, the working population (P, with N solutions) and mutation operator (M), to generate a new quasi-population.
The main work of FC_adaptive is to produce offspring and then conduct the family competition. Each individual in the population sequentially becomes the “family father.” With a probability pc, this family father and another solution that is randomly chosen from
new offspring or the family father (if the recombination is not conducted) is operated by differential evolution to generate a quasi-offspring. Finally, the working mutation is operates on the quasi-offspring to generate a new offspring. For each family father, such a procedure is repeated L times, called the family competition length.
Among these L offspring and the family father, only the one with the lowest scoring function value survives. Since we create L children from one “family father” and perform a selection, this is a family competition strategy. This method avoids the population prematureness but also keeps the spirit of local searches. Finally, the FC_adaptive procedure generates N solutions because it forces each solution of the working population to have one final offspring. In the following, genetic operators are briefly described. We use a = (xa, σa, ψa) to represent the “family father” and b = (xb, σb, ψb) as another parent. The offspring of each operation is represented as c = (xc, σc, ψc). The symbol xsi is used to denote
the ith adjustable optimization variable of a solution s, ∀i {1,…, N}. ∈
2.2.3 Recombination and Mutation Operators
We implemented modified discrete recombination and intermediate recombination. A recombination operator selected the “family father (a)” and another solution (b) randomly selected from the working population. The former generates a child as follows:
⎪⎩ ⎪ ⎨ ⎧ = b i a i c i x x x with probability . (11) 2 . 0 8 . 0
The generated child inherits genes from the “family father” with a higher probability 0.8. Intermediate recombination works as
2 / ) ( a i b i a i c i w w w w = +β − , (12)
where w is σ or ψ based on the mutation operator applied in the FC_adaptive procedure. The intermediate recombination only operated on step-size vectors and the modified discrete recombination was used for adjustable vectors (x).
After the recombination, a mutation operator, the main operator of our evolutionary approach, is applied to mutate adjustable variables (x). Gaussian and Cauchy Mutations are accomplished by first mutating the step size (w) and then mutating the adjustable variable x:
) ( ' ' ) ( ' ⋅ + = ⋅ = D w x x A w w i i i i i , (13)
where wi and xi are the ith component of w and x, respectively. And wi is the respective step
size of the xi, where w is σ or ψ. A(·) is evaluated as exp[τ’N(0, 1) + Ni(0,1)] if the mutation
is a self-adaptive mutation, where N(0,1) is the standard normal distribution, Ni(0, 1) is a
new value with distribution N(0, 1) that must be regenerated for each index i. When the mutation is a decreasing-based mutation A(·) is defined as a fixed decreasing rate γ = 0.95.
D(·) is evaluated as N(0, 1) or C(1) if the mutation is, respectively, Gaussian or Cauchy. For
example, the self-adaptive Cauchy mutation is defined as
). ( )], 1 , 0 ( ) 1 , 0 ( ' exp[ t C x x N N i c i a i c i i a i c i ψ τ τ ψ ψ + = + = (14)
We set τ and τ’to( 2n)−1and( 2 2n)−1, respectively, according to the suggestion of
evolution strategies. A random variable is said to have the Cauchy distribution [C(t)] if it has the density function: . In this thesis, t is set to 1. Our decreasing-based Gaussian mutation uses the step-size vector σ with a fixed decreasing rate γ = 0.95 and works as σ
∞ < < −∞ + = t t y y t y f( ; ) ( /π)/( 2 2), c = γσa and ). 1 , 0 ( i c a c N x xi = i +σ
2.2.4 Objective Function of FCEA
For optimization, the energy function becomes
∑
=
i i i
w
E µ , (15)
where wi is the weight of energy term µi. Given an energetic weight set w (in this thesis, it’s
8 and 9 for MOLSIM and GEMSCORE, respectively), we used FCEA to look for the most suitable energy function by minimizing a well-developed objective function. Eight energy terms of MOLISM are define in Equations 2 and 5 and nine energy terms of GEMDOCK are define in Equations 7 and 10.
A successful energy function not only has to be able to correctly distinguish between native and native-like structures but must also do so convincingly. In the regard, the quality of an energy function is judged by the size of energy gap assigns to the native structure and the average energy of the rest of the non-native structures. A mostly used measure for assessing this quality is the Z-score. We defined the Z-score as follows:
E E E Z native ∆ > < − = , (16) where
∑
−< > = ∆ d d E E E ( )2 . (17)Enative is the energy value of a native structure, Ed is the energy score of a decoy structure d,
and <E> is the mean of energy values of all non-native structures in a decoy set. Z-score is used for measuring the energy separation between the native structure and the other decoy structures in the units of the standard deviation of the ensemble. The Z-score above is only for a single protein. While we seek the weights of an energy function, we makes Z-scores of
“all” proteins simultaneously low enough, that is, negative and large in the absolute value. We need an objective function that reflects the Z-scores of the many proteins in the training set. We have many approaches to develop an objective function. For example, we minimize the summation of Z-scores over proteins and we obtain an energy function that gives small Z-scores for many proteins but large Z-scores for a few proteins. This is not desired because the Z-scores of “all” proteins need to be small. This problem arises partly because proteins in the training set have different quality decoys and the current energy function allows some proteins to be more easily recognized than others. Another approach may be to minimize the maximum of Z-score of proteins in the training set. However, the optimized weights are probably determined by few proteins, which may be exceptional ones that could be structures with some errors. This tends to lead to unreasonable energy weights. Some intermediate approaches have been proposed by Koretke et al. [56] as well as by Mirny and Shakhnovich [57].
To avoid the effects of few proteins and minimize the Z-scores of “all” proteins, we chose a normalized Z-scores. When the Z-scores of some proteins are very small, it is difficult to optimize other proteins which have large Z-scores. In order to reduce the ill effect mentioned above, we normalize the Z-scores with
z z f − + = exp 1 1 ) ( , (18)
which f(z) maps Z-scores to the value among 0 and 1.
Even the Z-score is low enough; it does not guarantee the native structure can be distinguished from the decoy set, because Z-score is based on the different value between energy value of the native structure and the mean of energy values of all non-native structures in a decoy set. To ensure that energy value of a native structure is the lowest
among a decoy set, we added a related measure Z’-score [30] given as E E E Z native lowest ∆ − = ' , (19)
where Elowest is the lowest energy value of the non-native structure among the decoy set, and
∆E is the same used in Z-score (in Equation 17). In contrast to the Z-score, the Z’-score gives a quantitative measure of how well separated the native structure is from its lowest energy neighbor from within the decoy set. We applied the same normalized approach into
Z’-score. Finally, our objective function of evolutionary approach is
∑
+ = N i z f z f S ( ( ) ( ')), (20)where i is the protein i, and N is the number of proteins in a training set. We minimize the score S to find out optimal weights for energy terms of our energy functions.
2.3 Data Sets of Decoys
A popular approach to test energy functions is to partially sample the conformational space utilizing constructed decoy sets. Publicly available decoy sets not only provide a means to evaluate performance of energy functions, but also permit comparisons between different structure discrimination methods [50, 51, 58]. Many of these decoy sets contain a large number of candidate conformations, with varying degrees of similarity to the native conformation. The goal of developing an efficient energy function is to recognize the best conformation that is most similar to the native structure.
2.3.1 Training Sets
To develop our new energy functions to discriminate the native structures and non-native structures, we used well-developed decoy set, Rosetta-Tsai [59], as our training
sets. The decoy set was obtained from the Baker Laboratory website (ftp://ftp.bakerlab.org/pub/decoys/decoys_11-14-01.tar.gz). These Rosetta-Tsai decoy set is modified from Rosetta all-atom decoy set [60] and generated from fragments of 3 to 9 residues from known structures matched to the targets through a multiple sequence alignment process. These fragments were assembled to native-like structures from a fragment insertion simulated annealing procedure which is using Bayesian scoring functions [12, 36, 61, 62]. The decoy sets increase the number of proteins and frequency of near native models building on side-chains and minimizing clashes.
The decoy set contains structural decoys for 41 different and diverse protein targets. For the training step, we preprocess some error structures in the decoy set. We filter out the proteins with incomplete residues which make inaccuracies of energy functions and the proteins that included in the six testing decoy sets. Table 3 lists the final 30 protein targets and the length ranging from 35 to 85 residues. These protein targets are used for training our energy functions to obtain the overall weights of energy terms.
2.3.2 Testing Sets
We tested the performances of our energy functions with optimal weights on six decoy sets. They are the EMBL misfolded set of Holm and Sander [63] , the 4state_reduced set of Park and Levitt [22], local-minima decoy set of Kesar and Levitt [35], the lattice_ssfit set of Samudrala et al. [64], and fisa decoy set of Simons et al. [61]. These decoy sets are obtained from the Decoys’R’Us database [35] (http://dd.stanford.edu/). The Rosetta all-atom decoy set [60] could be download from the Baker Laboratory website (ftp://ftp.bakerlab.org/pub/decoys/RosettaAllAtomDecoys.tar.gz). The protein lists of decoy sets are summarized in Tables 3. Since these sets contain thousands of conformations generated by different conformational search algorithms, the performance of an energy
function depends on each set. Success in one decoy set does not guarantee success in another [65]. Therefore, testing on a variety and large number of decoy sets is to provide a rigorous evaluation of how well an energy function works.
The EMBL misfolded set [63] is set of intentionally misfolded structures and their corresponding native structures. This decoy set contains structural decoys for 25 protein targets including from 36 to 317 residues and was constructed by swapping side-chains on pairs of crystallographically determined structures with the same number of residues while keeping the backbone geometry unperturbed. The resulting chimeric structures were then subjected to 500 steps of steepest descent energy minimization using the GROMOS program.
The 4state_reduced [22] decoy set contains structural decoys for 7 small proteins including from 54 to 75 residues with varying topological folds. The protein structures have been generated by exhaustively enumerating the backbone rotamer states of 10 selected residues in each protein using an off-lattice model with four discrete dihedral angles states per rotatable bond. Among hundreds of thousands of generated conformations, only those compact structures scoring well by using a variety of scoring functions and having reasonable RMSD from the native conformation have been selected.
The local-minima decoy set (lmds) [35] also contains structural decoys for 10 small proteins including from 36 to 68 residues. These decoys are conformations that occupy minima in a modified classical ENCAD [66-69] force field using united and soft atoms. Initially ten thousand structures were generated by randomly modifying only the dihedral angles in the loop regions. After minimization in torsion space to the local minima in the potential, up to 500 of the lowest energy conformations for each protein were kept to make up the decoy sets.
The lattice_ssfit [64] decoy set contains structural decoys for 7 proteins including from 55 to 98 residues. These decoy conformations have been generated by ab initio protein structure prediction methods. The conformational space of a sequence was exhaustively enumerated on a tetrahedral lattice. A lattice-based scoring function was used to select the 10,000 best-scoring conformations. All-atom structures were then generated by fitting an off-lattice four-state torsion model to the lattice conformations, using predicted secondary structure. The 10,000 conformations were further scored with a combination of RAPDF (residue-specific all-atom probability discriminatory function) [70], HCF (hydrophobic compactness function) [64], and the Shell energy function (one-point-per-residue scoring function) [23]. The 2000 best-scoring conformations for each protein were selected for the decoy sets.
The fisa [61] decoy set contains structural decoys for 4 proteins including from 43 to 76 residues. These decoy conformations are generated by the same protocol as in training set. Use a fragment insertion simulated annealing procedure to assemble native-like structures from fragments of unrelated protein structures with similar local sequences (determined through a multiple sequence alignment process) based on Bayesian scoring functions.
The Rosetta all-atom decoy set [60] was generated from the same protocol which used in the training set and fisa decoy set. Fragments of 3 to 9 residues from known structures matched to the targets through a multiple sequence alignment process were selected to assemble native-like structures by fragment insertion simulated annealing procedure which is using Bayesian scoring functions [12, 36, 61, 62]. The terms of the scoring function included those for hydrophobic burial, electrostatics, disulfide bonds, the packing of α-helices and β-strands, and the formation of β-sheets. During annealing only, another term used to promote compactness was added based on the radius of gyration. The number of
decoy structures in the sets ranges from 994 to 1999. The native structures are not been within the downloaded decoy set and we copy the native structures from PDB database. But, the native structures are different from the decoy structures. The residue sequences of decoy structures are incomplete sequences contrast to the sequences of native structures. We filter the incomplete proteins to avoid inaccuracies of energy calculation. The protein which has difference between the number of residues of decoy structure and ones of native structure is small than 10 and the length of sequence of decoy structure is less than 30 residues was filtered off. We then cut the native sequences to fit the length of the residue sequences of decoy structures to reduce the computational error of our energy functions. Final, 42 proteins were left in the decoy set and include from 34 to 149 residues.
Chapter 3 Results and Discussions
3.1 Parameters in optimization
The parameters of an evolutionary algorithm may conduce to different results. Population sizes and maximum generations are usually adjusted for searching best results in an evolutionary algorithm, but difference may result from the same parameters. In this thesis, we examine many different population sizes and maximum generations to ensue least differences. The final values of weights are not slimily because of different initial random values. To observe the variations of weights, therefore, we consider the weight of electrostatic potential as the base and calculate ratios of other energy terms to electrostatic potential.
Table 4 shows the variations of weights of MOLSIM with different population sizes and fixed maximum generations, 200. Each result of different population sizes is the average value of five independent runs. The standard deviation shows that our evolutionary algorithm can find the best weights and are stable in many different runs. Table 5 lists the similar results for different maximum generations and a fixed population size, 200, excluding maximum generations, 100 and 200 steps. Although the variation of maximum generations, 100 and 200, doesn’t like other results, the standard deviation values are enough small.
Tables 6 and 7 list the variations of weights of GEMSCORE. For the same reason, the different values of weights from different initial random values, we use the van der Waals potential as the base to calculate the ratios of other energy terms. The results show that similar conclusion. The evolutionary algorithm we used in this thesis is stable for optimizing the weights of our energy functions. To ensure to find the best weights, we use population sizes, 200, and maximum generations, 300, in our evolutionary algorithm. The
final overall weights of energy terms in two energy functions are presented in Table 8. We use these weights for testing popular benchmarks latter.
3.2 Results of training set
As the description in section 2.2.4 of Materials and Methods, the Z-score of a native structure is calculated to describe how far the effective energy of the native structure is separated from the energy spectrum of the decoy structures and we judge the size of energy gap between the native structure and the lowest energy non-native structures with Z’-score. Results of the Z-score and Z’-score from the optimized training decoy set are presented in Table 9. Bold faced values indicate the rank of the native structure is larger than 500.
There are 17 X-Ray and 13 NMR structures in the training set. Figure 4 shows the performances of our energy functions on different structure determination by X-ray and NMR on training set. In Figure 4, Rank1 and Rank5 mean that the native structures rank within top 1 and top 5 among its corresponding decoy set after the training process, respectively. The ranks of the native structures are in the top 10 percent (Rank10%, ~186) and the rest 90 percent (Other) among its corresponding decoy set, respectively. In both Rank1 and Rank5, our methods have better performance in X-Ray structures than NMR structures. MOLSIM presents the results in NMR structure as batter as X-Ray structures in Rank10%. GEMSCORE can identify all X-Ray structures completely, but misidentify the about 40 percent of NMR structures.
In general, our energy functions have better ability to find out the native structures which are X-Ray structures. These worse structures are most NMR structures and contain many models in original PDB file. But only one model was considered as the native structure used in training set. It may be part of reason that the bad performances of our energy functions for some NMR structures. Though, our energy functions don’t have the
performances for some NMR structures as well as X-Ray structures, native structures of NMR structures are mostly ranked before the 50 percent among its corresponding decoy set in the training set.
3.3 Test with popular benchmarks
After weights of energy terms are yielded, we tested our optimized energy functions with popular benchmarks. The results of EMBL misfolded decoy set are listed in Table 10. There are 24 proteins identified from 25 native-misfolded protein pairs in MOLSIM. GEMSCORE identify all 25 proteins in this decoy set. Only one protein, 2cdv, is misidentified in MOLSIM. There is no Z-score in EMBL misfolded decoy set because of only one decoy structure in the set.
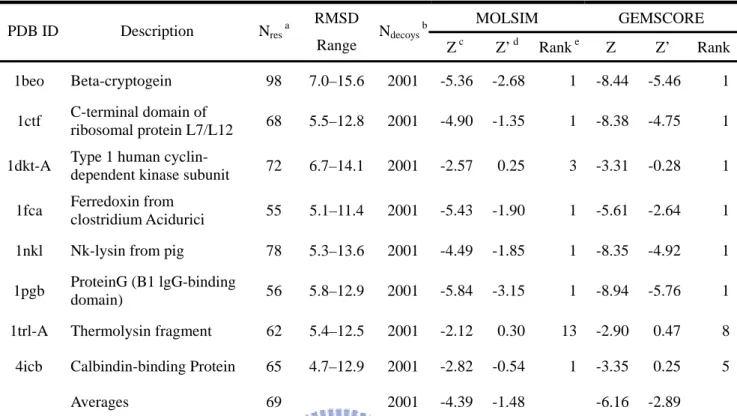
The results of the Z-score and Z’-score from the other five testing decoy sets, 4state_reduced, lmds, lattice_ssfit, fisa, and Rosetta all-atom decoy set, are presented in Tables 11-15. The results of total six testing sets compared with previous works based on physics-based energy functions by previous authors [27-32] are summarized in Table 16. There are 44 and 46 native proteins that ranked first in total 71 decoy sets with MOLSIM and GEMSCORE, respectively.
Figure 5 plots correlations between the energies and the all-atom root mean square deviation (RMSD) of decoys from their corresponding native structures in 4state_reduced decoy set on 4state_reduced set. Table 17 shows the details of comparison with previous works in 4state_reduced decoy set. Z’-score isn’t used in general, therefore, we compare the rank and Z-score of native structure. The number before slash is the rank of native structure in this decoy sets. Another is the Z-score of native structure. Our results are as well as previous works, which used AMBER, or other force-fields.
There is one native structure, 3icb, could not be distinguished in both our energy functions. Protein 3icb is a vitamin D-dependent calcium-binding protein and contains two calcium ions. Figure 6 shows the location of calcium ions in the three-dimension structure of 3icb. The two Ca2+ of 3icb locate in the loop section of native structure and that may be one reason for worse result. Lack of Ca2+ at loop could make unstable loop of native structure. Therefore, we refine the native structure with two Ca2+ and calculate energy with the same weights again. Because of problems of programs, only GEMSCORE energy function was used to re-calculate the refined structure. Native structure is distinguished from non-native structures after put calcium ions back to the native structure. Result is presented in Table 18.
The results of other three testing sets, lmds, lattice_ssfit, and fisa, are listed in Table 19-21. As 4state_reduced set, the performances of our energy functions are good as previous works. Although there are some native structures that can’t be identified from decoys, they are 1fc2 in fisa, 1b0n-B, 1bba, 1dtk and 1fc2 in lmds, 1dkt-A, and 1trl-A in lattice_ssfit. Some proteins, like 1bba and 1fc2 in lmds, were ranked as worse energy. They were missed by previous work [27]. The reason for this massive failure is not entirely clear. Perhaps, this is because 1bba is pancreatic hormone with a long loop. 1fc2 and 1b0n-B are both protein complexes and have many missing coordinates (≥15 residues) in their native structures. Figure 8 shows the whole protein structures of 1fc2 and 1b0n-B. The numbers of residues with coordinates of these three proteins are less than 45.
The others proteins, 1dtk in lmds, 1trl-A in lattice_ssfit, which can’t be distinguished from decoys are both NMR structures and contains 20 and 8 models, respectively. One reason for the worse results is that the native structure adopted in decoy sets may not fit for our energy functions. The same results that performances of our energy functions are weak for NMR structures are presented in training set. Figure 7, 9, and 10 plot correlations between the energies and the all-atom RMSD of decoys from their corresponding native structures on lmds, lattice_ssfit, fisa decoy sets, respectively.
The same result that has better performance in X-Ray structures than NMR structures on the Rosetta all-atom decoy set. The result is presented in Table 15. There are 20 X-Ray and 22 NMR structures in the decoy set. Native structures are most identified using MOLSIM. 16 and 18 native structures are ranked within top 1 and top 5, respectively. There are 19 native structures ranked first using GEMSCORE and one misidentified structure is ranked four. However, our methods have the worse performance in NMR structures. MOLSIM identified 9 and 12 native structures from decoy structures within top 1 and top 5, respectively. 7 and 10 native structures are identified as top 1 and top 5 using GEMSCORE in total 22 structures.
Figure 11 summaries the results on five testing decoy sets excluded EMBL misfolded decoy set. There are 45 X-Ray structures and 26 NMR structures in these decoy sets. Top1 and Top5 mean that the native structure ranks within top 1 and top 5 among its corresponding decoy set, respectively. The ranks of the native structures are in the top 10 percent (Top10%) and the rest 90 percent (Other) among its corresponding decoy set, respectively. GEMSCORE presents the better power in distinguishing X-Ray structures than MOLSIM. MOLSIM have the better performance to identify NMR structures than GEMSCORE and distinguish X-Ray structures as well as GEMSCORE.
3.4 Hydrogen-bonding interactions in GEMSCORE
Hydrogen-bonding interactions are important interactions during protein folding. In this thesis, however, we only consider the hydrogen-bonding interactions on backbone as a part of GEMSCORE. The original energy function using in GEMDOCK used the hydrogen-bonding interactions as the main potential during protein-ligand docking. Nevertheless, it may not suit to apply the hydrogen-bonding potential used in GEMDOCK for protein folding directly. Table 22 compares the results on six testing decoy sets by
GEMSCORE with hydrogen-bonding potential (EHB) and hydrogen-bonding potential on
backbone (EbHB). EHB is a potential of all hydrogen-bonding interactions and calculate
energy with the same protocol of EbHB. Definition of hydrogen-bonding potential, EbHB, is
described in section 2.1.2 (in Equation 7). The result of GEMSCORE with EHB haves
performance as well as GEMSCORE with EbHB excluding 4state_reduced decoy set.
We analyzed the result on 4state_reduced decoy set with different hydrogen-bonding potentials, EHB, EbHB, and EnbHB. Table 23 presents the result on 4state_reduced decoy set. EHB means the potential of all hydrogen-bonding interactions. EbHB and EnbHB mean the
potentials of hydrogen-bonding interactions on backbone and hydrogen-bonding interactions which do not locate on backbone, respectively. (i.e., EHB = EbHB + EnbHB). Result
of EnbHB has terrible performance than EbHB. In the analysis on training set, we can see the
same result as the result on 4state_reduced decoy set. Figure 10 shows the percentages of native structures ranked within 1, 5, 100, 500, 1000 and larger 1000 in the training set with different hydrogen-bonding potentials, EHB, EbHB, and EnbHB.
The terrible result on EnbHB may be caused from the definition of hydrogen-bonding
interactions used in the energy function of GEMDOCK. In order to reduce computational time of GEMDOCK, a simplify strategy was adopt. It does not to add hydrogen atoms and assign hydrogen bonds depended on nitrogen atoms and oxygen atoms during energy calculation. Hydrogen bonds are assigned based on the distance between nitrogen atom and oxygen atom. However, it is impossible to from hydrogen bond at some angle of N-H-O (θNHO), even the distance is enough close. When the all hydrogen-bonding interactions are divided to hydrogen-bonding interactions on backbone and not on backbone, EnbHB contains
the all inaccuracy hydrogen-bonding interactions described above and has terrible performance.
This strategy works fine in protein-lignad docking because of the few hydrogen-bonding interactions and space restrictions. Nevertheless, many hydrogen bonds from secondary structures to stable protein structure during protein folding. It is effective to consider the hydrogen-bonding potential for developing energy function. The result (Figure 12) shows that the major contribution of hydrogen-bonding potential is from hydrogen-bonding potential on backbone. It also proves why the performance of potential of all hydrogen-bonding interactions (EHB) as well as potential of hydrogen-bonding
interactions on backbone (EbHB). It is enough to cover the error caused from the potential of
hydrogen-bonding interactions which do not locate on backbone (EnbHB).
3.5 Solvent effects in MOLSIM/GEMSCORE
The original energy functions we used in this thesis don’t contain solvation potential. However, solvent effect plays an important role to stable the protein structure in the native situation. We added extra solvation potential to improve our energy functions. Table 24 present the performances of MOLSIM and GEMSCORE. Original and Optimized mean the original energy function without optimization and the optimized energy function without solvation energy, respectively. Optimized+ESAS means the optimized energy function with
solvation energy. We can see a lot of improvement in MOLSIM energy function. Not only average Z-scores but also the number of native structures ranked first in a decoy set has best performance with optimized energy function that contains solvation energy function.
GEMSCORE also presents the same result in average Z-scores. But the number of native structure ranked number one doesn’t have variation excluding EMBL misfolded and 4state_reduced decoy sets. The reason for this is not entirely clear. It may the solvation energy we adopted couldn’t be suitable for GEMSCORE energy function. Nevertheless, additionally solvation potential improve the performances of our energy functions whether
MOLSIM or GEMSCORE.
3.6 MOLSIM vs. GEMSCORE
In the thesis, we show two energy functions. One is simplified physics-based energy function, MOLSIM, and another is empirical energy function, GEMSCORE. We optimized these energy functions for protein folding. Both of them show the ability that identifies the native structure from lots of non-native structures. These two energy functions have similar energy terms and optimized by the same optimization strategy, however, it still has some differences between them.
Computational resources and time are main discrepancies. MOLSIM is all-atom energy function and need extra information of hydrogen atoms during energy calculation. Although, only specified hydrogen atoms are needed in MOLSIM, evaluate the coordinates of these hydrogen atoms and energy minimization after adding hydrogen atoms require more computational resources and time than GEMSCORE. And these extra hydrogen atoms also increase the computation when energy value is evaluated. For example, GEMSCORE need 1.80 seconds in calculating energy values of 1ctf which contains 65 residues and 486 atoms. MOLSIM costs 3.31 seconds with 1ctf. When evaluate a large protein, like 2tmn that includes 316 residues and 2431 atoms, GEMSCORE (10.7 seconds) still fast then MOLSIM (18.8 seconds).
Nevertheless, MOLSIM has better performance then GEMSCORE in most decoy sets. MOLSIM also presents better ability when identifies NMR structures. Some researches believe that molecular dynamic is needed with all-atom energy function; especially extra hydrogen atoms are added. Molecular dynamic with a short time can provide reliable structure. In this thesis, no molecular dynamic is adopted in MOLSIM developed originally for molecular dynamics. Molecular dynamic may have more accuracy, but more
computational resources and time are needed during energy calculation. That is disadvantage of most physics-based energy functions. However, GEMSCORE, an empirical energy function based on physical mechanisms with simplified model, presents a good performance with popular benchmarks and costs less computational resources and time then physics-based energy function. It may be more suitable for protein structure prediction system to select the best structure from thousands and thousands candidate structures.
Chapter 4 Conclusions and Future Works
4.1 Conclusions
In this thesis, we develop two simple energy functions for protein folding and have well performance on six popular benchmarks. We adopt only few weights to optimize the energy functions with few terms and the performance as well as previous works. However, most of previous used AMBER or other force fields. The costs of computational resources and time are huge and parameters used to optimize the force fields during optimization are hundreds and thousands. The difficulty and time are as more as numbers of parameters in optimization.
The parameters of energy function based on physics mechanical are usually optimized from chemical compounds or small proteins. The optimal parameters may not reflect the native protein structures. We use the information from well-developed decoy set and obtain these optimal parameters of energy function using evolutionary algorithm. This would yield energy functions that are practically powerful for many purposes and should be conceptually helpful for gaining insight into the physical principles of protein architecture.
4.2 Future Works
In the near future, we will apply our derived energy functions for protein structure prediction with CASP6 (Critical Assessment of Techniques for Protein Structure Prediction, http://predictioncenter.llnl.gov/casp6/Casp6.html) targets which many researches have submitted in the world. By this progress, we hope to prove the ability of our energy functions which selects the best structures from many different candidate generation methods. After examination, we will integrate our energy functions with other methods that generate candidate structures and pick up the best candidate structure from thousands and
thousands of ones. Finally, we will build a reliable system to predict protein structure from only protein sequences.
Besides building a reliable system to predict protein structure, many shortcomings can be reformed in our energy functions. A better training set may increase the performance of our methods. Sovation energy used in this thesis is ASPs. In past years, GB was proved to have good performance for solvent effect. It may have better results by combining GB and ASPs. More accuracy and high-speed are also needed for calculating atomic solvent-accessible surface area.