L
Journal of Alloys and Compounds 335 (2002) 254–261
www.elsevier.com / locate / jallcom
q
Martensitic transformation of a Ti-rich Ti Ni Si shape memory alloy
51 47 2a b ,
*
cS.F. Hsieh , S.K. Wu
, H.C. Lin
a
Department of Mold and Die Engineering, National Kaohsiung University of Applied Science, Kaohsiung, Taiwan 807, ROC b
Institute of Materials Science and Engineering, National Taiwan University, 1 Roosevelt Rd., Sec. 4, Taipei, Taiwan 106, ROC c
Department of Materials Science, Feng Chia University, Taichung, Taiwan 407, ROC Received 25 April 2001; accepted 21 August 2001
Abstract
Ti Ni Si51 47 2 alloy is similar to Ti Ni51 49 alloy with nearly equal transformation temperatures and having B2↔199 martensitic transformation. Despite the existence of many second phase particles, this alloy still exhibits good shape recovery. The B199 martensite structure in Ti Ni Si51 47 2 alloy is calculated from SADPs as a50.284 nm, b50.412 nm, c50.468 nm and b 5988. Martensitic transformation temperatures decrease with increasing aging time at 4008C. The hardness increment and transformation temperature depression of Ti Ni Si alloy are more than those of Ti Ni51 47 2 51 49 alloy under the same degree of cold rolling and the same number of thermal cycles due to the former alloy having a higher inherent hardness from Si atoms solid-soluted in TiNi alloy. The strengthening effects of cold rolling and thermal cycling on M temperature of Ti Ni Si alloy follow the expression of M 5T 2KDs .s 51 47 2 s o y 2002 Elsevier Science B.V. All rights reserved.
Keywords: Transition metal alloys; TEM; Phase transition; Mechanical properties
1. Introduction B2→B19→B199 for TiNiCu and TiNiPd alloys [15,16]
under different thermal–mechanical processes composed Near-equiatomic TiNi alloys are among the most im- of a high temperature cubic B2 phase, an intermediate portant shape memory alloys (SMAs) due to their superior rhombohedral R phase (or orthorhombic B19 phase) and a shape memory effect and superelastic properties. The low temperature monoclinic B199 phase.
application of these alloys has spread not only to engineer- TiNi thin films fabricated by r.f.-sputtering are consid-ing but also to medical and dental fields. It has been ered to be promising candidates for microactuators due to confirmed that TiNi SMAs’ properties can be affected by their large deformation and strong recovery force. The various thermal–mechanical treatments, such as thermal sputtering TiNi thin film deposited on Si substrate is cycling [1], aging treatment in Ni-rich alloys [2–4] and amorphous and does not behave as a SMA. Therefore, cold rolling [5]. Furthermore, the addition of a third crystallization annealing is necessary [17]. However, if the element has a substantial effect on phase transformation annealing temperature is higher than 6008C, Ni and Si behavior in TiNi SMAs. The M temperature decreasess atoms diffuse across the interface of TiNi film and Si monotonously following substitution of Ni with V, Cr, Mn, substrate and ternary silicides such as Ti Ni Si , Ti Ni Si1 1 1 4 4 7
Fe and Co elements [6–9], but increases remarkably are formed at the interface [18]. At the same time, it is following substitution of Ni with Au, Pd and Pt in amounts well-known that a small deviation from stoichiometry in not less than 15–20 at.% [10–12]. The transformation TiNi SMAs can give rise to a significant precipitation of sequence of TiNi-based SMAs can be B2→R→B199 for second phases [19,20]. This in turn affects both the alloy’s TiNiFe, TiNiAl and TiNiCo alloys [9,13,14], but strength and its shape memory effect. To our knowledge, transformation characteristics and precipitated second phases of TiNiSi ternary SMAs with small amounts of Si have not been reported yet. In this paper, we aim to
q
This manuscript has not been published elsewhere nor has it been investigate the transformation behavior of a Ti-rich submitted for publication elsewhere.
Ti Ni Si alloy. The effects of aging, cold rolling and51 47 2
*Corresponding author. Tel.: 7846; fax:
1886-2-2363-thermal cycling on the martensitic transformation of 4562.
E-mail address: [email protected] (S.K. Wu). Ti Ni Si alloy are also discussed.51 47 2
0925-8388 / 02 / $ – see front matter 2002 Elsevier Science B.V. All rights reserved. P I I : S 0 9 2 5 - 8 3 8 8 ( 0 1 ) 0 1 8 2 1 - 7
2. Experimental procedure
The conventional tungsten arc melting technique was employed to prepare Ti Ni Si (in atomic percent) alloy.51 47 2
Titanium (purity 99.7 wt%), nickel (purity 99.9 wt%) and silicon (purity, 99.9 wt%), totaling about 100 g, were melted and remelted at least six times in an argon atmosphere. A pure titanium button was also melted and used as a getter. The mass loss during the melting was negligibly small. The as-melted buttons were homogenized holding at 9508C for 7 days and then quenched in water (the as-homogenized specimen). The buttons were cut into several plates with a low speed diamond saw, and then annealed at 9008C32 h and quenched in water (the as-annealed specimen). After the annealing treatment, three
experimental procedures were conducted. First, some Fig. 1. DSC curves of as-homogenized Ti Ni Si alloy. M* and A* are 51 47 2
plates were sealed in evacuated quartz tubes and aged at peak temperatures of forward and reverse martensitic transformation, 4008C for 1–240 h and then quenched in water. Second, respectively.
some plates were cold-rolled at room temperature to 5, 10, 20 and 25% reduction in thickness. Third, other plates
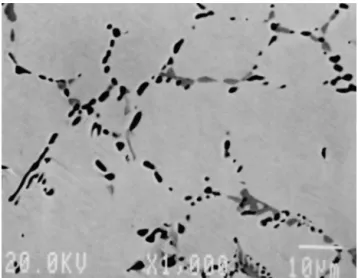
were subjected to thermal cycling N times from 0 to 2008C number of second phase particles are found around grain with N51–100 cycles. Specimens for DSC measurement, boundaries of the matrix. The chemical compositions of hardness testing, shape recovery test and microstructure the matrix and second phase particles by EPMA analysis observation were carefully cut from plates treated by the are shown in Table 1. The ratios Ti /(Ni1Si) of the matrix above procedures. DSC measurements were made with a and second phase particles are also listed in Table 1. Based Dupont thermal analyzer equipped with a quantitative on the 7508C Ti–Ni–Si ternary phase diagram proposed by scanning system 910 DSC cell for controlled heating and Markiv et al. [22], the results of Table 1 indicate that the cooling runs on samples encapsulated in an aluminum pan. matrix in Fig. 2 is Ti(Ni,Si) phase, the black particles are The running temperature range was from 0 to 2008C with a Ti (Ni,Si) phase and the gray particles are x phase. The2
heating and cooling rate of 108C / min. Specimens for the composition of the x phase (Ti Ni Si ) is in the range of5 4 1
hardness test were first mechanically polished and then 50–55 at.% Ti and 8–15 at.% Si. In this analysis, we subjected to measurement in a Microvickers hardness suggest that the 7508C Ti–Ni–Si isotherm diagram is still tester with 500-g load at room temperature. For each suitable for the 9508C homogenized specimen. The volume specimen, the average hardness value was taken from at fraction of second phase particles in Ti Ni Si alloy is51 47 2
least five test readings. The microstructural observations about 6%, which is nearly equal to that in Ti Ni51 49 alloy. were made by transmission electron microscopy (TEM) It is reported that in as-quenched binary TiNi alloys, the with a JOEL-100CXII microscope equipped with a con- As temperature increases with increasing linearly as the Ti ventional double-tilting stage. The shape-recovery
mea-surement was performed as described earlier by Lin and Wu [21]. A quantitative analysis of chemical composition was carried out using a JOEL JXA-8600SX electron probe microanalyzer (EPMA) equipped with a WDX analysis system.
3. Experimental results and discussion
3.1. Transformation behavior
Fig. 1 shows the experimental results of DSC measure-ment for the homogenized Ti Ni Si51 47 2 alloy, in both forward and reverse transformations, respectively. The peaks M* and A* appearing in Fig. 1 are associated with the first-order martensitic transformation of B2↔M.
Fig. 2 shows the EPMA backscattering electron image Fig. 2. EPMA backscattering electron image of as-homogenized (BEI) of the as-homogenized Ti Ni Si51 47 2 alloy. A great Ti Ni Si alloy.51 47 2
Table 1
Compositional analyses by EPMA for Ti Ni Si alloy homogenized at 9508C37 days and then quenched51 47 2
Ti Ni Si Ti /(Si1Ni) Remark
(at.%) (at.%) (at.%) ratio
Ti Ni Si51 47 2 Matrix 51.21 47.96 0.83 1.05 Matrix
Black 67.31 31.37 1.32 2.06 Ti (Ni1Si)2
particles
Gray 50.12 34.49 15.39 – x-phase
particles (Ti Ni Si )5 4 1
content increases up to 50.5 at.% and then levels off at the selected area diffraction patterns (SADPs) of this alloy, about 1138C [6]. The ratio, Ti /(Ni1Si), of the matrix in with the foil being parallel to the [100] , [010]M M and Fig. 2 is about 1.05, as shown in Table 1, which is nearly [001]M direction, respectively. Fig. 3(c) is taken from the equal to the ratio Ti / Ni of Ti Ni51 49 alloy. The peak martensite plates at the area E of Fig. 3(a) and (001)M
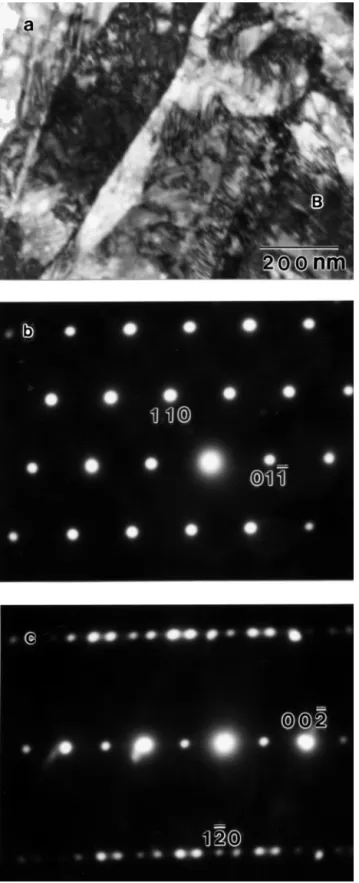
temperatures A* and M* of Ti Ni Si51 47 2 alloy shown in compound twins can be observed. From the SADPs of Fig. Fig. 1 are nearly equal to those of as-quenched Ti Ni51 49 3(b) and (c), the lattice parameters of martensite in alloy [20]. This result indicates that a small amount of Si Ti Ni Si51 47 2 alloy can be calculated as a monoclinic atoms solid-soluted in TiNi alloy has an equivalent effect structure with a50.284 nm, b50.412 nm, c50.468 nm to Ni atoms in Ti-rich Ti Ni Si alloy.51 47 2 and b 5988. From Figs. 1 and 3, one can find that the Fig. 3(a) shows the TEM bright field image of marten- transformation sequence of martensite in Ti Ni Si alloy51 47 2
site in the as-annealed Ti Ni Si alloy. Fig. 3(b)–(d) are51 47 2 is the B2↔B199 one-stage transformation.
Fig. 3. (a) TEM bright-field image of as-annealed Ti Ni Si alloy, (b) SADP of (a) with [100]51 47 2 Mzone axis, (c) SADP taken from area E in (a), showing (001)Mcompound twins with [010]Mzone axis, (d) SADP of (a) with [001]Mzone axis.
Fig. 5. The peak temperatures A* and M* and the hardness versus aging time for Ti Ni Si alloy aged at 4008C.51 47 2
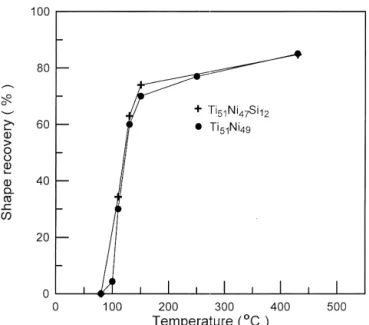
Fig. 4. Shape recovery versus heating temperature for the
as-homogen-distortion and hinder the mobility of twin plates in ized Ti Ni Si and Ti Ni51 47 2 51 49alloys.
martensite / interface, leading to the transformation tem-peratures being depressed and the hardness being increased Fig. 4 shows the shape memory characteristics of in aged TiNiX ternary alloys.
Ti Ni Si and Ti Ni51 47 2 51 49 alloys. Despite the existence of Fig. 6(a) shows the TEM bright-field image of B199 many second phase particles, these alloys still exhibit good martensite in a 4008C3240 h aged Ti Ni Si alloy. Fig.51 47 2
shape recovery that can reach about 85%. From Fig. 4, at 6(b) and (c) are the SADPs of Fig. 6(a) with the foil being ¯ ¯
the same temperature, the shape recovery of Ti Ni Si51 47 2 parallel to [111 ]Mand [210]Mdirections, respectively. Fig. alloy is slightly more than that of Ti Ni51 49 alloy when the 6(c) is taken from the martensite plate having fine striation temperature is below 2508C, but both alloys exhibit nearly at area B of Fig. 6(a). No extra reflection spot can be the same value when the temperature is above 2508C. This observed in Fig. 6(c) except the (001)M compound twins. feature may result from the solid solution strengthening Thus, the fine striations are traces of (001)M twins plates. obtained by Si atoms solid-soluted in the TiNi B2 phase. Comparing Figs. 6 and 3, (001)M twin planes of the aged specimen are more dense than those of the annealed one. 3.2. The aging effect This result may indicate that (001)M compound twins of the aged specimen have a lower stacking fault energy than The DSC measurement for the 4008C aged Ti Ni Si51 47 2 those of the annealed one.
specimen shows that the transformation sequence is
B2↔B199 and the experimental A* and M* temperatures 3.3. The cold rolling effect versus aging time are plotted in Fig. 5. The A* and M*
temperatures gradually decrease with increasing aging time The effects of cold rolling on the martensite transforma-at 4008C. The hardness Hv of this aged alloy increases tion of equiatomic TiNi binary alloy have been sys-significantly in the first 48 h and then gradually levels off tematically studied and the martensite stabilization was with further aging. The same characteristic shown in Fig. 5 observed in the cold-rolled TiNi martensite [5]. In this also occurs in Ti-rich Ti Ni Al52 47 1 and Ti40.5Ni49.5Zr10 study, the Ti Ni Si51 47 2 alloy underwent cold rolling at alloys [23,24], but does not appear in Ti Ni51 49 alloy [20]. room temperature. Table 2 shows the detailed results of This characteristic can be explained as follows. DSC and hardness measurements for various amounts of * Based on the standard model for the solute diffusion in cold rolling (0–25%) in Ti Ni Si alloy in which the A51 47 2 1
*
BCC lattices by a vacancy mechanism in dilute alloys [25], and A2 indicate the reverse transformation peaks of the the excess quenched-in-vacancies can promote atomic first and second heating cycle for the specimen just after
*
rearrangement in TiNiX ternary alloys during the aging cold rolling. In Table 2, A1 temperature significantly *
treatment at B2 phase in order to reduce the free energy of increases, but A2 decreases, with increasing cold rolling. the system. This rearranged process in TiNiX alloys may The M* temperature is also found to decrease with introduce much more microstrain fields than that in TiNi increasing cold rolling. The above phenomenon is regarded binary alloys. In other words, a small Si addition to TiNi as the mechanically-induced martensite stabilization in alloy can enhance the atomic rearrangement of dilute Ti Ni Si alloy. The same behavior is also reported in51 47 2
reverse martensitic transformation B199→B2, the marten-*
site stabilization dies out and A2 temperatures are dramati-cally lowered. In Fig. 7(a), the difference between peak
* *
temperature A1 and A , DA*, stands for the degree of2
martensite stabilization. From Fig. 7(a), the DA* of the Ti Ni Si51 47 2 alloy (DA*5968C) is larger than that of Ti Ni51 49 alloy (DA*5828C) for the same 25% cold rolling. Fig. 7(b) shows that the increment of hardness at 25% cold rolling for Ti Ni Si alloy (DHv 5161 Hv) is51 47 2
larger than that of Ti Ni51 49 alloy (DHv 5143 Hv). This feature results from the as-annealed Ti Ni Si51 47 2 alloy being harder than Ti Ni51 49 alloy due to Si atoms solute-soluted in the matrix. We propose that the dislocation / defect movement may be impeded more in Ti Ni Si51 47 2
alloy than in Ti Ni51 49 alloy and causes the harder Ti Ni Si alloy to have a higher martensite stabilization51 47 2
under the same degree of cold rolling, as shown in Fig. 7. 3.4. The thermal cycling effect
Fig. 8 shows peak temperatures M*, A* and hardness Hv versus thermal cycle N for the annealed Ti Ni Si51 47 2
alloy. In Fig. 8, the M* and A* temperatures decrease, but the hardness Hv increases with increasing N. It has been proposed that this feature comes from the dislocations induced by thermal cycling [1]. The A* and M* decrease quickly for the first 10 cycles with the decrement being about 168C at N 510, which is larger than that of Ti Ni51 49
alloy ((108C at N 510) [20]. The increase in hardness of this alloy (DHv 528) is also greater than that of Ti Ni51 49
alloy (DHv 519) at the same N 510 cycles. This difference indicates that Ti Ni Si alloy can induce more disloca-51 47 2
tions than Ti Ni51 49 alloy in the early thermal cycling. We suggest that the volume change during the martensitic transformation can induce complex stress fields at the interface of second phase particles and B2 / B199 matrix during thermal cycling. These complex stress fields may enhance the dislocation multiplication, and therefore, increase the hardness of the alloy and depress its M* and A* temperatures. In Fig. 8, after 50 cycles, the A* and M* temperatures reach constant values. This indicates that the quantities of induced dislocations reach a saturated value after 50 cycles in Ti Ni Si alloy.51 47 2
3.5. Strengthening effects of cold-rolling and thermal cycling on martensitic transformation temperatures
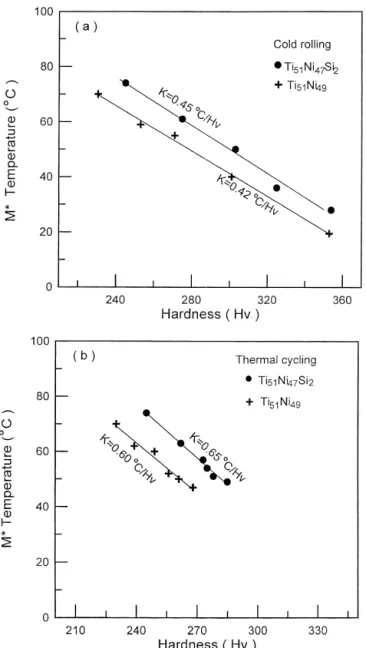
Fig. 9(a) and (b) show the curves of peak temperature M* versus hardness Hv for the cold-rolled and thermal-cycled Ti Ni Si alloy, respectively. The results of cold-51 47 2
rolled and thermal-cycled Ti Ni51 49 alloy are also shown in Fig. 9. It was pointed out that any strengthening mecha-nism which impedes the transformation shear can lower Fig. 6. (a) TEM bright-field image of martensite in Ti Ni Si51 47 2 alloy
the transformation temperatures because the martensitic
¯ ¯
aged at 4008C3240 h, (b) SADP of (a) with [111 ]Mzone axis, (c) SADP
transformation involves a shear process [26,27]. This taken from area B in (a), showing (001)Mcompound twins with [210]M
Table 2
DSC measurement and hardness test of Ti Ni Si alloy at various thickness reductions51 47 2
* * * Thickness A1 DHh1 M1 DHC A2 DHh2 Hardness reduction (%) (8C) (J / g) (8C) (J / g) (8C) (J / g) (Hv) 0 114 27.9 74 27.2 107 26.3 245 5 134 23.2 61 19.8 101 20.4 284 10 150 18.6 50 14.8 96 16.5 321 20 165 12.4 36 10.7 81 11.7 371 25 171 9.2 28 8.2 75 7.9 406
M 5 T 2 KDss o y (1) In this study, both cold-rolling and thermal cycling do not change the alloy’s composition, hence T is a constant.o
where the constant K contains the factors of propor- In addition, both cold rolling and thermal cycling can tionality between the critical shear stress and the yield strengthen the alloys by inducing dislocations, and there-stress Ds , the equilibrium temperature T is a function ofy o fore can raise the yield stress Ds . As derived from Eq.y the chemical composition, and the yield stress Dsy is (1), both cold-rolling and thermal cycling should cause the regarded as proportional to the hardness. M* and A* temperatures to be lowered by the strengthen-ing effect. This prediction is qualitatively consistent with the results of Fig. 9. In Fig. 9, the slope represents the constant K, which is not the same for different strengthen-ing processes. As mentioned above, strengthenstrengthen-ing pro-cesses can introduce dislocations in alloys. However, dislocations induced by cold rolling come from the plastic deformation of martensite and those induced by thermal cycling come from the thermal stress and transformation shear associated with B2↔B19. Carefully examining Fig. 9, the constant K of Ti Ni Si alloy is larger than that of51 47 2
Ti Ni51 49 alloy for the same strengthening process. We propose that the K value is related to the inherent hardness of the annealed TiNi or TiNiX alloys and the depression of M (M*) and A (A*) temperatures by the strengthenings s
mechanism is stronger for the alloy having a higher annealed hardness. Ti Ni Si alloy has a higher inherent51 47 2
hardness than Ti Ni51 49 alloy owing to Si atoms solid-soluted in TiNi alloy. This elucidates why, for the same strengthening mechanism, Ti Ni Si alloy has higher K51 47 2
values than Ti Ni51 49 alloy, as observed in Fig. 9.
Fig. 7. (a) The degree of martensite stabilization (DA*) and (b) the
increment of hardness (DHv) versus the degree of cold rolling for the Fig. 8. Peak temperatures A* and M* and hardness Hv versus the number Ti Ni Si alloy.51 47 2 of thermal cycles N for the Ti Ni Si alloy.51 47 2
of (001)M compound twins are easy to form for the aged specimens.
Martensite stabilization can be induced by cold rolling at room temperature. The hardness increment of this alloy is more than that of Ti Ni51 49 alloy under the same degree of cold rolling. Si atoms solid-soluted in TiNi alloy is suggested to account for this characteristic.
A* and M* temperatures decrease and the hardness increases in the first 10 cycles of thermal cycled Ti Ni Si alloy. Meanwhile, the decrement of A* tem-51 47 2
peratures of this alloy is larger than that of Ti Ni51 49 alloy at the same N due to the former alloy having a harder matrix.
The strengthening effects of cold-rolling and thermal cycling on M (M*) temperature of Ti Ni Sis 51 47 2 alloy are found to follow the equation M 5T 2KDs . Strengthen-s o y ing processes of cold rolling and thermal cycling have different K values. The annealed hardness of Ti Ni Si51 47 2
alloy is higher than that of Ti Ni51 49 alloy and causes the former alloy to have a higher K value than the latter under the same strengthening process.
Acknowledgements
The authors are pleased to acknowledge the financial support of this research by the National Science Council (NSC), Republic of China under Grants NSC 88-2216-E002-013 and NSC 89-2216-E151-010.
References
[1] S. Miyazaki, Y. Igo, K. Otsuka, Acta Metall. 34 (1986) 2045. [2] S.K. Wu, H.C. Lin, T.S. Chou, Acta Metall. 38 (1990) 95. [3] M. Nishida, T. Honma, Scripta Metall. 18 (1984) 1293. [4] M. Nishida, T. Honma, Scripta Metall. 18 (1984) 1299. Fig. 9. M* temperature versus hardness Hv for (a) cold-rolled and (b)
[5] H.C. Lin, S.K. Wu, T.S. Chou, H.P. Kao, Acta Metall. 39 (1991) thermal cycled Ti Ni Si and Ti Ni51 47 2 51 49alloys.
2069.
[6] K.H. Eckelmeyer, Scripta Metall. 10 (1976) 667.
4. Conclusion [7] R. Wasilewski, in: J. Perkin (Ed.), Shape Memory Effects in Alloys,
Plenum, New York, 1975, p. 245.
[8] V.I. Kolomystev, Scripta Metall. 31 (1994) 1415. The annealed Ti Ni Si alloy undergoes the one-stage51 47 2
[9] C.M. Hwang, M. Meichle, M.B. Salamon, C.M. Wayman, Phil. B2↔199 martensitic transformation and its transformation
Mag. 47A (1983) 177.
temperatures are nearly equal to those of as-annealed [10] S.K. Wu, C.M. Wayman, Metallography 20 (1987) 359.
Ti Ni51 49 alloy. Many second phase particles are formed [11] Y.C. Lo, S.K. Wu, C.M. Wayman, Scripta Metall. 24 (1990) 1571. around the grain boundaries of the matrix in which the [12] P.G. Lindqist, C.M. Wayman, in: T.W. Duering, K.N. Melton, D. Stockel, C.M. Wayman (Eds.), Engineering Aspects of Shape matrix is Ti(Ni,Si) phase and the second phase particles
Memory Alloys, Butterworth–Heinemann, London, 1990, p. 58. are Ti (Ni,Si) and x phases. Despite the existence of many2 [13] C.M. Hwang, C.M. Wayman, Scripta Metall. 17 (1983) 1345.
particles, this alloy still exhibits good shape recovery. The [14] K.R. Edmonds, C.M. Hwang, Scripta Metall. 20 (1986) 733. B199 martensite structure in Ti Ni Si alloy is calculated51 47 2 [15] X. Ren, N. Mirua, K. Taniwaki, K. Otsuka, T. Suzuki, K. Tanaka, from the SADPs as a 50.284 nm, b 50.412 nm, c 50.468 Y.I. Chumltyakov, M. Asai, Mater. Sci. Eng. A273–275 (1999) 190. [16] Y.C. Lo, S.K. Wu, H.E. Horng, Acta Metall. Mater. 41 (1993) 747. nm and b 5988.
[17] J.Z. Chen, S.K. Wu, Thin Solid Films 339 (1999) 194. Transformation temperatures decrease and hardness
[18] S.K. Wu, J.Z. Chen, Y.J. Wu, J.Y. Wang, M.N. Yu, F.R. Chen, J.J. increases with increasing aging time at 4008C. This Kai, Phil. Mag. A 81 (2001) 1939.
characteristic may be related to the aging effects of point [19] M. Nishida, C.M. Wayman, T. Honma, Metall. Trans. 17A (1986) defects / atom rearrangements in B2 phase. The fine plates 1505.
[20] H.C. Lin, S.K. Wu, J.C. Lin, Mater. Chem. Phys. 37 (1994) 184. [25] R. Santamarta, C. Segui, J. Pons, E. Cesari, Scripta Mater. 41 [21] H.C. Lin, S.K. Wu, Scripta Metall. 26 (1992) 59. (1999) 867.
[22] V.Y. Markiv, E.I. Gladyshevskii, P.I. Kripyakevich, T.I. Fedoruk, [26] M. Cohen, E.S. Machlin, V.G. Paranjpe, in: Thermodynamics in Inorg. Mater. 2 (1966) 1126. Physical Metallurgy, ASM, Metals Park, OH, 1950, p. 242. [23] S.F. Hsieh, S.K. Wu, J. Mater. Sci. 34 (1999) 1659. [27] E. Hornbogen, Acta Metall. 33 (1991) 595.
![Fig. 1 are nearly equal to those of as-quenched Ti Ni 51 49 3(b) and (c), the lattice parameters of martensite in alloy [20]](https://thumb-ap.123doks.com/thumbv2/9libinfo/8681734.197268/3.918.110.817.518.1072/fig-nearly-equal-quenched-lattice-parameters-martensite-alloy.webp)