Exchange Rate Interventions as a Strategic Trade Policy: Evidence from American Automobile Market
Chi-yang Lin*, Yuanchen Chang﹢ and Wei-jen Wen±
June 2006
Abstract
Can interventions by the Bank of Japan on the yen/dollar exchange rate be used as a strategic policy to promote Japanese exports to the U.S. automobile market? We develop a theoretical strategic trade policy model to explore possible links between exchange rate interventions and changes in market shares of companies in the U.S. automobile market. We then collect data to test the model and find that sales volume and market share of American automakers decreased while the market shares of Japanese automakers increased during periods of intervention by the Bank of Japan. This is because the interventions by the Bank of Japan not only created cost advantage for the Japanese firms but also increased the U.S. consumers' demand for Japanese automobiles as they expected the appreciation of the Japanese yen would be withheld only temporarily.
Keywords: Strategic Trade Policy, Central bank Intervention, Automobile markets JEL classification: F12, F14, F31
*
Graduate Institute of Law, National Taiwan University, Taipei, Taiwan. ﹢
Department of Finance, National Chengchi University, Taipei, Taiwan. ±
Corresponding author, e-mail: [email protected]. Department of International Trade, National Chengchi University, Taipei, Taiwan.
1. Introduction
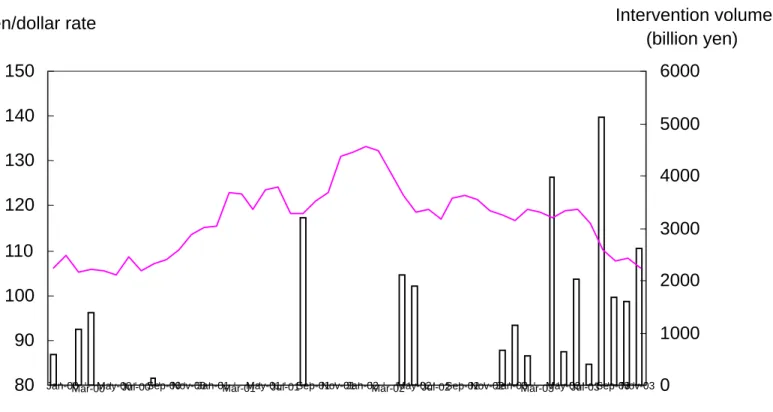
Trade friction between Japan and the United States has existed for decades. Among the sectors creating large trade deficits, the automobile industry has been a notable one. Automakers play an important role both in Japan and American manufacturing sectors. Their sheer size should warrant a better understanding of how trade policy and international competition affect their performances. On the other hand, intervention by the Bank of Japan in the yen/dollar market has reached a record high during the last decade. As shown in Figure 1, the Japanese government began to buy U.S. dollars in large amount to withhold the appreciation of the yen/dollar rate ever since 2002. Interest-related groups had sent petitions to the U.S. Treasury Department to urge the U.S. government to pay more attention on Japan’s interventions in the currency market. They argue that weakening yen increases the competitiveness of Japanese industries in the U.S. A recent investigation by the Treasury Department under the Trade Act Provision, however, concluded that there has been no foreign exchange rate manipulation by Japan.
Interestingly, despite vehement debates in both academic and policy-making circles, related research of exchange rate interventions’ impact on the competitiveness of Japanese companies in the U.S. markets is sparse. In this paper, we develop a theoretical strategic trade policy model to show how exchange rate interventions can give the Japanese automobile firms a lift in the U.S. market. We argue that exchange rate interventions influence trades between U.S. and Japan through two channels. First, like
an export subsidy, undervalued yen creates cost advantage for the Japanese firms. When the strategic variables are strategic substitutes, this cost advantage can further enhance their profits and market share. Second, if the U.S. consumers believe the appreciation of the Japanese yen would be withheld only temporarily, then they might want to bring forward their future purchase of Japanese automobiles. This increase in current demand will raise both the price and quantity sold of the Japanese automobiles.
We then collect data to test the implications of our model. We find that the sales volume and market shares of American automakers decreased, while the market shares of Japanese automakers rose when the Bank of Japan intervened in the foreign exchange market. This indicates the foreign exchange intervention might have subsidized the Japanese automakers. We also find that U.S. consumers tend to purchase more Japanese cars as the Japanese yen appreciated slowly.
The remainder of the paper is organized as follows. Section 2 reviews the literature of strategic trade policy and trade conditions between Japan and the United States. Section 3 describes the theoretical model. Section 4 provides information on the data of the U.S. automobile markets and presents empirical results. A final section concludes.
2. Literature Review
Barber, Click and Darrough (1999) develop a dynamic Cournot model of long-term-profit-maximizing firms operating in the automobile industry. They implement
a structural vector autoregression (VAR) for the purposes of estimating and identifying factors influencing the sale volume. Their empirical results suggest that a strong yen increases quantities sold by American automakers and decreases quantities sold by Japanese automakers. Schwartz (2000) proposes three motives cited by monetary authorities for interventions and estimated their effects. She concludes that interventions by monetary authorities have little effect on exchange rates except those conducted by the Bank of Japan.
Tille (2000) uses a general equilibrium 3-country model with nominal rigidities and monopolistic competition to find that a low degree of pass-through increases the likelihood of a competitive devaluation. Kim (2003) employs a structural VAR model to jointly analyze the effects of foreign exchange interventions and conventional monetary policy (money or interest rate setting) on the exchange rate. It is found that foreign exchange interventions has substantial effects on the exchange rate and signals future conventional monetary policy regime changes. Therefore, official exchange rate intervention is supposed to reveal information about the future path of monetary policy inducing expectation revisions.
3. Theoretical Model
3.1 The impact of official exchange rate intervention on U.S. auto sales
We develop a Cournot oligopoly model to describe the impact of exchange rate interventions on the sales volume of automakers in a two-country framework. Different from the methodology used in Barber, Click, and Darrough (1999), we explore exchange rate interventions by the Bank of Japan as a strategic trade policy, which helps the
Japanese automakers earn a greater profit in the U.S. market.
In the Cournot model, quantities are the strategic variables chosen by the firms. According to Dixit (1988) and Barber et al. (1999), the Cournot model captures some important features in the automobile industry.
Suppose that there are three incumbent firms, x, y, and z, denoting Japanese automakers located in Japan, Japanese automakers located in the United States, and competing American automakers in the U.S. market, respectively. Each firm chooses a production quantity to maximize its profits. The profit function is:
, , , , z i when u k y x i when j k z y x i C Q Pk i i i = = = = = − = ⋅ ; π (1)
where denotes the listed price of Japanese automobiles, denotes the listed price of American automobiles, and denotes the total production cost. Following Kashyap and Wilcox (1993), we assume that there is no inventory so quantities produced are identical to quantities sold.
j
P Pu
i
C
We assume that firm y, a representative Japanese automaker located in the United States, faces a linear inverse demand curve, in which prices of Japanese automobiles are a function of aggregate income and the volume of automobile sales:
, d j G h Q g Q f Q d Pj = − j ⋅ x − j ⋅ y − j ⋅ z + j ⋅ +ε (2)
where denotes the aggregate income in the United States, we use real gross domestic product (GDP) as a proxy,
G
d j
ε represents firm-specific demand shocks, and > 0, > 0, >0, >0.
j
d fj
j
g hj
The parameter measures the sensitivity of price to change in income, and respectively measure the relation between price and quantity for Japanese automobiles, and measures the substitution relationship between automobiles produced by Japanese automakers and American automakers. We assume that Japanese automakers
j
h d j fj
j g
located in Japan or in the United States have the same inverse demand functions. For American automakers, they face another inverse demand function in Equation (3), where the price of American automobiles, is replaced by and related coefficients are substituted by , , , , respectively. The signs of the coefficients above are the same as their counterparts in the inverse demand function faced by Japan automakers.
u P Pj u d fu gu hu . d u G h Q g Q f Q d Pu = − u ⋅ x − u ⋅ y − u ⋅ z + u ⋅ + ε (3)
We also assume that the total cost function for all firms in our model is in proportion to the quantity produced. Moreover, firm y, a representative Japanese automaker located in the U.S., takes the exchange rate as an important factor in its total cost function. We assume that some parts produced in the homeland are necessary for Japanese automakers no matter where they make a car. According to Qiu and Spencer (2002), the long-term keiretsu supply relationship with local suppliers drives overseas Japanese automakers to keep using some native parts, though it may not be difficult for those automakers to find applicable local suppliers. Therefore, Japanese automobile manufacturers should gain most when official interventions prevent the yen/dollar rate from appreciation.
If currency interventions are implemented as a strategic trade policy to subsidize domestic manufacturers, the amount spent by the Bank of Japan in the yen/dollar market can be treated as a subsidy in proportion to the amount of outputs because interventions contribute to the depreciation of the Japanese or lessen yen. The total cost functions now become x x x x
a
Q
Q
C
S xε
+
⋅
=
y S y y a s Q Q C = y ⋅(1− )⋅ y +ε
(4),
z z z za
Q
Q
C
S Zε
+⋅
=
wheres
denotes the amount spent for intervention in the yen/dollar exchange rate by the Bank of Japan, which helps reduce manufacturing costs. Term Si
ε is a
cost for each firm, respectively (i =x, y, z).
Other specifications of our model are as follows. We assume there are no fixed and sunk costs. Furthermore, there is no exit or shutdown decision. We can construct the Euler equations for these three firms as:
⎥
⎥
⎥
⎦
⎤
⎢
⎢
⎢
⎣
⎡
+
−
+
−
−
+
−
=
⎥
⎥
⎥
⎦
⎤
⎢
⎢
⎢
⎣
⎡
⎥
⎥
⎥
⎦
⎤
⎢
⎢
⎢
⎣
⎡
z z u y y j x x j z y x u u u j j j j j ja
G
h
s
a
G
h
a
G
h
Q
Q
Q
g
f
d
g
f
d
g
f
d
υ
υ
υ
)
1
(
2
2
2
(5) Here, S x d j xε
ε
υ
= − represents the net shock (demand shock minus supply shock) to firm x.3.2 Cournot-Nash equilibrium and comparative statics
Solving the system of Euler equations for quantities yields the following Cournot-Nash equilibrium: , ) ( ) 4 ( ) 2 ( D g d g d g d g d g d Qy = Γx ⋅ u j − j u +Γy⋅ j u − u j +Γc⋅ − j j (6)
where D donates the determinant of
u u u j j j j
g
f
d
g
f
d
g
f
d
j j2
2
2
, and.
)
1
(
z z z z y y y y x x x xa
G
h
s
a
G
h
a
G
h
υ
υ
υ
+
−
=
Γ
+
−
−
=
Γ
+
−
=
Γ
There are analogous expressions for firms x and z, respectively. The proof is provided in Appendix A. To ensure that D is positive, we assume that the numerators of Eq. (5), Qx andQz, are positive. The ratio ∂Q y ∂ s measures the impact of
intervention by the Bank of Japan in the yen/dollar exchange rate on the volume sales of firm y.
(
4 −) (
⋅ ∂Γ ∂)
≥ 0. =∂
∂Q y s d jgu d ug j y s (7)
It is seen that4d jg u − d u g j ≥ 0 and ∂Γy ∂ s = ay > 0 . Therefore, we can infer that official currency intervention by the Bank of Japan benefits Japanese automakers located in the United States. Applying the same procedure, we calculate the impact of intervention on Qx and Qz as follows:
(
−
2
) (
⋅
∂
Γ
∂
)
≤
0
=
∂
∂
Q
xs
f
ug
jf
jg
u ys
(
−
2
) (
⋅
∂
Γ
∂
)
≤
0
=
∂
∂
Q
zs
d
uf
jd
jf
u ys
We also assume thatg j fu − 2gu f j ≤ 0 and fu g j − 2 f jg u ≤ 0 for these
equations and the explanations are provided in Appendix A.
3.3 Methodology for the impact of an expectation of the exchange rate
We modify the market model to include the expectation of the yen/dollar exchange rate. We take into concern the expectation of the yen/dollar exchange rate in Equation (2) in order to examine how this variable affects automobile sales volume in the United States. Specifying a complicated model factoring in the expectation of the exchange rate, however, is beyond the scope of our research. Therefore, following Faust, Rogers, and Wright (2003), Osterberg (2000), and Miah et al. (2004), we assume
,
)
(
)
(
e
e
1e
e
1u
te
s t e t s t s t s t=
−
−=
+
−
−+
Δα
β
(8)where denotes the spot exchange rate at time t, denotes the expectation at time t-1 of the exchange rate at time t. The term on the left-hand side of Eq. (8), , is the actual currency change and the sum of the terms on the right-hand side of Eq. (8) is the expected currency change.
s t e e t e s t e Δ
( ) is an unbiased estimator of . We adopt a similar assumption in our model, whereby Eq. (2) becomes
s t s t e e − −1 s t e Δ . ) ( 1 d j s t s t e e k G h Q g Q f Q d Pj = − j ⋅ x − j ⋅ y − j ⋅ z + j ⋅ − − − +
ε
(9)Here, denotes the aggregate income of the United States, in which we use real gross domestic product (GDP) as a proxy, is the firm-specific demand shocks, and > 0, > 0, >0, >0. The value of is supposed to be positive. A smoother appreciation implies that the prices of Japanese automobiles will rise less given a fixed ratio of exchange rate pass-through. We assume that there is no modification of the inverse demand function of Japanese automakers, and the demand function of American automakers also remains the same.
G d j ε dj j f gj hj k s t e Δ
We also simplify the total cost function of firm y, the representative Japanese automaker located in the United States, to focus on the effect of exchange rate expectation. The subsidy term is subtracted from Eq. (4) to form a new total cost function of firm y, Eq. (10).
. y y y y a Q Q C S y
ε
+ ⋅ = (10)The form of the profit function and the procedure of profit maximization are the same so that we can obtain the Euler equation.
, 2 2 2 ⎥ ⎥ ⎥ ⎦ ⎤ ⎢ ⎢ ⎢ ⎣ ⎡ + − + − − + − − = ⎥ ⎥ ⎥ ⎦ ⎤ ⎢ ⎢ ⎢ ⎣ ⎡ ⎥ ⎥ ⎥ ⎦ ⎤ ⎢ ⎢ ⎢ ⎣ ⎡ Δ Δ z z u y y t j x x t j z y x u u u j j j j j j a G h a e k G h a e k G h Q Q Q g f d g f d g f d υ υ υ (9) where S i d y y ε ε
υ = − represents the net shock (demand shock minus supply shock) to firm y.
3.4 Cournot-Nash equilibrium and comparative statics
Solving the system of Euler equations for quantities yields the following Cournot-Nash equilibrium:
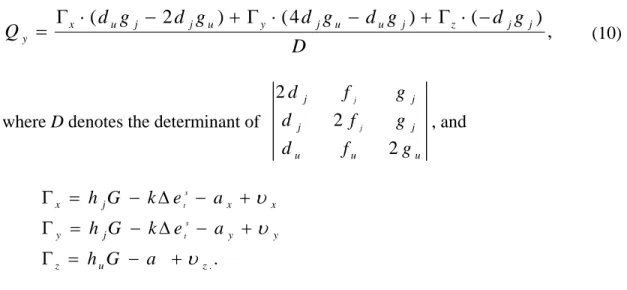
, ) ( ) 4 ( ) 2 ( D g d g d g d g d g d Qy = Γx ⋅ u j − j u + Γy ⋅ j u − u j + Γz ⋅ − j j (10)
where D denotes the determinant of
u u u j j j j g f d g f d g f d j j 2 2 2 , and . . z u z y y j y x x j x a G h a e k G h a e k G h s t s t υ υ υ + − = Γ + − Δ − = Γ + − Δ − = Γ
There are analogous expressions for firms x and y, respectively. The determinant of D is assumed to be positive. To ensure the quantity here to be positive, we assume that the numerators of Eq. (10) and as well as are positive. Following the same procedure, we calculate x Q Qz t x e Q ∂ Δ ∂ , ∂Q y ∂ Δet and∂Q z ∂ Δ et . Detailed calculations are listed in Appendix A.
0 < Δ ∂ ∂ s t e Q x 0 < Δ ∂ ∂ s t e Q y (12) . 0 > Δ ∂ ∂ s t e Q z
Figure 1 shows that the Bank of Japan began to intervene more frequently when the yen/dollar exchange rate kept appreciating. According to Karminsky and Lewis (1996) and Kim (2003), official exchange rate interventions are supposed to reveal information about the future path of monetary policy to induce expectation revisions. Consequently, it is reasonable to presume that the impressions on official interventions by the Bank of Japan will send effective signals to contaminate the original expectation of an appreciating yen/dollar exchange rate.
We look at the sample period January 2000 to October 2004, in which Japanese intervention policy was frequently adopted. A smaller - namely, less appreciation would result in increases in the sales volume by Japanese automakers but decreases in those by American automakers. This seems contrary to the prediction based on the
s t
e
exchange rate theory that an appreciation of the domestic currency reduces the sales volume of exporters. Nevertheless, if people find that the actual magnitude of appreciation is less than what they expect, they might infer that it is the monetary authority’s intervention that temporarily hold down the appreciation. Under this perspective, people might want to bring forward their future purchase of Japanese automobiles. This explains the relationship ∂Q x ∂Δ e ts < 0 , ∂ ∂ Δ < 0
s t e Q y , and ∂ ∂ Δ s > 0 . t e Q z
The Bank of Japan proclaimed to abandon the policy of official intervention in the on foreign exchange rate in the middle of March 2004. It will be interesting to collect more data to compare the impact of changes in exchange rate on the quantity sold before and after April 2004.
4. Data Description
Table 1 gives some summary statistics of the monthly data from January 2000 to October 2004. Data on the automobile quantities sold and weighted annual price of automobiles sold are obtained from Automotive News Market Data Book (ANMDB).
Monthly real GDP is calculated from the quarterly real GDP series in the
International Financial Statistics. The real exchange rate is collected from Federal Reserve Statistical Release. The data on the amount of interventions are obtained from
the Japanese Ministry of Finance (MOF). The real GDP series are expressed in 2000 real dollars and calculated by interpolating the quarterly real GDP series using the monthly industrial production index from the same source. We use real GDP as a proxy of aggregate income of consumers in the United States.
5. Empirical Results of the Impact of Official Intervention on the Sales
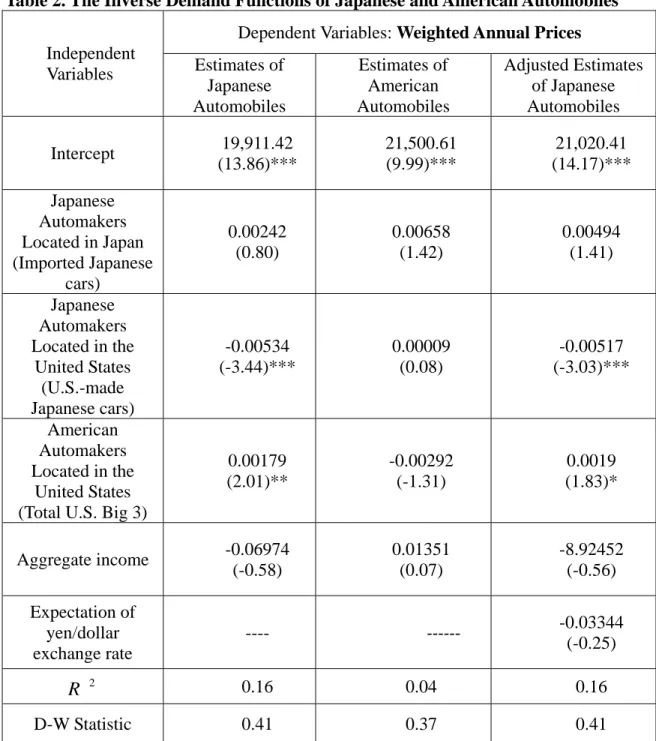
We provide empirical estimation of the inverse demands of Japan automobiles and American automobiles in Table 2.
5.1 Impact of official intervention on the sales of automakers
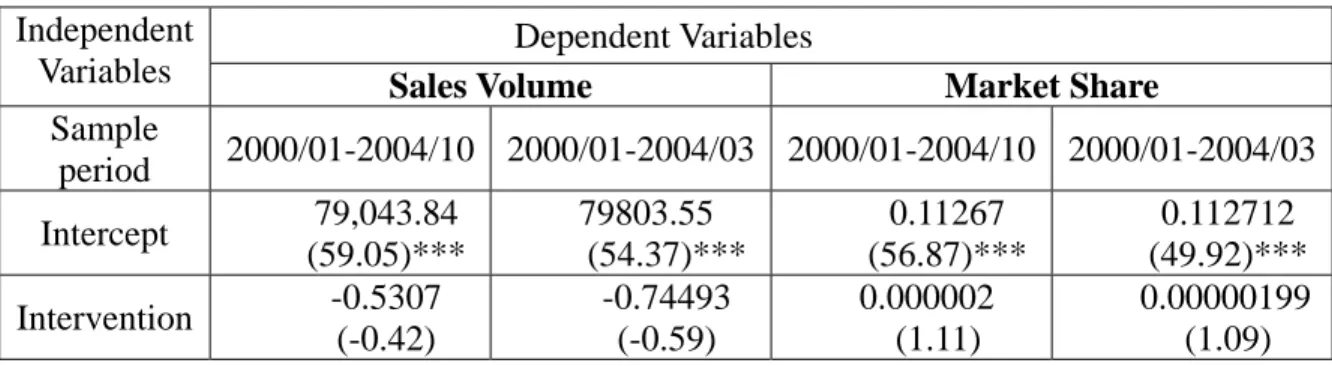
The Ministry of Finance (MOF) of Japan proclaimed in the middle of March 2004 that there would be no more official intervention on the yen/dollar exchange rate starting from April 2004. Therefore, in the Table 3 and Table 4, we provide empirical results for both the full sample period (2000/01-2004/10) and the sub-period when interventions are frequent (2000/01-2004/03).
In Table 3, our regression analyses show that the intervention by the Bank of Japan significantly reduced the sales volume of American automobile manufacturers. This result does not rebut the allegation from interest groups related to automobiles in the United States that Japanese official intervention causes unfair trade. However, not only American automobile manufacturers experienced sales volume reductions during the sample period, so did the Japanese manufacturers. One explanation is that there may be recessions in the automobile industry when the Bank of Japan actively intervened the foreign exchange market.
5.2 Impact of official intervention on the market shares of automakers
The right-hand side of Table 3 provides another facet of how official interventions affect the manufacturers in the U.S. automobile market. Panel A and B show that the market shares of both types of Japanese automakers in our model increase while their sales volume falls. As for the American automakers, Panel C shows that increasing official intervention by the Bank of Japan not only reduces their sale volume, but also decreases their market shares in the U.S. markets. This result verifies the use of exchange intervention as a strategic trade policy.
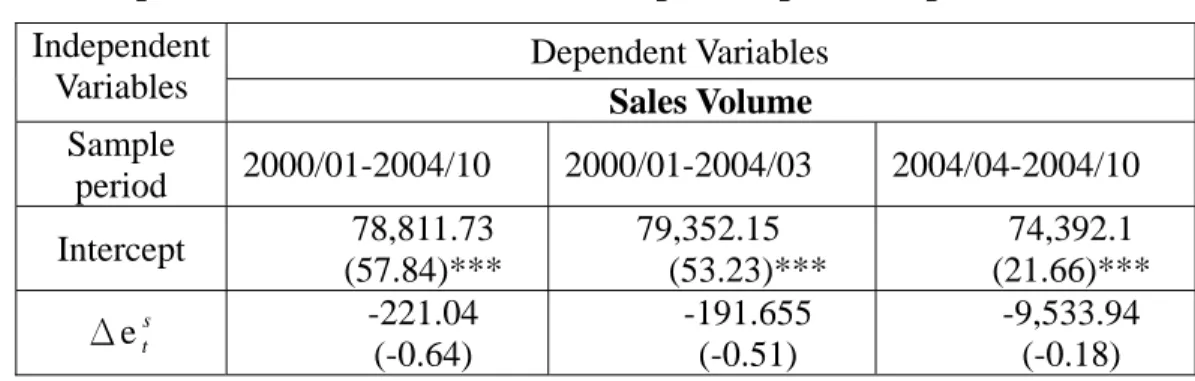
5.3 Effects of Exchange Rate Expectation on Sales Volume
that in Panel B, the coefficients ofΔe for the sub-sample period before and after March 2004 are both significant but of different signs. This result is consistent with our prediction that when intervention are frequent, a smaller appreciation in yen/dollar exchange rate will increase current demand as the consumer interpret it as a result of intervention of the Bank of Japan. After the proclamation of MOF of Japan, however, consumers just take the appreciation as a market equilibrium outcome. Hence an appreciation would simply dampen the sales volume.
s t
6. Summary and Conclusions
Maintaining an undervalued exchange is often regarded as a subsidy to domestic exporters. We investigate the effects of Japanese foreign exchange interventions on the sales of both American and Japanese automakers by considering a model with three representative automakers in the U.S. markets. Furthermore, we examine whether changes in the appreciation expectation of the yen/dollar exchange rate resulted from the interventions by the Bank of Japan did increase the sales volume of Japanese automakers.
Empirical results show that interventions by the Bank of Japan significantly reduce the sales volume and market shares in the U.S markets of American automakers while the Japanese automakers gained market shares. Empirical results also show that when interventions are frequent, a smaller than expected appreciation will bring forward consumers’ future demand and increase current sales.
Before we can conclude that the foreign exchange interventions by the Bank of Japan had been successful in playing the role of a strategic trade policy in this ongoing project, we would like to incorporate more recently data into our analysis. In the current version of the paper, we estimated the cost subsidization effect of exchange rate interventions and consumers’ expectation effect separately. Interesting comparison will be available when we develop a model where both effects are considered in the same time.
Appendix A. Proof
Appendix A.1 The determinant of D
According to the normal properties of an inverse demand function, we suppose that
, from the Eq. (2) and that ,
j j g
d > f j > g j d j ≅ f j gu > du gu > fu du ≅ fu
from Eq. (3) to determine the determinant of D. These relationships are also verified by the empirical results of Goldberg (1995). Moreover, we assume that the corresponding coefficients in the two equations do not differ from their counterparts. Hence the matrix
D is . 2 2 2 ⎥ ⎥ ⎥ ⎦ ⎤ ⎢ ⎢ ⎢ ⎣ ⎡ u u u j j j j j j g f d g f d g f d (A1)
Therefore, the determinant of D is calculated and judged to be positive:
. 0 ) 6 ( ) ( ) 2 ( ) 4 ( 2 > − − = − + − + − = j u j j u u j j j j u u j j u j j u u j j g f d g d g d f g f d g f g f d g f g f d D (A2)
Appendix A.2 The Proof of Equation (7)
Under the premises that dj > gj, fj > g j,dj ≅ fj,gu > du , gu > fu and du ≅ fu,
the corresponding coefficients in the two equation do not deviate from their counterparts stated in Appendix C.1. The relationships, 4 d j g u − d u g j ≥ 0 ,
, and 0 2 ≤ − u j u j f g f
g fu g j − 2 f jg u ≤ 0 , that are necessary to hold Eq. (7) can be judged as well.
Appendix A.3 The Proof of Equation (12)
After the same premises we use in the previous section, the detailed calculations of Eq (12) are calculated as follows:
(
)
0 ) 2 ( ) ( ) 2 ( ) ( 4 < − = Δ ∂ Γ ∂ ⋅ − + Δ ∂ Γ ∂ ⋅ − = Δ ∂ ∂ u j y u j j u x j u u j x g f k e g f g f e g f g f e Q s t s t s t(
)
0 ) 2 ( ) ( ) 4 ( ) ( 2 < − = Δ ∂ Γ ∂ ⋅ − + Δ ∂ Γ ∂ ⋅ − = Δ ∂ ∂ u j y j u u j x u j j u y g d k e g d g d e g d g d e Q s t s t s t (A3)(
)
. 0 ) ( ) ( ) 2 ( ) ( > − − = Δ ∂ Γ ∂ ⋅ − + Δ ∂ Γ ∂ ⋅ − = Δ ∂ ∂ j u y j u u j x u j j u z d f k e d f d f e d f d f e Q s t s t s tReferences:
[1] Abel, Andrew B. 2002. An Exploration of the Effects of Pessimism and Doubt on Asset Returns. Journal of Economic Dynamics & Control26.7-8: 1075-1092
[2] Barber, Brad M., Reid W. Click and Masako N. Darrough. 1999. The Impact of Shocks to Exchange Rates and Oil Prices on U.S. Sales of American and Japanese Automakers. Japan and World Economy 11: 57-93.
[3] Brainard, S. Lael and David Martimort. 1997. Strategic Trade Policy with Incompletely Informed Policymakers. Journal of International Economics 42:33-65.
[4] Bergin, Paul R. 2003. Devaluations and Consumption Smoothing. Review of
International Economics 11(5): 875–884.
[5] Bernhofen, Danial M. and Peng Xu. 2000. Exchange Rates and Market Power: Evidence from the Petrochemical Industry. Journal of International
Economics 52: 283-297.
[6] Berry, Steven, James Levinsohn, and Ariel Pakes. 1999, Voluntary Export Restraints on Automobiles: Evaluating a Trade Policy. The American Economic
Review 89 No.3: 400-430.
[7] Corsetti, Giancarlo., Paolo Pesenti, Nouriel Roubini and Cedric Tille. 2000. Competitive Devaluations: toward A Welfare-Based Approach. Journal of
International Economics 51: 217-241
[8] Eaton, J. and G.M Grossman. 1986. Optimal Trade and Industrial Policy under Oligopoly. Journal of Economics 51: 383.
[9] Enomoto, Carl. E and Kenichiro Chinen. 2001. Public Perceptions of U.S.-Japan Trade Relations in the 1990s. Multinational Business Review 9: 1257-1292.
[10] Fang, K.C., Hitomi Iizaka, Paul Lau and Chelsea Lin. 2002. The Political Economy of the Japanese Yen and the U.S.-Japan Trade Conflict. Journal of
[11] Fratzscher, Marcel. 2004. COMMUNICATION AND EXCHANGE RATE POLICY. European Central Bank working paper No.363.
[12] Feenstra, Robert C. 2004. Advanced International Trade –THEORY AND EVIDENCE. Princeton University Press.
[13] Feenstra, Robert C., Joseph E. Gagnon and Michael M. Knetter. 1996. Market Share and Exchange Rate Pass-Through in World Automobile Trade.
Journal of International Economics 40: 187-207.
[14] Frenkel, Michael., Christian Pierdziochb and Georg Stadtmann. 2005. The Effects of Japanese Foreign Exchange Market Interventions on the Yen/U.S. Dollar Exchange Rate Volatility. International Review of Economics and
Finance 14: 27–39.
[15] Giovanni, Olivei P. 2002. Exchange Rates and the Prices of Manufacturing Products Imported into the United States. New England Economic Review 2002: 27-47.
[16] Goldberg, Pinelopi Koujianou. 1995. Product Differentiation and Oligopoly in International Markets: The Case of the U.S. Automobile Industry. Journal of
Econometrica 63 No.4: 891-951.
[17] Goldberg, Michael D. and Roman Frydman. 2001. Macroeconomic Fundamentals and the DM/$ Exchange Rate: Temporal Instability and the Monetary Model. International Journal of Finance & Economics 6. 4: 421-435.
[18] Huang, Jui-Chi and Tantatape Brahmasrene. 2003. The Effect of Exchange Rate Expectations on Market Share Commendation. Managerial Finance 29.1: 101-127.
[19] Johnson, Bryan T. and O’Quinn, Robert P. 1995. The U.S.-Japan Trade Agreement: A Failure for Clinton, A Victory for America., Cornell University, and University of Illinois working paper.
[20] Kaminsky, Graciela. 1993. Is There a Peso Problem Evidence from the Dollar Pound Exchange Rate, 1976-1987. The American Economic Review 83.3: 450-472.
[21] Kaminsky, Graciela. and Karen K. Lewis. 1996. Does Foreign Exchange Intervention Signal Future Monetary Policy? Journal of Monetary Economics 37: 285-312.
[22] Kashyap, Anil K. and David W. Wilcox. 1993. Production and Inventory Control at the General Motors Corporation during 1920’s and 1930’s.
American Economic Review 83.3: 383-401.
[23] Kim Soyoung. 2003. Monetary policy, Foreign Exchange Intervention, and the Exchange Rate in A Unifying Framework. Journal of International
Economics 60: 355–386.
[24] Krishna, Kala., Kathleen Hogan, and Phillip Swagel. 1993. The Nonoptimality of Optimal Trade Policies: The U.S. Automobile Industry Revisited, 1979-1985. Journal of Financial and Quantitative Analysis 28: 273-284.
[25] Levinsohn, James. 1995. Carwars: Trying to Make Sense of U.S.-Japan Trade Fictions in the Automobile and Automobile Parts Markets Journal of
Business Finance and Accounting 22: 659-670.
[26] Lincoln, E.J. 1999. Troubled Times: U.S.-Japan Trade Relations in the 1990s. Washington, DC: Brookings Institution Press.
[27] McKinnon, Ronald I. 1998. International Money: Dollars, Euros, or Yen? Unpublished paper. Stanford University.
[28] McKinnon, Ronald. I. 1999. Strong Yen fears. The International Economy 13. 2: 38-42
[29] Miah, Fazlul., M Kabir Hassan. and S M Ikhtiar Alam. 2004. Testing the Rationality of Exchange Rate Expectations:Evidence from Survey Data.
American Business Review 22. 1: 11-20
[30] Osterberg, William P. 2000. New Results on the Rationality of Survey Measures of Exchange-rate Expectations. Economic Review - Federal Reserve
[31] Pekkanen, Saadia M. 1999. Aggressive Legalism: The Rules of the WTO and Japan’s Emerging Trade Strategy. New England Political Science
Association 5-6: 707-737.
[32] Raff, Horst., Young-Han Kim. and Womack, Kent L. 1996. Optimal Export Policy in the Presence of Informational Barriers to Entry and Imperfect Competition. Journal of International Economics 49: 99-123.
[33] Schawartz, Anna J. 2000. The Rise and Fall of Foreign Exchange Market: Intervention as a Policy Tool. Journal of Financial Services Research 18.2/3:
319-339.
[34] Sill, Keith. 2000. Understanding Asset Values Stock Price, Exchange Rate and Peso Problem. Business Review 3: 3-14.
[35] Swenson, Deborah. L. 2001. Explaining Domestic Content: Evidence from Japanese and U.S Automobile Production in the United States. Journal of
Finance 56: 531-563.
[36] Tapia, Matías. and Andrea Tokman. 2004. Effects of Foreign Exchange Intervention under Public Information: The Chilean Case. Central Bank of Chile Working Papers No. 255.
[37] Tille, Cedric. 2001. The Role of Consumption Substitutability in the International Transmission of Monetary Shocks. Journal of International
Economics 53: 421–444.
[38] Veronesi, Pietro. 2004. The Peso Problem Hypothesis and Stock Market Returns. Journal of Economic, Dynamics and Control 28.4: 707-725
Table 1: Descriptive Statistics
Notes: Data resource: the quantity sold and weighted annual price of automobiles sold are from Automotive News
Market Data Book. Total Big 3 consists of Chrysler, Ford, and GM. The exchange rate is yen/dollars and collected from Federal Reserve Statistical Release. Monthly real GDP is calculated from the quarterly real GDP series in International Financial Statistics. The data of intervention amount are from Minister of Finance (MOF) of Japan.
Mean Std. Dev. Minimum Maximum
Quantity of imported
Japanese cars sold 78,626.07 10,416.25 61,826 114,644 Quantity of U.S.-made
Japanese cars sold 163,338.7 22,591.99 112,088 211,353 Quantity of American-made
American cars sold (Total U.S. Big 3)
332,957.7 65,077.08 222,059 470,133
Spot yen/dollar Exchange
Rate 116.21 7.96 102.73 134.06
Real GDP 10,166.31 362.46 9,604.9 10,957.9
Intervention Amounts by the
Bank of Japan 801.01 1496.05 0.00 6821.50
Weighted annual price of
Table 2. The Inverse Demand Functions of Japanese and American Automobiles Dependent Variables: Weighted Annual Prices Independent Variables Estimates of Japanese Automobiles Estimates of American Automobiles Adjusted Estimates of Japanese Automobiles Intercept 19,911.42 (13.86)*** 21,500.61 (9.99)*** 21,020.41 (14.17)*** Japanese Automakers Located in Japan (Imported Japanese cars) 0.00242 (0.80) 0.00658 (1.42) 0.00494 (1.41) Japanese Automakers Located in the United States (U.S.-made Japanese cars) -0.00534 (-3.44)*** 0.00009 (0.08) -0.00517 (-3.03)*** American Automakers Located in the United States (Total U.S. Big 3)
0.00179 (2.01)** -0.00292 (-1.31) 0.0019 (1.83)* Aggregate income -0.06974 (-0.58) 0.01351 (0.07) -8.92452 (-0.56) Expectation of yen/dollar exchange rate ---- --- -0.03344 (-0.25) 2 R 0.16 0.04 0.16 D-W Statistic 0.41 0.37 0.41
Notes: The dependent variable is the price, a weighted average value of the price of the entire Japanese brand listed in the Automotive News Market Data Book. The weight is the market share of each brand. * represents significant at the 10 % level. ** represents significance at the 5 % level. *** represents significance at the 1 % level.
d j G h Q g Q f Q d Pj = − j ⋅ x − j ⋅ y − j ⋅ z + j ⋅ +ε , Pu = −du ⋅Qx − fu ⋅Qy − gu ⋅Qz + hu ⋅G +εud
Table 3. Impacts of Intervention on Sales Volume and Market Shares Panel A: Japanese Automakers Located in Japan (Imported Japanese cars)
Dependent Variables Independent
Variables Sales Volume Market Share
Sample period 2000/01-2004/10 2000/01-2004/03 2000/01-2004/10 2000/01-2004/03 Intercept 79,043.84 (59.05)*** 79803.55 (54.37)*** 0.11267 (56.87)*** 0.112712 (49.92)*** Intervention -0.5307 (-0.42) -0.74493 (-0.59) 0.000002 (1.11) 0.00000199 (1.09)
Panel B: Japanese Automakers Located in the United States (U.S.-made Japanese cars)
Dependent Variables Independent
Variables Sales Volume Market Share
Sample period 2000/01-2004/10 2000/01-2004/03 2000/01-2004/10 2000/01-2004/03 Intercept 164,928.7 (51.57)*** 161,874.3 (47.88)*** 0.233652 (70.61)*** 0.226626 (87.31)*** Intervention -2.0198 (-1.15) -1.1585 (-0.65) 0.00000301 (1.39) 0.0000049 (2.68)***
Panel C: American Automakers Located in the United States (Total U.S. Big 3) Dependent Variables
Independent
Variables Sales Volume Market Share
Sample period 2000/01-2004/10 2000/01-2004/03 2000/01-2004/10 2000/01-2004/03 Intercept 342,101.2 (35.71)*** 352,046.5 (33.64)*** 0.4809 (74.45)*** 0.4899 (73.78)*** Intervention -11.6151 (-3.03)*** -14.4196 (-3.82)*** -0.00000563 (-2.79)*** -0.00000818 (-4.20)***
Notes: Intervention represents the amount of official intervention on the yen/dollar markets by the Bank of Japan. * represents significance at the 10 % level. ** represents significance at the 5 % level. *** represents significance at the 1 % level. Numbers in the parentheses are t-statistics.
Table 4. Effects of Exchange Rate Expectation on Sales Volume
Panel A: Japanese Automakers Located in Japan (Imported Japanese cars) Dependent Variables
Independent
Variables Sales Volume
Sample period 2000/01-2004/10 2000/01-2004/03 2004/04-2004/10 Intercept 78,811.73 (57.84)*** 79,352.15 (53.23)*** 74,392.1 (21.66)*** Δets -221.04 (-0.64) -191.655 (-0.51) -9,533.94 (-0.18)
Panel B: Japanese Automakers Located in the United States (U.S.-made Japanese cars)
Dependent Variables Independent
Variables Sales Volume
Sample period 2000/01-2004/10 2000/01-2004/03 2004/04-2004/10 Intercept 163,824.7 (56.98)*** 161,269.6 (54.21)*** 187,519.1 (29.36)*** Δets -1,490.36 (-1.88)* -1,745.49 (-1.93)* 264,069.3 (1.99)**
Panel C: American Automakers Located in the United States (Total U.S. Big 3) Dependent Variables
Independent
Variables Sales Volume
Sample period 2000/01-2004/10 2000/01-2004/03 2004/04-2004/10 Intercept 332,977.4 (38.60)*** 339,269.1 (35.90)*** 295,481.6 (40.54)*** Δets -70.99 (-0.02) -254.35 (-0.08) -47,379.3 (-0.28)
Notes: Intervention represents the amount of official intervention on the yen/dollar markets by the Bank of Japan. * represents significance at the 10 % level. ** represents significance at the 5 % level. *** represents significance at the 1 % level. Numbers in the parentheses are t-statistics.
Figure 1. Japanese interventions and the yen/dollar rate over the period
January 2000 to December 2004
(Note that the scale of monthly intervention
volume is on the right-hand side of the figure)
80 90 100 110 120 130 140 150
Jan-00Mar-00May-00Jul-00Sep-00Nov-00Jan-01Mar-01May-01Jul-01Sep-01Nov-01Jan-02Mar-02May-02Jul-02Sep-02Nov-02Jan-03Mar-03May-03Jul-03Sep-03Nov-03
Yen/dollar rate 0 1000 2000 3000 4000 5000 6000 Intervention volume (billion yen)