Chun-Yuh Yang
Cerebrovascular Disease
Calcium and Magnesium in Drinking Water and Risk of Death From
ISSN: 1524-4628
Copyright © 1998 American Heart Association. All rights reserved. Print ISSN: 0039-2499. Online Stroke is published by the American Heart Association. 7272 Greenville Avenue, Dallas, TX 72514
doi: 10.1161/01.STR.29.2.411
1998, 29:411-414
Stroke
http://stroke.ahajournals.org/content/29/2/411
located on the World Wide Web at:
The online version of this article, along with updated information and services, is
http://www.lww.com/reprints
Reprints: Information about reprints can be found online at
410-528-8550. E-mail:
Kluwer Health, 351 West Camden Street, Baltimore, MD 21202-2436. Phone: 410-528-4050. Fax: Permissions: Permissions & Rights Desk, Lippincott Williams & Wilkins, a division of Wolters
http://stroke.ahajournals.org//subscriptions/
Death From Cerebrovascular Disease
Chun-Yuh Yang, PhD, MPH
Background and Purpose—Many studies have demonstrated a negative association between mortality from cardiovascular or cerebrovascular diseases and water hardness. This report examines whether calcium and magnesium in drinking water are protective against cerebrovascular disease.
Methods—All eligible cerebrovascular deaths (17 133 cases) of Taiwan residents from 1989 through 1993 were compared with deaths from other causes (17 133 controls), and the levels of calcium and magnesium in drinking water of these residents were determined. Data on calcium and magnesium levels in drinking water throughout Taiwan were obtained from the Taiwan Water Supply Corporation. The control group consisted of people who died from other causes, and the controls were pair matched to the cases by sex, year of birth, and year of death.
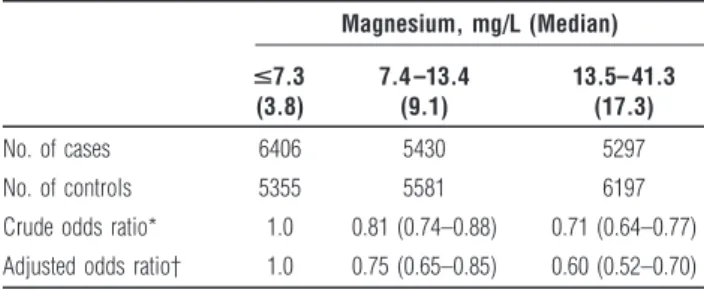
Results—The adjusted odds ratios (95% confidence interval) were 0.75 (0.65 to 0.85) for the group with water magnesium levels between 7.4 and 13.4 mg/L and 0.60 (0.52 to 0.70) for the group with magnesium levels of 13.5 mg/L or more. After adjustment for magnesium levels in drinking water, there was no difference between the groups with different levels of calcium.
Conclusions—The results of the present study show that there is a significant protective effect of magnesium intake from drinking water on the risk of cerebrovascular disease. This is an important finding for the Taiwan water industry and human health. (Stroke. 1998;29:411-414.)
Key Words:calciumn cerebrovascular disorders n magnesium n mortality
T
he relationship between water hardness and mortality from cardiovascular disease has been studied for more than 40 years. The association was first described in Japan,1where a significant correlation between drinking water quality and mortality from cerebrovascular disease was found. Subse-quently, a number of studies conducted in various countries have demonstrated a negative association between cardiovas-cular disease mortality and water hardness.2–11
In Taiwan, cerebrovascular disease is the third leading cause of deaths for men and the second for women.12
The age-adjusted mortality rate for cerebrovascular disease was 75.88 per 100 000 among men and 56.44 among women in 1995. In addition, there is substantial geographic variation in cerebro-vascular mortality within the country. Such a geographic distribution may suggest an environmental risk factor.
The hardness of drinking water is determined largely by its content of calcium and magnesium. It is expressed as the equivalent amount of calcium carbonate that could be formed from the calcium and magnesium in solution.
Two theories have been offered concerning the causative agent responsible for the relationship between death from cardiovascular or cerebrovascular disease and water hardness. Soft water is more corrosive than hard water and promotes the dissolution of cadmium, lead, and other toxic substances from the plumbing system into the drinking water.13
Another theory is that there is a protective effect from magnesium in water.14 –16
The former hypothesis could not be tested in his study because the levels of lead and cadmium in drinking water were not available. The objective of this study was to study the relationship between the levels of calcium and magnesium in drinking water and death from cerebrovascular disease in Taiwan.
Methods
Taiwan is divided into 361 administrative districts, which will be referred to in this report as municipalities. They are the units that will be subjected to statistical analysis. Excluded from the analysis were 30 aboriginal townships and 9 islets that had different lifestyles and living environments. This elimination of unsuitable municipalities left 322 municipalities for the analysis.
Data on all deaths of Taiwan residents from 1989 through 1993 were obtained from the Bureau of Vital Statistics of the Taiwan Provincial Department of Health, which is in charge of the death registration system in Taiwan. For each death, detailed demographic information, including sex, year of birth, year of death, cause of death, place of death (municipality), and residential district (municipality) were recorded on computer tapes. The case group consisted of all eligible cerebrovascular disease deaths occurring in people between 50 and 69 years of age (International Classification of Diseases, 9th Revision [ICD-9] codes 430 to 438). A control group was formed that consisted of all other deaths with the exclusion of those deaths that were associated with cardiovascular disease. The deaths excluded were those caused by hypertensive disease (ICD codes 401 to 405), ischemic heart disease (ICD codes 410 to 414), diseases of pulmonary circulation (ICD codes 415 to 417), other forms of heart disease (ICD codes 420
Received September 2, 1997; final revision received November 4, 1997; accepted November 4, 1997. From the School of Public Health, Kaohsiung Medical College, Kaohsiung, Taiwan, Republic of China.
Correspondence to Chun-Yuh Yang, School of Public Health, Kaohsiung Medical College, 100 Shih-Chuan 1st RD, Kaohsiung 80708, Taiwan, ROC. E-mail [email protected]
© 1998 American Heart Association, Inc.
to 429), cerebrovascular disease (ICD codes 430 to 438), and diseases of the arteries, arterioles, and capillaries (ICD codes 440 to 448). Subjects who died from gastric cancer (ICD code 151) were also excluded from the control group because of a previously reported negative correlation with hardness (calcium or magnesium) levels in drinking water.17
Control subjects were pair matched to the cases by sex, year of birth, and year of death. Each matched control was selected randomly from the set of possible controls for each case. Each case and its matched control had residence and place of death in the same municipality. For controls, the most frequent causes of death were diabetes mellitus (9.5%), liver cancer (9.3%), diseases of the respiratory system (8.3%), lung cancer (8.0%), chronic liver disease and cirrhosis (7.8%), and diseases of the genitourinary tract (4.7%).
Information on the levels of calcium and magnesium in each municipality’s treated drinking water supply was obtained from the Water Quality Research Center of Taiwan Water Supply Corpora-tion,18
to whom each waterworks is required to submit drinking water quality data, including the levels of calcium and magnesium. They also conduct routine water analyses to assess the suitability of water for drinking from both the sources and at various points in the distribution system. Four finished water samples, one for each season, were collected from each waterworks. The samples were then analyzed by the waterworks laboratory office using standard methods. Since the laboratory office examines calcium and magnesium levels on a routine basis using standard methods, it was thought that the problem of analytical variability was minimal. Among the 322 municipalities, 70 were excluded because they were supplied by more than one waterworks and the exact population served by each waterworks could not be determined. The final complete data consisted of drinking water quality data from 252 municipalities.
Hardness (calcium and magnesium) remains reasonably constant for long periods of time and is a quite stable characteristic of a munici-pality’s water supply.19 Some information on the levels of water hardness was available for the study areas in 1980. The correlation between 1980 and 1990 hardness levels for the study areas was reasonably high (r5.85). The waterworks in each municipality re-ceived a questionnaire requesting information on whether any changes had occurred in the water supply or the treatment of the water during the past 20 years. No municipalities were excluded because of changes in water quality (eg, the use of water softeners) during the past few decades. It was believed that the hardness (calcium and magnesium) levels in drinking water have remained reasonably stable. We therefore assumed that calcium and magnesium levels in 1990 were a reasonable indicator of historical calcium and magnesium exposure levels from drinking water. Data collected included the mean levels of calcium and magnesium for the year 1990. The municipality of residence for all cases and controls was identified from the death certificate and was assumed to be the source of the subject’s calcium and magnesium exposure through drinking water. The levels of calcium and magne-sium of that municipality were used as an indicator of exposure to those substances for an individual residing in that municipality.
In the analysis, the subjects were divided into tertiles according to the levels of calcium and magnesium in their drinking water. Condi-tional logistic regression was used to estimate the relative risk in relation to the calcium and magnesium levels in drinking water. We calculated odds ratio and their 95% confidence intervals (CIs) using the group with the lowest exposure as the reference group.20Coefficients with values of P,.05 were considered statistically significant.
Results
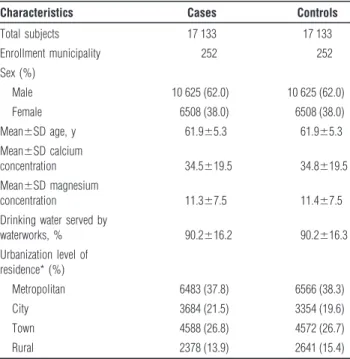
A total of 17 133 cerebrovascular disease cases with complete records were collected for the period 1989 to 1993. Of the 17 133 cases, 10 625 were men and 6508 were women. The mean calcium concentration in the drinking water of the cases (n517 133) was 34.5 mg/L (SD519.5). Controls (n517 133) had a mean calcium exposure of 34.8 mg/L (SD519.5). The mean magnesium concentration in the drinking water was 11.3 mg/L (SD57.5) for the cases and 11.4 mg/L (SD57.5) for the controls. Both cases and controls had a mean age of 61.9 years.
Both cases and controls lived in municipalities in which 90.2% of the population were served by a waterworks. Cases had a similar rate (37.8%) of living in metropolitan municipalities compared with the controls (38.3%) (Table 1).
Table 2 shows the numbers of cases and controls and odds ratios in relation to calcium levels in their drinking water. The crude odds ratios were significantly lower than 1.0 for the group with the highest calcium level (0.94; 95% CI, 0.89 to 0.99), but when adjusted for magnesium levels there was no difference between the groups with different levels of calcium. The odds ratios in relation to magnesium levels in drinking water are shown in Table 3. The odds ratios for death from cerebrovascular diseases were significantly lower for the two groups with high levels of magnesium in their drinking water. Adjustments for possible confounders only slightly altered the odds ratios. The adjusted odds ratios (95% CI) were 0.75 (0.65 to 0.85) for the group with water magnesium levels between 7.4 and 13.4 mg/L and 0.60 (0.52 to 0.70) for the group with magnesium levels of 13.5 mg/L or more.
TABLE 1. Characteristics of the Study Population
Characteristics Cases Controls Total subjects 17 133 17 133 Enrollment municipality 252 252 Sex (%) Male 10 625 (62.0) 10 625 (62.0) Female 6508 (38.0) 6508 (38.0) Mean6SD age, y 61.965.3 61.965.3 Mean6SD calcium concentration 34.5619.5 34.8619.5 Mean6SD magnesium concentration 11.367.5 11.467.5 Drinking water served by
waterworks, % 90.2616.2 90.2616.3 Urbanization level of residence* (%) Metropolitan 6483 (37.8) 6566 (38.3) City 3684 (21.5) 3354 (19.6) Town 4588 (26.8) 4572 (26.7) Rural 2378 (13.9) 2641 (15.4) *The urbanization level of each municipality was based on the urban-rural classification scheme of Tzeng and Wu.37
TABLE 2. Odds Ratios and 95% Confidence Intervals for
Cerebrovascular Death by Calcium Levels in Drinking Water, 1989 –1993 Calcium, mg/L (Median) <24.0 (9.2) 24.4 – 42.3 (34.6) 42.4 – 81.0 (57.0) No. of cases 5474 6081 5578 No. of controls 5442 5795 5896 Crude odds ratio* 1.0 1.04 (0.99–1.11) 0.94 (0.89–0.99) Adjusted odds ratio† 1.0 1.05 (0.98–1.12) 0.95 (0.88–1.01)
*Odds ratio adjusted for age and sex.
†Adjusted for age, sex, urbanization level of residence, and magnesium levels in drinking water.
Discussion
This study uses a death certificate– based case-control study and a drinking water quality ecology study to examine the rela-tionship between cerebrovascular mortality and calcium and magnesium exposure from drinking water in Taiwan. The results of the present study show that there is significant protective effect of magnesium intake from drinking water on the risk of cerebrovascular disease. Despite their inherent limitations,21
studies on the ecological correlation between mortality and environmental exposures have been used widely to generate or discredit epidemiological hypotheses. The completeness and accuracy of a death registration system should be evaluated before any conclusion based on the mortality analysis is made. Since it is mandatory to register death certificates at local household registration offices and since the household registration information is verified annu-ally through a door-to-door survey, the death registration in Taiwan is very complete. Although causes of death may be misdiagnosed and/or misclassified, the problem has been min-imized through the improvement in the verification and classification of causes of death in Taiwan since 1972. Further-more, Taiwan is a small island with a convenient communi-cation network, and the accessibility of medical service facili-ties is comparable among study municipalifacili-ties. Mortality data differences between the municipalities in this study do not appear to result from systematic differences in recording and codification.
Migration from a municipality of high calcium and magne-sium exposure to one of low calcium and magnemagne-sium exposure or vice versa could have introduced misclassification bias and bias in the odds ratio estimate.22,23
The individuals included in the present study were subjects whose residence and place of death were in the same municipality. In the event of a death in Taiwan, there is a social custom that the decedent’s family always considers the death to occur in the municipality where he was born. Therefore, the decedent’s residence, place of birth, and place of death are likely to be listed as the same municipality, although the place of birth information was not available for this data set. We believe that this ameliorates the migration problem. In addition, all the subjects used for the present study were at least 50 years old, and it is assumed that the elderly are more likely to remain in the same residence and
therefore that most of their life was spent at the address listed on the death certificate.
Dietary calcium is the main source of calcium intake. Epidemiological studies have shown that dietary calcium is inversely associated with blood pressure.24 –28
With much of the epidemiological literature suggesting a relationship between dietary calcium and blood pressure, it would seem reasonable to expect that intake of dietary calcium could reduce the risk of cardiovascular events, such as stroke, that are commonly associated with hypertension. In Taiwan, the mean daily intake of dietary calcium is 507 mg. This figure is only 81.9% of the recommended daily intake.29The mean calcium concentration
in Taiwan’s drinking water is 34.7 mg/L. This figure would contribute, on average, 13.7% to an individual’s total dietary calcium intake, given a daily consumption of 2 L of water. One may hypothesize that waterborne calcium can make an impor-tant contribution to the total daily intake for subjects with insufficient calcium intake. However, controlling for magne-sium levels eliminates the perceived effect of calcium levels on cerebrovascular mortality. The reason for not finding a pro-tective effect of calcium on risk of cerebrovascular death may be because calcium and magnesium in the drinking water are highly correlated (correlation coefficient, .65). This may create collinearity in the regression model, making it difficult to detect the effect of calcium.
In the general population, the major proportion of magne-sium intake is through food, and a smaller proportion is through drinking water (in Sweden, generally ,5% is from drinking water).10
There are no available data for assessing the percentage that drinking water contributes to the total mag-nesium intake in the present study. Nonetheless, in the modern world intake of dietary magnesium is often lower than the recommended dietary amounts of 6 mg/kg per day.30
For individuals with borderline magnesium deficiency, waterborne magnesium can make an important contribution to their total intake. In addition, the loss of magnesium from food is lower when the food is cooked in magnesium-rich water.31
Magne-sium in water can also play a critical role because of its higher bioavailability. Magnesium in water appears as hydrated ions, which are more easily absorbed than magnesium in food.30,32
The contribution of water magnesium among persons who drink water with high magnesium levels could thus be crucial in the prevention of magnesium deficiency.
The significant association between mortality from cerebro-vascular disease and the levels of magnesium in drinking water is supported by knowledge of the functions of magnesium. Magnesium is an enzyme (Na/K-ATPase) activator and regu-lates cellular energy metabolism, vascular tone, and cell mem-brane ion transport. A lack of magnesium leads to a decrease in the concentration of intracellular potassium and an increase in calcium levels.33
Magnesium deficiency may increase the con-tractility of blood vessels, as shown in animal experiments.34
Magnesium causes vasodilation by stimulation of endothelial prostacyclin release35and, in vivo, prevents vasoconstriction of
the intracranial vessels after experimental subarachnoid hemorrhage.36
Smoking habits and hypertension represent possibly impor-tant confounders in the present study. There is unfortunately no information available on these variables for individual study
TABLE 3. Odds Ratios and 95% Confidence Intervals for
Cerebrovascular Death by Magnesium Levels in Drinking Water, 1989 –1993 Magnesium, mg/L (Median) <7.3 (3.8) 7.4 –13.4 (9.1) 13.5– 41.3 (17.3) No. of cases 6406 5430 5297 No. of controls 5355 5581 6197 Crude odds ratio* 1.0 0.81 (0.74–0.88) 0.71 (0.64–0.77) Adjusted odds ratio† 1.0 0.75 (0.65–0.85) 0.60 (0.52–0.70)
*Odds ratio adjusted for age and sex.
†Adjusted for age, sex, urbanization level of residence, and calcium levels in drinking water.
subjects, and they could not be adjusted for directly in the analysis. However, there is no reason to believe that there would be any correlation between these confounders and the levels of magnesium of the water. It is also unlikely that there would be a direct relationship between other risk factors and the level of magnesium in drinking water. In addition, fear of cerebrovascular disease should not deter anyone from drinking water with low magnesium levels.
In conclusion, the results of the present study show that there is a significant protective effect of magnesium intake from drinking water on the risk of cerebrovascular disease. This is an important finding for the Taiwan water industry and human health risk assessment. Future studies should increase the precision of the estimation of the individual’s intake of calcium and magnesium, through both food and water, and control for confounding factors, especially personal risk factors such as smoking and hypertension.
Acknowledgment
This study was supported in part by a grant from the National Science Council, Executive Yuan, Taiwan (NSC-86 –2314-B-037– 089).
References
1. Kobayashi J. Geographical relationship between chemical nature of river water and death rate from apoplexy. Berichte d Ohara Inst of landwirtsch
Biologie. 1957;11:12–21.
2. Biorck G, Bostrom H, Widstrom A. On the relationship between water hardness and death rate in cardiovascular disease. Acta Med Scand. 1965; 178:239 –252.
3. Leoni V, Fabiani L, Ticchiarelli L. Water hardness and cardiovascular mortality rate in Abruzzo, Italy. Arch Environ Health. 1985;40:274 –278. 4. Morin M, Sharrett R, Bailey K. Drinking water source and mortality in US
cities. Int J Epidemiol. 1985;14:254 –264.
5. Morris JN, Crawford MD, Heady JA. Hardness of local water supplies and mortality from cardiovascular disease. Lancet. 1961;1:860 – 862. 6. Neri LC, Johansen HL. Water hardness and cardiovascular mortality. Ann
N Y Acad Sci. 1978;304:203–219.
7. Schroeder HA. Relation between mortality from cardiovascular disease and treated water supplies. JAMA. 1960;172:1902–1908.
8. Pocock SJ, Shaper AG, Packham RF. Studies of water quality and cardio-vascular disease in the United Kingdom. Sci Total Environ. 1981;18:25–34. 9. Rylander R, Bonevik H, Rubenowitz E. Magnesium and calcium in drinking water and cardiovascular mortality. Scand J Work Environ Health. 1991;17:91–94.
10. Rubenowitz E, Axelsson G, Rylander R. Magnesium in drinking water and death from acute myocardial infarction. Am J Epidemiol. 1996;143: 456 – 462.
11. Yang CY, Chiu JF, Chiu HF, Wang TN, Lee CH, KO YC. Relationship between water hardness and coronary mortality in Taiwan. J Toxicol
Environ Health. 1996;49:1–9.
12. Department of Health, Republic of China. Health Statistics, II: Vital
Sta-tistics. Taipei, ROC: Department of Health; 1995.
13. Westendorf J, Middleton A. Chemical aspects of the relationship between drinking water quality and long-term health effects: an overview. J Am
Water Works Assoc. 1979;79:417– 421.
14. Karppanen H. Epidemiological aspects of magnesium deficiency in cardio-vascular disease. Magnes Bull. 1986;8:2199 –2203.
15. Marier JR. Role of magnesium in the hard water story. Magnes Bull. 1986;8:184 –198.
16. Itokawa Y, Durlach J, eds. Magnesium in Health and Disease. London, England: John Libbey; 1989.
17. Yang CY, Chiu HF, Chiu JF, Cheng MF, Kao WY. Gastric cancer mortality and drinking water qualities in Taiwan. Arch Environ Contam
Toxicol. 1997;33:1–5.
18. Taiwan Water Supply Corporation, Republic of China. The Statistical Data
of Water Quality, Taiwan. Taichung, ROC: Taiwan Water Supply
Corpo-ration; 1991.
19. Bell JA, Doege TC, eds. Drinking Water and Human Health. Chicago, Ill: American Medical Association; 1984.
20. Breslow NE, Day NE. Statistical Methods in Cancer Research: The Analysis of
Case-Control Studies. Lyon, France: International Agency for Research on
Cancer; 1980.
21. Morgenstern H. Uses of ecologic analysis in epidemiological research. Am J
Public Health. 1982;72:1336 –1344.
22. Gladen B, Rogan W. Misclassification and the design of environmental studies. Am J Epidemiol. 1979;109:607– 616.
23. Polissar L. The effect of migration on comparison of disease rates in geographic studies in the United States. Am J Epidemiol. 1980;111:175–182. 24. McCarron D, Morris C, Holly J, Stanton J. Blood pressure and nutrient
intake in the United States. Science. 1984;224:1392–1398.
25. Stitt FW, Crawford M, Clayton DG, Morres JN. Clinical and biochemical indicators of cardiovascular disease among men living in hard and soft water areas. Lancet. 1973;1:122–126.
26. McCarron D, Morris C, Cole C. Dietary calcium in human hypertension.
Science. 1982;217:267–269.
27. Ackley S, Barrett-Connor E, Suarez L. Dairy products, calcium and blood pressure. Am J Clin Nutr. 1983;38:457– 461.
28. Criqui MH, Langer RD, Reed DM. Dietary alcohol, calcium, and potassium: independent and combined effects on blood pressure.
Circu-lation. 1989;80:609 – 614.
29. Lee NY, Chu YC, Chang CP, Shieh MJ, Kao MD. Dietary survey in Taiwan area, 1986 –1988. J Chin Nutr Soc. 1991;16:39 – 60.
30. Durlach J. Recommended dietary amounts of magnesium: Mg RDA.
Magnes Res. 1989;2:3:195–203.
31. Haring BS, Delft VW. Changes in the mineral composition of food as a result of cooking in hard and soft waters. Arch Environ Health. 1981;36:33–35. 32. Theophanides T, Angiboust JF, Polissiou M. Possible role of water
structure in biological magnesium systems. Magnes Res. 1990;3:5–13. 33. Reinhart RA. Clinical correlates of the molecular and cellular actions of
magnesium on the cardiovascular system. Am Heart J. 1991;121: 1513–1521.
34. Altura BM, Altura TB, Gebrewold A. Magnesium deficiency and hyper-tension: correlation between magnesium deficient diets and microcircu-latory changes in situ. Science. 1984;223:1315–1317.
35. Nadler JL, Goodson S, Rude RK. Evidence that prostacyclin mediates the vascular action of magnesium in humans. Hypertension. 1987;9:379 –383. 36. Ram Z, Sadeh M, Shacked I, Sahar A, Hadani M. Magnesium sulfates
reverses experimental delayed cerebral vasospasm after subarachnoid hem-orrhage in rats. Stroke. 1991;22:922–927.
37. Tzeng GH, Wu TY. Characteristics of urbanization levels in Taiwan districts. Geograph Res. 1986;12:287–323.