( 296 ) 'c275 =a275 b= 1.33 x 10³ M-l j門同目。 ZHLS 典人血清蛋自素及羊血清蛋白素恆溫下結合之研究 A27i-AJ35=K[A] free LC1275 K (17) [A] free = A bound [A]bound
=二EL
(18)Al??=(Aj75-A2,h)free for TRX-100 bound
A275=(AZ75 ,一 A27 nbound for TRX 一 100 where
Acknowledgement:
The author would like to express his gratitude to Prof. Wayne W. Sukow university of Wisconsin at Piver Falls, for the suggestiori of this problem and for his continuous guidance and assistance during at the department of Physics, the
the course of this work.
要 Triton X-100 和人血清蛋白素結合之史凱爾德圓形為線性,這代表各結合鍵位 是完全相同的而且相互獨立的。從實驗數據計算,結合常數為 7.2X 10³M-l ,總共有 6 個結合鍵位,因結合而產生的吉普斯自由能變化為一 5.1仟卡/摩耳。 至於Triton X-100 和羊血清蛋白素結合之史凱爾德圖形為非線性,這代表告結 合鐘位間為正的相關結合白這種正相關結合只限於 u<3 的條件下成立,一且 υ>3 , 則史凱爾德闡形亦為線性。利用電腦依廣泛階梯式平衡模式對數據作最小二次方式歸 化,可估出最前頭的四個結合常數。. 搞、
文
中( 297 )
Now, sinee Beer's law is obeyed by the 阻mple ,
A1 = a1 b[A] = II [A] A2 = a~ b[A] = l2 [A) A3 = a3 b[A] = l3 [A]
V 冉 .v ,
Aí - A
'i.
= A2+
AB2 - A1 一 τ二士~ (A~ -A(>V 3‘ V 1
V 丙 -v ,
= l2 [A] + II [A] + ~士~(l3 [A] - l dA])
V 3-Vl
師大學報,第三十三期
=[l2- l 1 一主ZHZ3-h)][A]
V 3-Vl
=
K[A]Aí - Aí' can be measured, so that if K is known, then [A] can be found.
K =
[l2 一 II 一丘之~J.~3 一 l.)l
V 3-V 1
A也 A1
干
λ3(λ1-À2)(A3A1[A] [Alλ2(À1 一λ3) [A] [A]
A
2 [Al = 一-,,-一一 申2 But A2 - A1 - f(λ) (A3-A1) l2 A2 K= then λ3(λ1一λ2) 250(300-275) f(λ)=dA-= - = 0.454 λdλ1 一λ3) 2才5 (300-250)A275 - A30 。一0.454(A250 - A300 )
~pw,choosingAl =A300 ,A2 =A275, A3 =A250
O
l275
A.;
7 5 KFor the TRITON X-l 00, a2 75 = 1.33 X 10³ M-l cm-1. In this experiment, the
(298 J 吋 MNH 吋 OZMnι 。。與人血清蛋白菜及羊血清蛋白素恆溫下結合之研究
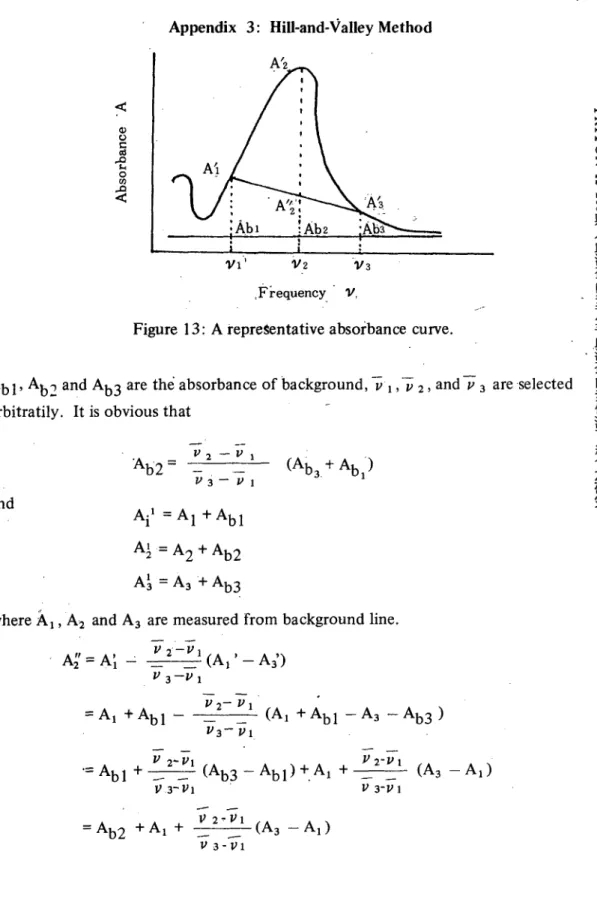
Appendix 3: Hill-and-Valley Method
〈'。 ozaAIS 的 A 〈 γ2 γl' v ,Fi-equency
Figure 13: A repreSentative absorbance curve.
Ab l' Ab2 and Ab3 are thè absorbance of background,
Vl
,五 2, and /J 3 areselectedarbitratily. It is obvious that
(Ab3+Ab1) V 句 -v ‘ Ab2=τ V 3 - V 1 and A/ = A 1 + Ab1 勻/甜可 d huhU AA ++ 勻, -3 AA --一一 1213 AA A;=Ai-22(Af-Aj) V 3-" 1
"2- "1
= A1 + Ab1
一-亡了一三一 (A1 + Ab1 - A3 - Ab3 )"3-
Vlwhere A 1, A1 and A3 are measured from background line.
九 = Ab 1
+宇宇
(A
b3
- Ab1 ) +. A1+字:今
(A
3
-Ad V3-Vl /J 3-Vl "司-V 1 = Ab2 +A1 + V 3 -V 1( 299 )
Case one: In very low free conceritration ofTRITON X-lOO. U = -PA 4t m [A]
•
0 limit P=
1 , [A]•
O limit p=
2Uz 師大學報 (13) d ( V /[A]~ = 2Uz _ U d V U1 [A]•
0 limit 第二十三期[A]
•
0
Case two: In very high free concentration ofTRITON X-IOO.
pp
=
1 +. . . . + (2n-l)Un_l Un [A] 2n:-2 + nUn2 [A] 2n一 1p函= 2Uz + . . . . + (2n2 -4n+2)U
n一
1 U n lA]2n-3 + 2n-2 n(n一 1)Un
2[A] p2=
U 1 2 + . . . + (2n2 - 2n) Un一
1 Un[A] 2n'--3 + n2U n2 [A]2n-2Because [A] is very large we just discuss the last term
V d( 一;rr) limit 一~主L [A] →∞ d V nUn Un
一
lAnother useful formula is limit V [A] (12) = U1 [A]
•
O 二八(300 ) FP2 =U 13 [AP +4U12 U2[A]4 + (5UiU22 + 5Ul 2 U3)[AjS +
八門皂、門。
ZMSHOO
典人血清蛋白素及羊血清蛋自素恆溫下結合之研究
(6U 12 U4 + 12U 1 U2 U3 + 2U23) [A] 6 +. . .
FP3 = U14 [A] 回+5U13U2 [A] 5 + (6U13 U3 + 9U12U22 )[A] 6 +. . . "
FP4 =U15[A]5 +6Ui 4U2[A]6 +... FP5 = U 16 [A] 6
= F(I~P今+FP2 _ FP3 + Fp4 _ FP5 +. . .
v
=UdA]
+
(2U2-U12)[A]2[A]2 + (3U3
-3U1U2 +U13)[AP +(4U4、-4U
1U3 -2U22 +4U12U2 -U14)[A]4 +
(5Us-- 5U4U1 - 5U3U2 + 5U1 U2 2 + 5U12 U
3
一
5U1
3U2 + U1 S)[AP+(6U6-6U5UI-6U4U2-3UJ+6U12U4+12UIU2U3+2U23 一
6U13
l.J.
3 -9U12U22 +6U 14U2 -U16)[A]6 +... (1.0) 旦旦= p = U1 + 2U2 [A] +. . . . + (n-l) Un-1 [A]n-2 + nUn[A]n-ld[A]
且三旦=話= 2U2 + 6U3 [A] +. . . . + (n-1)(n-2)
lJ.
[A] n-3 +d[A)2 n-l n(n
一
l)Un
[A] n-2 [A]P
p v ﹒昕一 -dL-f
一的
-W
DA---4 d , P , d[A] 一一(一)一一一= d[A] . p" dd
且三=
d 二七 Pp -p[A]p一[Alt
p2 pp _ p2 d[A]41:T)
一 But [A] (p已_p2) + pp,且自 由 y-nr ',』-、 BI K--h ‘ -A Ea[ 叫一 K
OE
n 方。 可 ••• a-A 一 [-K 一 v ( 301 ) (6a) 司可 ••• 』n-u
j-K 扣一+ K-1 --v ←師大學報 (6b) 一一一一一=
(n-v)K [A] or 第二十三期Appendix 2: Development of Adair Equation
心 (5)
From Adair equation
K1 [A] + 2K1 K2 [A] 2 + . . . + nK1 . . . . Kn[A] n
1 + K1 [A] + K1K2 [A]2 + .... + K1 . . . . Kn[A]n v 一一
= {U1 [A] +2U2 [A]2 +. . . . +nUn[A]n} \1+U1 [A] +U2 [AP+ . . . . + Un[A]n1-1
U1 [A] + U2 [AF + . . . . .. + Un[A]n U1[A]+2UJA12+...+nUn[Aln .K n setU1 =K 1, U2 =K1K2 ,...,Un =K1K2 v p= set F=
F[
(1-p) + p2 _p3 +p3 +p4 _p5 +. . . ] vU12[A]2 +2U1U2[A]3 +U22[A]4 +2U1U4[A]5 + 2U2U3 [A]5 +
2 P 一
U13'[Aj3 + 3U12U2 [A]4 + 3U12U3 [A]5 + 3U1 U22 [A]5 +.... . p3
=
U14[A]4 +4U13U2[Aj5 +.... .. 4_ p:-= U15[A]5 +... p5=F(I
-P)
= UdA] + (2U2 -U1 2 )[A]i
+ (3U3~3U1 U2)[Aj3 +一、工《
(4U4-4U1U3-2U22)[A]4 + (5Us-5U4U1-5U3U2)[Aj5 + (6U6 -6USU1 -6U4U2 -3U32)[AJ6 +...
( 302) 吋 HNM 吋 OZHtHOO 與人血清蛋自索及羊血清蛋白素恆溫下結合之研究﹒
For al1 sites are identica1
[PA; ]
K= 一一一一一一
K[P] [A]
2-[PAi]
=
K2 [P ][AFl.e.
Therefore. equation (21) becomes
n V2 _ n (n-1)K2 K I K 2 = c r k = 2
K
,,=~﹒
1) _. (n-2+1) K 2 2 此一 2 and (22)K:
一
(n-i+
1) K ---In general n ...1 ~. j…
(K[A])1
j=l J (n一j) ! j ! From equatinrt (22), equation (5) can be simplified as following,J (n一i+1) . . .; iπ 一一一一 [A]J j=l - i=l i. (23) n n 1+ ~一一一一一 (K[A]
)1
j=1 個一j)!j ! 一 n n (n-i+l)...; 1 + ~ π-一一一一 [A]J j=l i = 1 V ::According to the binomial theory n 可 (K[A]) J n (1 + K [A])n = 1 + ~ j=l (24)
n'
(K[A])1
(n一j) ! j ! n 1 + ~ j=l 一Differentiation with respect to K A leads to
n(1 +
K[A])
任1 ==~
,~,!.
. . (K[A])j-l j=l (n-j)!j 二五 (25) ...1 j-二一 (K[A])1
(n一j)!j!z
K[A] n (1 + K[A])n-l =( 303 )
Ashbrook, J.D., Spector, A.A., Santos, E.C., Fletcher
,
J.E. (1975); J. Biol. Chem., 250,6,2333Sukow, W.W. (174) ~h. D. Thesis
8.
Sukow, W.W.
&
Sandberg,H.E. (1974), FEBS letters, 42, 36 Sukow, W.W. & Sandberg, H.E. (1973), Bio)hys. Soc. Abs., 10Putnarr, F.W. (1948), Advance Protein Chem., ÂcademicPress, N.Y., 82 Tranford, C. (1'961), Physical Chemistry
9.
12. 10 ..
••• A ••• A 師大學報of Macromolecules, New. York,
13.
第二十三期
N.Y., Wiley, pp 526-546
Adair, G.S. (1925), J. Biol. Chem. 63-64, 529-545 Deranlean, D.A. (1969),J. Am. Chem. Soc., 91,4050
Klo缸,I.M. & Ayers, J. (1953), Di時uss.Faraday Sco., 13, 189 14.
15.
Lovrien, R. (1963), J. Awer. Chem. Soc., 85., 3677
Bartholr.1郎, P., Kirschner, K. & Gschwind, H.P. (1976), Biochemistry, 15, 16.
17.
21,4712 18.
Mcphie, P. (1971), Methods of Enzymology, Academic 'Press, New York, 22, pp 25
19.
Bauman, R.P. (1962), Absorption Spectroscopy, John Wiley & Sons Inc., New York, pp 370-403
Griffíth, J.C. (1957), Chem. and Ind. London, 1041 20.
Appendix 1: Scaichard Model
2
1.sp~ies' of PA. Then [PA']
[P] [A]
If P A' represents a particular K=
二四
K1
=
[PA]I[P]
[A]=
C~ [PA']I[P]
[A]=n K
Similarly
(21) K2 ~ C~ [PA;]
I
KdP][A]2( 3Q4) 吋 :;0 吋 O Z M 抖J.
g
典人
血 清 蛋 白 索 及 羊 血 清 蛋 白 索 恆 溫下
結 一 ê~Z
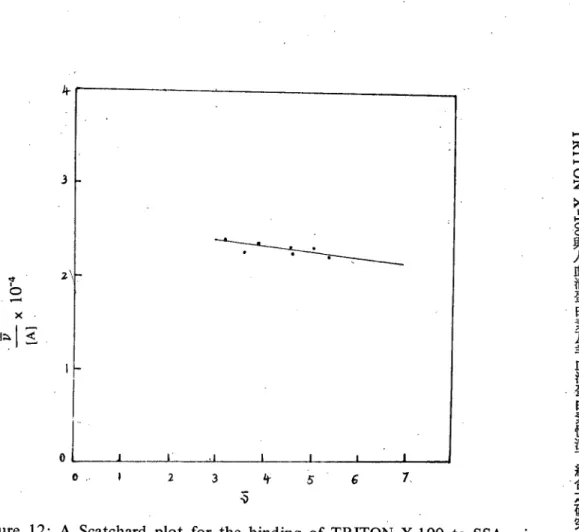
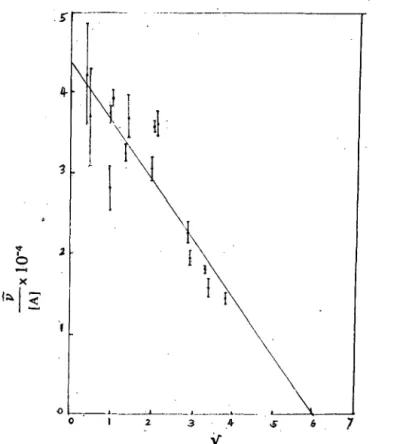
研 究 4-3 2\1 {<} 守,。 -xl 叫 7、 6 5 特 。 3Figure 12: A Scatchard plot for the binding of TRITON X-I00 to SS血 .usinga truncated data set. A1l measurements were made with pH 7.0 phosphate buffer and at 160
C. Data is truncated to 3.
REFERENCE
Dowben, R.M
&
Koehler, W. R. (1961), Arch. Biochem. Biophys" 93, 496一
一一一 一
Koehler, W.R. & Dowben, R.M. (1961), Arch. Biochem. Biophys., 93, 501 Helenius, A & Soderl♀nd , H. (1973), Biochem. Biophys. Acta, 307,287 Green, F.A. (1971), J. ColL Interf. Sci., 35, 3, 475
2.
3.
Goodman, D.S. (1958) J. Amer. Chem. Soc., 80,3892 Scatchard G. (1945), Ann. N.Y. Acad. Sci., 51,660
Zakrzewski, K. & Goch, H. (1968), Biochemistry, 7, 1835.
4.
5. 6. 7.
( 305 )
and th
e.
ethylene oxide groups X is 9-10. The cooperative binding may be due to the nonpolar interaction between the polyoxyethylene chain of TRITON X-I00 and hydrophobic side chains of protein. The theory to explain the binding of. 師 cooperativity between protein and nonionic surfactants . is not established yet.產 Perhaps
thep叫et
model is helpfùl one: In the pocket model, more than one報 ligand is bound per pocket for SSA. The cooperativity' mayarise' by interactions
塑 between
the protein and the nonionic surfactant or between the adjacentsur-主 facta叫 molecules. If one would understand well why the binding of TRITON
期 X-IOO
*
HSA system implies identica1 and independent sites whereas the TRITON X-IOO*
SSA system shows cooperative and dependent sites, he should know the tertiary structures of those two proteins. In particular, thismefins a knowledge of how the side chains are folded to form the surface of the protein. Earlier. studies suggested little evolutionary divergence, since the average molar nltio of TRITON X-I00 bound to mammalian serum albu:inins showed little variation. The current work which shows very different binding mechanisms for the same ligand on the two different serum a1bumins strongly suggests that the binding sites are different which implies ‘each of、 these serum albumins has a different topography.Conse-quently, one would deduce that. the tertiary structures of these proteins are different for these two species.
V. CONCLUSION
The Scatchard plot for the binding of TRITON X-I00 to HSA is linear. This suggests that the binding sites are‘ identical and completely independent for TRITON X-I00. The association constant i~ 7.2χ. 103 M-1, the total numberof sites is 6 and the change in Gibbs free energy for the binding is -5: 1 kcalfmole.
The Scatchard plot for the binding ofTRITON X-I00 to SSA is nonlinear and suggests a positive cooperativity binding. Evidence for the cooperativity is obtained at low extents of binding, V
<
3. If the experimental data are limited to values ofV
>
3, the Scatchard plot are linear. Using the computer least squares p'rocess tofit the data for the general stepwise equilibrium model, the first four association constants are reported.
( 306 ) 吋肉月 oZHLOO 與人血清蛋自素及羊血清蛋自素恆溫下結合之研究 舟',-也令一一~一一一一一一一 3 主 \';> z o o [A] x 104
Figure 11: A p10t of average mo~ar ratio of HSA versus free concentration of TRITON X-l 00. It does not have any inflection poim:
tion constant of those sites is 5.9 X 10² M. The concentrations of TRITON X-l 00
are below the CMC (CMC = 3.2 x 10⁻⁴ M) iÍl this experiment which limit the maximum A and doesn 't allow one to attain higher values of v to confirm the result. One cannot place much confidence 泊 this value of K because of the re. stricted range of the data.
Sukow et a1.1
0 studied the binding of TRITON X series to BSA. They found the average molar nrtio of TRITON molecule bound per BSA molecule depends on the av.erage degree of polymerization of the polyoxyethlene phain. The general structural formula of TRITON X-l 00 is
一。一 (CH2 ÇH20))( - H, CSH17 -
0
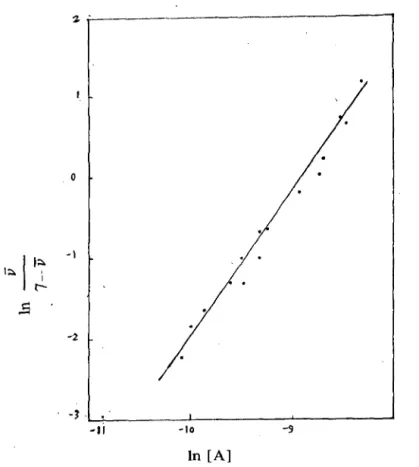
z o ( 307 ) 師大學報 第二十三期 '立 , -1 L!. -11 -10 -9 ln [A]
Figure 9:.A Hi11 plot of the data in Figure 8. The Hi1l coefficient n = 1.7.
6> I E 特 3 z 1'> 二 O [A] x 10
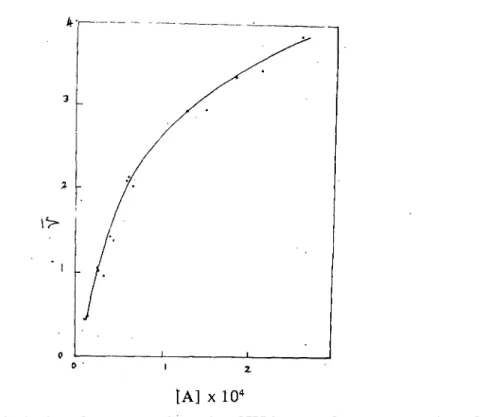
Figure 10: A plot of average molar ratio of SSA versus free concentration of 主
。
TRITON X-l 00. The curve upwardfirst, pass through the inflectionpoint and then downward.
吋 MN 阿吋 OZMIHOO 與〈血清蛋白素及羊血清蛋白索恆溫下結合之研究 ( 308 )
to equal zero. That means for the identica1 and completely independent sitecase, the 11 一 [A] curve doesn't have an inflection point. Figure 11 told us this fact for TRITON X-I00-HSA system. The
v
K2
1l
一 [A] curve of the TRITON
X-100~SSA system is upward fust and then downward, this implied the binding sites of SSA with TRITON X-l 00 are not identica1 and independenL This coincides with the meaning of the Scatchard plot and the Hi11 plot.
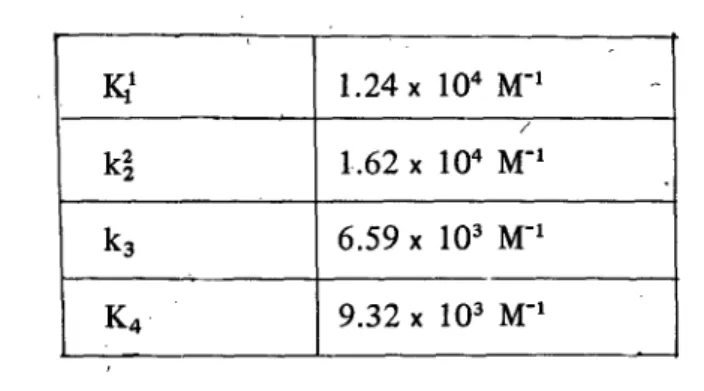
One can expand v as function of [A] . and fit the data to a polynomial using a least squ訂es fittillg process. From equations (10) and (11), it is easy to ca1culate association constants. The frrst four are reported in table 3.
Table 3: Stepwise association constants for TRITON. X-l 00 b扭d加gto SSA
Kl
1. 24 X 104 M-1 / k~ 1.62 x 10⁴ M-1 k3 6.59 X 10³ M-1 K4 9.32 X 10³ M-1一一一←-va1ues were obtained from the general stepwise equì1ibrium model. We Those
observe that K increases in going from the first to the second association constant and decreases. Comparing with the results using equations (12) and (13), K1
=
2.6 x 10M, K2
=
9.1 x 10³-1 M, which a1so support a cooperative model for the binding process. The second association constant is larger than the first one. The association constants for the binding of the TRITON X-IOO
*
SSA system a1so丸 show positive cooperativity.
informative to consider the binding of TRITON X-I00 to SSA at v
values greater than 3. A Scatchard plot forv
>
3 is shown 卸 figure 12. It is evident that this restricted range of data is fitted by the straight line which resultsIt is
5 \.. 309') 2 師大學報 嗯, 。 x
f~1 主
第二十三期~
2 3 4 VFigure 7: A Scatchard plot for the binding of TRITON X
.
100to HSA. All measurements were made with pH 7.0 phosphate buffer and at 160C. 7 O~ o T 斗 i 70
吉他
A 八 7 b OL一一_...L_______ .L.__一_1一一一-一_.1. 。 2 , 3 ;- 5'Average Molar Ratiov
Figure 8: A Scatchard plot for the binding ofTRITON X-I00
[A] :
K__: rms
.
Table 2: Binding data of TRITON X-l 00 to SSA
No. 2
3
4 5 6 7 8 9 10 11 12 13 14 15 16 v 0.333 0.692 0.971 1.15 1.50 1.54 1.90 2.34 2.45 3.22 3.61 3.94 4.58 4.65 '5.05 5.42 [A] 10-4M 0.189 . 0 .4 19 、 0.461 0.523 0.770 0.667 0.759 0.894 0.955 1.33
1.60 1.67 1.97 2.09 2.19 2.44the concen tration of free TRITON X-l 00
the root mean squares error of v j[A] .
v j[A] 104M-l 1.76 1.65 2.11
2
.19
1.95 2.31 2.50 2.62 2.57 2.41 2.262
.36
2
.32
2.23 2.30 2.22 Erms 104M-l 0.726 0.0939 0.288 0.126 0.0991 0.213 0.216 0.0185 0.128 0.0549 0.118 。 .101 0.0460 0.0753 0.0837 . 0.383 ( 310 ) 吋 :;:d h司 吋 O Z M • ..g
典人
血 清 蛋 自 素 及 羊 血 清 蛋 白 素 恆 溫下
結 合 立 研 究 七( 311 )
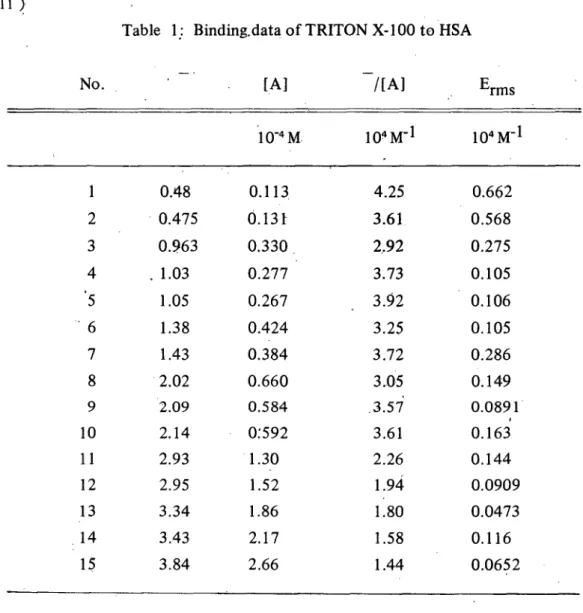
Table 1: Binding.data of TRITON X-l 00 to HSA
Erms /[A] [A] No. 104M- 1 1Q4M- 1 10-4M 師大學報 0.662 4.25 0.113 0.48 第二十三期 0.568 3.61 0.131 0.475 2 0.275 2.92 0.330 0.277 0.963 3 0.105 3.73 1.03 ATζJ 0.106 3.92 0.267 1.05 0.105 3.25 0.424 1.38 6 0.286 3.72 0.384 1.43 7 0.149 3.05 ,3.57 0.660 2.02 8 0.0891 0.163 0.584 2.09 9 3.61 0:592 2.14 10 0.144 2.26 1.94 1.80 1.30 1.52 2.93 11 0.0909 2.95 12 0.0473 1.86 3.34 13 0.116 1.58 2.17 3.43 14 0.0652 1.44 2.66 3.84 15
The concentration of free TRITON X-I00
[A]-:
the root mean squares error of 一一一一一
[A]
Erms :
-A
( 312 ) IV. RESULTS AND DISCUSSIONS
吋
MN
阿斗。
ZMnsHg
典人血清蛋,日素及羊,血清蛋白素恆溫下結合之研究
Each week 4 data points were obtained for either HSA or SSA at differeilt [A]. The total number of data points for
v
ofTRITON X~100 bound to HSA are 15 and 16 for SSA. Each data point is the average value of 4 to 5 independent measurements on identical systems. The results are shown in table 1 for HSA and table 2 for SSA. The Scatchard plot for the bindingof TRITON X-100 to. HSA at pH 7.0 and 160C is shown 姐 figure 7. It is obviously linear. This indicates that al1 sites of HSA macromolecule are identica1 and completely-independent of the occupation of other sites, for TRITON X-I00 binding. There is simply a certain concentration of available sites on the protein and ligands bind to them. Further-more, from figure 7, extrapolation as r ~ 1
•
o yields a value of 6 for the total' ‘
[A)number of these independent and identica1 sites. This result is in good agreement with the number 'of sites in the high-energy class for binding of laut;'ate to HSA 7, In addition the average association constant of these sites is 7.2 x 10³ M-l put in most reèent value. From the thermodynamics, the Gibbs free energy change is 11 GO
=-RT'lnk which give I1Go = -5.1 Kca
l/
mole for TRITO~ X-I00 binding to HSA.The Scatchard plot for the bmdmg of TRITON X-I00 to SSA at pH 7.0 and 160
C is shown in figure 8. In contrast to HSA, the Scatchard plot has a convex cuÌvature. A non-linear Scatchard plot is evidence for cooperativityl 5 . The convex
curvature in a Scatchard, plot is observed 姐 the bindin& of TRITON X-I00 to
BSA1 o. In that paper, the author cited many other experiments to support this evidence. Our resu1ts indicate thatthe binding of TRITON X-I00 to SSA also coeffi.cient for the TRITOK X-I00-SSA systems yields a val'1e of 1.7. This is further evidence for positive coopera-tivity for the TRITON X-I00 *SSA systems. The Hill plot is shown in figure 9. involves cooperativity. Evaluation of the Hi1l
五
To distinguish the different models of the binding between TRITON X-I00 to SSA, and TRITON X-I00 to HSA, observing the difference of figure 10 and
11 cari be helpful. From equation (6a), unless K2n equates zero, the second
、 BJ 司3 .va 句、 sk rf 、、
The molecular weight of serum albumin is 66300 gram/mole. Then [HSA]O.l% = 0.1gm/66300 (gm/mole) = (AJ 78 /66300xO.6)M [HSA]j 師大學報 (15) = (2.514xl0-5 M) Ar8 [HSA]j Similarly, 第二十三剪 (16) = (2.285 X 10⁻⁵ M) Ar 8 [SSA] j the Measuring the absorbance of protein solution at a wavelength of 278 nm, molar concentration of the proten can be found.
Ca1culation of the concentration [A] free and [A] bound ofTRITON
X-100 3.
If there is interference due to scattering, we generally use the Hi1l -and-Valley20 method to correct it.
The effective molar absorptivity is derived in appendix 3, and is given by k in the following equation.
(17)
(18)
[A] free =
A~r;~
/k [A]bound=Al??nd/kA2 7 5 -A3 0 0-0.454 (A2 5 O-A3 0 0)x 1.33x 10-屯,3 M-l
A275
where k =
Calculation of v
The physical meaning of V , is the average molar ratio of 1igands bound v
4.
的 calculated from the measured absorbances per HSA (or SSA) molecule.
(19)
[A] bound [HSA] using the equations,
一 [A] bound ( V ) HSA
=
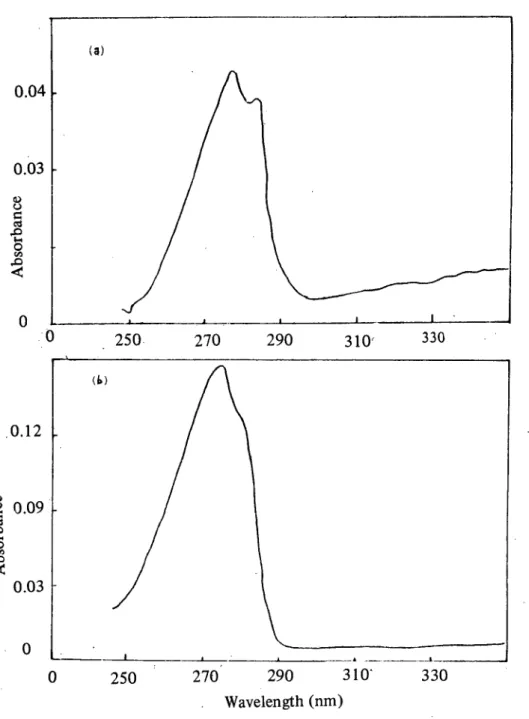
[P] total 四 (20) -一 [AJ bound ( V-) 一 V / SSA [SSA](314 ) 吋 HNH 吋 OZHtHOO 與人血清蛋白素及羊血清蛋白素恆溫下結合之研究 (司) 0.04 0.03 心。 sfgA 〈 310'
。
一一--一-一_.A..--_一一一】ι一~. 290o
250 270 330 <Þl 0.12 2009 吋 S L喝 。'"
.0 < 0.031-一 一一 一 310‘ 330。
290 Wavelength (nm) -一...l.一一--一一一一-'--250 270。
Figure 6: The absorption band of (b) bound TRITON X-l 00 (b) free TRITON X-l 00.
( 315 ) HSA Triton Reference from from 師大學報 ‘ contro1 cell cell i ~ Beam 第二十三期 Buff from
-
contro1 cell HSA from Same Samp1e-•
cell i Beam (a) Buffer Reference empty from ~ contro1 cell Beam Triton Samp1e empty from -今 cell i Beam 、-EJ hu r--、( 316 )
‘ concentration. The double-beam instrument uses the sample and 'the reference
cells simultaneously
,
subtracting the corresponding absorbances and report only吋 :;0 吋 O Z M
真
人
血 清 蛋 白 索 及 羊 血 清 蛋 白 素 恆 溫下
結 A、日 之 研 究the relative values. 官üs instrument may give more accurate comparisons since there is no time htg. Figure 5 shows the cuvette arrangement for measuring the absorbance of bound and' free TRITON X-l 00 using the double-beam method. The absorbance curves are shown in figure 6.
The analysis of calculation formula us已d in this paper: Beer's Law
(3)
The decrease in monochromatic radiant intensity dl is proportional‘to
the concentration A and thickness dx of the homogenous sample. If we take the proportional constant as k, then
dl = -k[A] 1 dx X AU Kunu r--lJ A 'K Au nU E 且 nu r--lllJ 1 = 10 Exp (-kb [A]) In (l0/1)
=
kb [A]We define the absorbance A=log (10/1) = log (I/T), where T is transmittance, then A = log (1
0/
1) = ! b [A]This equation is called Bouger-Beer law. In this equation ! is the molar absorp-(14)
tivi旬, b is the thickness of the sample which radiation pass through, and [A] is
the concentration of the sample.
Calculation of HSA (or SSA) concentration 2.
For HSA, we have known A: 7.8~ = 0.60 (SSA is 0.66)21. The
super-0.1 % equation (14) and this data, we have
Aj78= 的 [A]j =的 [HSA]j
AYS=Zb[Ali= 的 [HSA]j A?78 _ [HSA]O.l% [HSA] ;一 J A2 7 8 0.1%
( 317 )
of excess NEM requires abo11t 12 hours. Every 4 hours the buff6r solution is
changed using 2.5 1 of buffer. Then, protein
*
NEM solution is diluted with pH 7.0, phosphate buffer solution to about A2 78 = 0.66 as .shown on UV~record infigure 3. A record was taken by using the CAR Y 118 spectrophotometer. The
師大學報
concentration of buffered protein is approximately 0.1 % or 1.5 x 1 0-5 molar. Loading cells:
5.
The thæe chambered dialysis cells were fabricated from polycarbonate.
第二十三期
Initìal1y, we loaded the distal section of the cell with 5 ml of 0.1 % HSA (or SSA) in buffer, the center section with 10 ml ofbuffer TRITON X-I00 solution, and the proximal section with 5 ml of buffer solution. The three sections of the cell are separated by the membranes prepared as in process (3). Then, the cells were placed in a constant temperature bath of 160
C and tumbled at 28 rpm untíl equilibrium established. Typica11y, a dialysis time of 48 höurs was required to reach equilibrium' o. For the comparison used in the reference cell of
spectrophoto-.w
asmeter, two cohtrol cells were loaded with HSA (or SSA) in distàl section and buffer in the. other two sections. Figure 4 shows.the construction of normal cells
Buffer Solution control cell Buffer Solution TRX-IOO Solution normal cell and control cells.
Figure 4: The construction ofthe cell.
After the cells are at equi1ibrium, the molar concentration of bound TRITON X-I00 is measured. The concentration can be ca1culated direct1y from their UV absorbance at 275 nm. These measurements were made with a CARY 118 The dquble-beam method of single-component quantitative analysis was used. It is based upon the principle that as one increases the amount
Recording Data:
6.
O
spectrophotometer.
of absorbing material 曲 thebeam the fraction of the incident radiant energy that is absorbed wi1l increase in a reproducible manner. It can be proved that if the relationship is strictly exponential, the absorbance is directly proportional to the
吋 HNH 吋 OZM 叭, Hg 典人血清蛋自素及羊血清蛋白素恆溫下結合之研究 ( 318) 。風 0.61 。31 。 ωQSAEZ 〈 0、 270 且,90 310 Wavelength (nm) •
Fi郎ue2: The absorption band ofTRITON X-I00. ~30 ZQ 0
•
九 。、 。、 。OSRHHSA 〈 0.'Figure 3: The UV - Record of Sheep Seium Albumin.
3)0 2.10 2!JQ 310 Wavelength (nm) 2防 。 。
( 319 )
2. Preparation of TRITON X-l 00 solutions:
200 戶cc of TRITON X-I00 were added to 200 ml buffer solution and di1uted to desired concentrations. The CAR Y 118 spectrophotometer was used to measure its absorbance from which the concentration can be calculated. The
師一-一, 大
學 報 第
absorption band ofTRITON X-I00 is shown in figure 2. 3. Preparation of membranes:
Membranes were prepared by the method of McPhie19 to remOve 士 soluble UV absorbing substances. The process is as follows:
期 (a) Boi1 membranes in 50% H20 - C2HsOH solution gently about .1 hour, with
sti汀ing.
(b) Drain out the solution and rinse the membranes 3 times with glass disti11ed wàter.
(c) Repeat (a) (d) Repeat (b)
(e) Boil membranes in 10 mM NaHC03 solution about 1 hour, with stirring.
(f) Repeat (b) (g) Repeat (e) (h) Repeat (b)
(i) Boi1 membranes 姐 1 mM EDTA solution about 1 hour, with sitr也可
(j) Repeat (b)
(k) Boi1 membranes in glass distilled water about 1 hour, with stirring., (1) Repeat (b)
(m) Repeat (k) (n) Repeat (b)
4. Preparation of protein solution:
Dissolve 0.7 mg of N-Ethylmaleimide (NEM) in 1 ml of pH 7.0
phos-尺 phate buffer solution. Add 0.17 gm of p抖pro削.0枷叫 7m叫1 addi址iti“iona叫1 bu吋f叮f叮叭叩叫olu吋I泊t位i tωo dissolve albumin. Stir regularly every 10 minutes or less. Reaction is continued for 1.5 hours at room temperature. This blocks the sulfuydryl on the albumin. The solution of mixed protein and NEM is transferred to a dialysis bag and placed in the buffer solution with gentle stirring at 40
( 320 ) V [A] limit (12)
=
U1, 吋 HNH 吋 OZMtso 典人血清蛋白素及羊的抖清蛋白索恆溫下結合之研究 2U~ 一一二-U1U
1 [A]•
0d(一~.
-') limit '[A]' = [A]•
o
d V (13)Equations (12) and (13) tell us that the Scatchard plot can be used to estimate the frrst two association constants for the very low concentration of the low molecular weight molecule.
MATERIALS AND METHODS
Materials
The TRITON X-I00 wa.s obtained from Sigma Chemical Corporation (Lot Ill. 、•• J ••• A rs. 、
#95 L-0059) and the HSA was purchased from Miles Laboratory (Fraction V, Lot #136)
,
SSA was a1so obtained from Miles Laboratory (Fraction V,
Lot #13). These two proteins were used without further purification. In dialysis cells semi-permeable membranes were used to separate the protein solution, TRITON X-l 00 solution and buffer solution. The membranes were bought from Union Corpora-tion, Chicago, Illinois. (#3787-042, 12,000 molecular weight cut-off). All water used was disti11ed twice from deionized. water. The equilibrium dialysÎS was carried out in pH 7.0 phosphate buffer. All ultra-violet (UV) absorbance measurements were made wiht a CARY 118, UV spectrophotometer.Experimental Methods
(2)
Preparation of fresh phosphate buffer solution:
七
Stock solutions of 0.5M of KH2P04 (68.05gmjl000cc) and 0.5M of Na2HP04 (70.98 gmjl000 cc) were prepared and stored at 40C. Phosphate buffer was prepared by taking 22.4 cc of the above KH2 P04 solution mixed with 25..8 cc of Na2HP04 solution di1uted to 1 liter. This last solution has a pH value equal to 7.0. 四lepH was routinely checked with a Beckman 3500 pH meter.
( 321 )
slope n ~ 1, the sites of the macromolecule are independent, and if slope n
>
1the binding is highly cooperative
,
Suppose the macromolecule has m c1asses of binding sites and Ni. is the number of binding sites in c1ass i. According to the Scatchard model
,
one obtains(9)
Ki
[A]
1 + Ki [ A]
from the formulation.
m
F
=z
Ni師大學報
where Ki is the average association constant for that class. When applying the
,Bcatèhard model to the binding of largeorganic ligands on proteins, the assumption
made is that all of the binding sites exist initially and are completely independent. This is inconsistent with the data that the binding of certain organic ligands to
第二十三期
albumin produces conformational change in which binding sites are altered or . Therefore, any information we obtain must be derived from the Adair equation which is the general case and not constrained by any assumption.
From equation (5), v
formed 1 6 -1 7
can be expanded in powers of [A] by binomial theory
I+U1 [A] 十 U2[A]2+...
as done in appendix 2, to give a polynomial.
U1 [A] + 2U2 [A]2 +. . . . + nUn[A]n + Un [A]n
v
=
-1
. = UdA] + (2U2-U12)[A]2 + (3U3-3U2U1+U13)[AP +(4U4-4UIU3-2U~2
+4U12U2 -U14)[A]4 +(5Us-5U4Ul-5UgU2+5UIU22 +5U12U3 -5U13
(10)
whereK1 =U1,K1K2=U2,.. .. . .K1K2. .." Kn=Un
Let us write,
v
= a1 [A] + a2 [A] 2 + . . . +an [A] n-The coefficients ai's, can be obtained by a least square fitting. Then U 1, U 2,.., ,
Un can be calculated from al , a2, . . . ., ~ and consequent1y K 1 ,K2 ,.... ,Kn'
In another method used by Bartholmes et. al.悶,K 1 and k 2 can be evaluated
U2
+
U1 5) [A] 5+ . ... . .
-'-/、
( 322 )
have the same value K. As derived in appendix 1,
吋 HNH 吋 OZMSHOO 典人血清蛋白素及羊血清蛋白素恆溫下結合之研究 Ki
=
(n 一i+1) K / i .and the average molar ratio can be simplified to equation (6)
(6a)
= Kn[A] / (1 + K[A])
v
[A]
(6b)
一-v
and [A] can be measured, and plotting 二:-;versus V[A]
a graph called a Scatchard plot6• If the Scatchard plot is linear, then it .implies yields
=
(n - v ) KIn equation (6b),
that the macromolecule has only independent and identical
association constant, whlch is a measure of binding strength between macromole-cule and small molemacromole-cule, is the slope of the Scatchard plot. The total number of
binding sites. The
binding sites on macromolecule, n, is evaluated by the extrapolation of the linear plot of equation (6b) to intercepts on either the abscissa or ordinate.
In order to verify that an experimental system is adequately described by the Scatchard model, the experimental data must span the range from 0..;;; v ~n.
This extrapolation is potential1y erroneous if limited data is used to defme the Scatchard plot1
5 .
Macromolecules may have cooperative and dependent sites. Jn other words, there are the interactions of one ligand with another where the binding at any site affects the binding affinity at other sites. First1y, we consider the case that the binding of a ligand on one site of a macromolecule activates so strongly .such that
,
the other sites will be filled up immediately. Therefore,
only molecules P and PAn exist. Equation (5) becomes= nK[A]n/ (1+K[A]n) v 五
(7)
) = K[A]n ln(一主士)=
n ln [A] + ln K n- vv. /
(n-v
or (8)Plotting 扭(之一=)
versus ln[訓,
the resulting graph is called a Hill plot. If the n-V( 323 )
ratio of bound 1igand to the macromolecule and is defmed by the equation
(3)
total = [A] bound/[P]
v
It is obvious rhat [A] bound and [P] total can be expressed as following.
師大學報 [PA] + 2 [PA2 ] + . . . + n [P~] [A]bound =
(4)
[PAn] + [PA] +[P]
一 [P] total 第二十三期From equation (2), (3), and (4), wehave
1 +K1 [A] + K1 K2 [A] 2 +. . . + K1 K2 . • • • Kn[A] n
n ~ J ,; j=lj(ifl Ki)[A]J K1 [A] + 2K1 K2 [A]2 +. . . + nK1 K2 • • • Kn[A] n v -(5) 1
+豆 (L
L)[Alj j= 1 'i= 1 1equation (5) is called Adair equation14
Let us first, consider the special case where all n sites of the macromolecule are identica1 and completely independent. For this reaction, P + A 三 PA, there would then be C? different forms of PA combination. Figure 1 is a brief explana. tion of this situation.
i::|
、.. J Ku it|::l
(a)Figure 1: 4-site macromolecule P has 4 different binding forms.
四
(a) n = 4, a11 sites are empty (b) 4 forms of 1 site fi1led.
In general, there are 們 different forms of the species P ~﹒ Because each site is identica1, we can assume that the association constant for identical sites would
( 324)
Albumin complexes will begin to answer this question.
吋同阿吋
OZMntHg
與人血清蛋白索及羊血清蛋白索恆溫下結合之研究
The specific objectives of this investigatidn are:
for TRITON X-I00 binding to HSA and sheep serum albumin (SSA), at different concentrations ofTRITON X-I00.
To fit the binding isotherms to an appropriate binding model, (Scatchard To determine, v
2.
or a general stepwise equilibrium model).
To compare the binding mechanism for the two serum albumins with
3.
ofBSA. that
n.
THEORYConsider a macromolecule protein P combining reversibly with a small weight molecule, A. The number of combining sites on the macromolecule may be large. In general, it can be described by stepwise equilibrium reactions1
3 : A~PA + P A~ PA2
+
PA 、‘ EJ...
/ •. 、 A~ PA3 + PA2 A~ PAn PAn-l+are n association constants which reactions, there
For these equilibrium
describe the binding of the small molecule A to the macromolecule P. Kl :.: [PA] / ] [P] [A]
K2 = [PA21/ [PA] [A]
(2)
Kn
=
[PAn1 / [P^n
-l1 [A]where k{Sare the association constants, [P ~ 1 is the concentration of combining molecule P
^i
and [A] is the conc.entration of unbound molecule A.average
associated witheách macromolecule P. This number v
,.i
s called the average molar number of molecules A interes1:ed infinding theare we Now
at pH 7.4. The data were ana1yzed in terms of
( 325 )
fatty acids to defatted HSA
mu1tiple stepwise equilibrium. They confirmed that the magnitude of ass'Ociation
constants, K, increas as the chain length increas, but the major cooperative bindÎ)1g effects do not occur over the physiological range of fatty acid concentrations. The magnitude of the first four K's supports the view that the higher energy binding sites of HSA can not be separated 祖todistinct classes.
師大學報
The quantitative ana1ysis of binding nonionic detergents to protein was
第二十三期
studied by Sukow et a1.9-11, using members of the TRITON-X and Igepal-Lo series of nonionic surfactants which differ in their a1kyl structure. They found that the maximum number of nonionic surfactant molecules bound by BSA is pH dependent. At pH 7.0, the extremes of the average molar ratio (
v )
are 5.5 are 38 for TRITON X-165 to 6.4 for Lo-530. They also evaluated the equilibrium con-stants and thermodynamic parameters from binding isotherms for TRITON X-114, X-I00, X-I02 and X-165 a1: pH 7.0. In all cases, Scatchard plots are non-linear and suggest cooperative binding for v <2. If the experimental data are for TRITON X-114 to 2.2 for Lo-730, and at pH 2.2 the extremes ofI扭lited to values v
>
2, the Scatchard plots are linear. Equilibrium. association constant in the range of 103 to 104 M-1 were obtained by fitting the data to the stepwise equilibrium model using a leastsquares model fitting procedure.(2) STATEMENT OF PROBLEM AND OBJECfNES
Recent research9 -1 1 has shown that TRITON-X molecules may be used to probe the hydrophobic surfaces of proteins to observe small difference in the binding sites. The average mo1ar ratio
V
of TRITON X-114 molecules bound to albumins shows litt1e vàriation. This suggests that the different animal serumbinding surfaces are remarkably simil訂 in spite of the fact that there is on1y a mechanism, for small variation in am姐o acid composition 1 2. Does the binding
TRITON X-IOO molecules bound to human and another animal serum a1bumin,
also reflect minimal evolutionary change1 The evaluation of binding isotherms,
( 329 )
TRITON
X-I00
BINDING TO HUMAN
SHEEPSERUM ALBUMIN
AND
Determ ination of the binding isotherms.
by
CHING-SONG SHERN
Taiwan normal umversIty
1. INTRODUCfION
(1) BACKGROUND
Scientjsts generally use surfactants to separate proteins from the macromo-lecular aggregate. There are three types of surfactants: anionic, cationic and nonionic. The charged surfactants bound to protein have been studied for a long time. Prior to 1948, it was generally believed that nonionic surfactants did not bind to proteins. However, more recent studies indicated that membrane - bourtd proteins as well as a globular protein do bind nonionic detergent moleculesl-3 • Dowben and Koehler1 noted an 油crease in the specific viscosity of bovine serum
albumin (BSA) in presence of TRITON X-IOO but the specific optical rotation did not change. Green4
considered the interaction of nonionic surfactants with BSA. He obsenred a shift 扭 the
“
transition point,"
which is defmed as the critical micelle concen tration (CMC) when no protein is present; in the presence of protein, this“
transition point" shifts, and he equated the shift to the amount of surfactant bound.Goodman5 analyzed the binding of pa1mitic acid to hutnan serum a1bumin (HSA) by graphical approximation in terms of a 2
,
5,
20 Scatchard mode16• From
the spectrophotometric studies of laurate binding to HSA 7 it was found that HSA
has two classes of high-energy binding sites: a primary class of two sites, and a secondary c1ass of five sites. Ashbrook8 considered the binding of six long chain
吋 þd ... 4 O Z M ~