Abstract—Optical coherence tomography (OCT) is analogous to ultrasound imaging except that it uses infrared light instead of sound. Polarization-sensitive optical coherence tomography (PS-OCT) combines the advantages of OCT and provides additional image contrast of the tested sample. We demonstrate this technique for imaging of back-reflected light, birefringence, and fast-axis orientation simultaneously in different kinds of atherosclerosis plaque. This in vitro study suggests birefringence changes in plaque are due to the prominent deposition of collagen or cholesterol by correlating PS-OCT images with histology. Thus the combination of high resolution structural imaging and birefringence detection make PS-OCT a potentially powerful tool for early assessment of atherosclerosis appearance and prediction of plaque rupture.
Keywords—Atherosclerosis, polarization-sensitive optical coherence tomography, birefringence
I. INTRODUCTION
Atherosclerosis is unquestionably the leading cause of morbidity and mortality in developed countries, and the world-wide importance of acute vascular syndromes is increasing. Rupture of atherosclerotic plaque has been identified as the proximate event in the majority of cases of acute ischemic syndromes. Autopsy studies have identified several histological characteristics of these vulnerable plaques including a large lipid pool, a thin fibrous cap (<65 µm), and activated macrophages near the fibrous cap [1]. Therefore, modalities capable of characterizing the atherosclerotic lesion may be helpful in understanding its natural history and detecting lesions with high risk for acute events.
Intravascular optical coherence tomography (OCT) is a recently developed optical imaging technique that provides high-resolution (10 µm to 20 µm) cross-sectional images of tissue in situ, up to 10 times higher than conventional ultrasound, magnetic resonance imaging, or computed tomography [2,3]. The axial resolution of OCT is capable of resolving small structural details such as the width of intimal caps and the presence of fissures of atherosclerotic plaques [4]. In additionally, the objective OCT image criteria for atherosclerotic plaque characterization has been established based on the intrinsic optical properties of typical plaque
constituents in lipid, calcium and fibrous tissue [2-4]. Even so, many of the failures of the OCT image criteria to accurately determine plaque type may have been caused by plaque heterogeneity [2].
Unlike OCT performs imaging only by measuring the echo time delay and intensity of backscattered light, polarization-sensitive OCT (PS-OCT) uses the information carried by the polarization state to extract extra information from the sample under study [5]. Two well known mechanisms that dominate the changes in the polarization state of light propagating through biological tissue including scattering and birefringence. Scattering changes polarization randomly thus induces depolarization of incident polarized light whereas birefringence changes the polarization state in a predictable manner, described by the Jones or Mueller matrix of a linear retarder [6].
Many biological tissues, such as tendons, muscle, nerve, bone, cartilage and teeth, exhibit form or intrinsic birefringence. Moreover, changes in birefringence may indicate changes in functionality, structure, or viability of tissues. In 1997, the first two-dimensional images of birefringence in bovine tendon were presented, and the effect of laser-induced thermal damage on the birefringence of collagen was demonstrated [7]. Recently, PS-OCT has been applied to research of ophthalmology [8] and osteoarthritis [9].
Here we present the first application, to our knowledge, of PS-OCT in human atherosclerosis. The goals of this study were: 1) to examine whether PS-OCT is an acceptable tool for the characterization of typical plaque constituents; and 2) to explain the correlation between birefringence and forming or rupture of a plaque; and 3) to establish a quantitative PS-OCT image criteria for atherosclerotic plaque characterization in vitro.
II. METHODOLOGY
The PS-OCT system used in this study has been described previously [10,11]. A Michelson interferometer with two quarter wave plates (QWP) is used in this setup. A 837 nm superluminescent diode, which had a bandwidth of 17.5 nm, corresponding to an axial resolution of 17 µm was used as the experiment light source. The transverse
Imaging of Human Aortic Atherosclerotic plaques by Polarization-Sensitive
Optical Coherence Tomography
W. C. Kuo
1, J. J. Shyu
2, N. K. Chou
3, C. M. Lai
4, H. C. Huang
5, C. Chou
5, G. J. Jan
1,61 Department of Electrical Engineering, National Taiwan University, Taipei, Taiwan 2Department of Veterinary Medicine, National Taiwan University, Taipei, Taiwan
3Department of Surgery, National Taiwan University Hospital, Taipei, Taiwan 4Department of Electronic Engineering, Ming-Chuan University, Taoyuan, Taiwan 5Institute of Radiological Sciences, National Yang-Ming University, Taipei, Taiwan 6Graduate Institute of Electro-Optical Engineering, National Taiwan University, Taipei, Taiwan
0-7803-8439-3/04/$20.00©2004 IEEE 1222
Proceedings of the 26th Annual International Conference of the IEEE EMBS San Francisco, CA, USA • September 1-5, 2004
resolution, determined by the spot size of the sample beam, is 15 µm. After reflection at the sample and propagating back through QWP, the light in the sample arm becomes an elliptical polarization state containing information on the birefringence and fast axis orientation of the sample. From AC coupling of the detector signal, the full interferometric signal is recorded. An algorithm [11] is used to determine the three parameters (reflectivity, phase retardation, and fast axis angle) based on the amplitude and the phase of the interference signal at any depth.
Precision registration of PS-OCT and histology was achieved by applying ink marks to the aortic wall at the peripheral areas of imaged section, such that each PS-OCT image and corresponding histological section contained visually recognizable reference points.
After imaging, the segments of aortic wall were fixed in 10% formalin for longer than 24 hours. Arteries were then processed for standard paraffin embedding. Sections with 4µm in thickness were cut at the marked imaging sites and stained with hematoxylin and eosin (H&E) and Masson’s trichrome. Histology was used as the gold standard to validate PS-OCT results.
III. RESULTS
Fig. 1(a) is the reflection image of an arterial wall (the same as OCT image) in PS-OCT. Fig. 1(b) is its corresponding histology. It demonstrates the intima (with intimal hyperplasia) containing four small, superficial lipid-laden macrophages in the human aorta where arrowheads identify corresponding areas between the PS-OCT images and histology. Fig. 1(c) is its phase retardation image in PS-OCT. There is an abruptly change of birefringence that possibly comes from the distribution of cholesterol in lipid [12]. Fig. 1 (d) is the fast axis angle image in PS-OCT. The variation of color in the image means fast axis angle is in the manner of random orientation.
Fig. 2 shows a fibrocalcific aortic plaque of PS-OCT images and corresponding histology. The roughness surface comes from the back scattered light signal can be observed from Fig.2 (a). However, there are several dots of phase retardation change and fast axis angle change can be seen in Fig. 2(c) and Fig. 2(d).
A typical advanced atherosclerotic lesion in Fig. 3 is characterized by a core of extracellular lipid with an overlaying fibrous collagen-rich cap. Fig. 3(a) shows a relatively deep lipid-laden (L) aortic atherosclerotic plaque that penetrates near the media. The media layer has a low backscattering intensity, so the interface between it and the plaque is not well defined. The sample is stained by Masson’s trichrome as shown in Fig. 3(b) where collagen tissue stains blue. Therefore, by correlating Fig. 3(c) and Fig. 3(d) with histology image, then a gradual change of phase retardation and fast axis angle observed in plaque are due to the prominent accumulation of collagen.
Fig. 1. PS-OCT and histology images of a plaque containing small amounts of lipid (arrowheads) (a) intensity image (b) histology (H&E; magnification x40) (c) phase retardation (degree) (d) fast axis angle (degree)
Fig. 2. PS-OCT and histology images of a fibrocalcific aortic plaque. (a) intensity image (b) histology (Masson’s trichrome x40) (c) Phase
retardation (degree) (d) fast axis angle (degree)
Fig. 3. A relatively deep lipid-laden fibroatheroma. (a) intensity image (b) histology (Masson’s trichrome ; magnification x40) (c) phase retardation
(degree) (d) fast axis angle (degree)
IV. DISCUSSION
From the results in this measurement, PS-OCT image not only provides conventional reflection image (the same as OCT) but also is more sensitive to lipid droplet which contains cholesterol or more sensitive to increased collagen tissue. Although cholesterol and collagen both induce the change of polarization of incident laser beam, Fig. 1(c) is
100µm (b) (c) (d) (a) 100µm L L (a) (b) (c) (d) L L 100µm (b) (a) (c) (d) 1223
very different from Fig. 3(c) because the change of polarization state comes from different reasons. One of reasons belongs to intrinsic birefringence of which is resulted from molecules of different optical retardance in an ordered configuration, such as cholesterol molecules [13]. The other one is form birefringence, results from ordered linear structures surrounded by a ground substance with a different refractive index [5], such as proliferated collagen fiber in Fig. 3. In the meantime, the change of orientation of fast axis angle in Fig. 1(d) is more randomly than in Fig. 3(d).
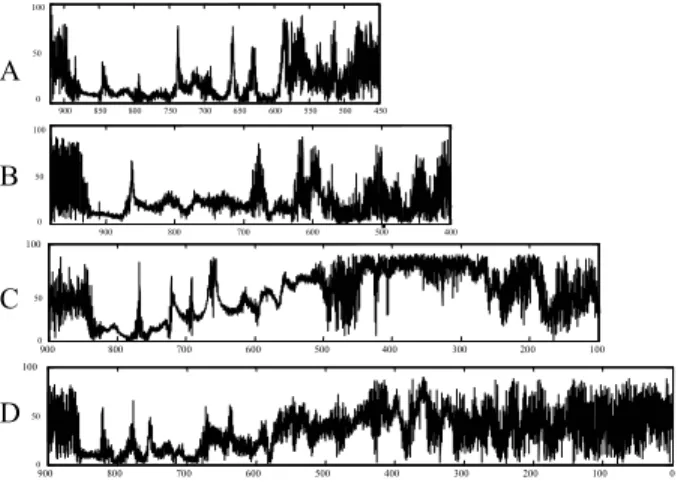
Because the collagen constitutes up to 60% of the total plaque protein, uncontrolled collagen accumulation leads to arterial stenosis, whereas excessive collagen breakdown weakens plaques thereby making them prone to rupture finally [14]. Thus, we can acquire quantitative criteria based on the change of polarization of incident beam to estimate whether the collagen synthesized is “too much” or “not enough” by this method. Fig. 4 shows the phase retardation parameter versus depth in different lateral positions A, B, C, and D of a lipid rich fibroatheroma. A quantitative criterion can be setup from the tendency of each lateral position (see Fig. 4) where the amount of collagen follows C > D > B > A.
V. CONCLUSION
The PS-OCT image is sensitive and specific for characterizing different types of atherosclerotic plaques. These results present that the combination of three parameter: backreflected intensity, phase retardation, and orientation of fast axis angle, is better than conventional OCT which only use one parameter. Moreover, quantitative PS-OCT image criteria can be established. Thus the combination of high resolution structural imaging and birefringence detection make PS-OCT a potentially powerful tool for early assessment of atherosclerosis appearance and prediction of plaque rupture.
Fig. 4. Plot of phase retardation (degree) versus depth (µm)
ACKNOWLEDGMENT
W. C. Kuo thanks a scholarship from the Silicon Integrated Systems (SIS) Corporation, HsinChu, Taiwan.
REFERENCES
[1] E. Falk, P. K. Shah, V. Fuster, “Coronary plaque disruption,” Circulation, vol. 92, pp. 657–671, 1995.
[2] H. Yabushita, B. E. Bouma, S. L. Houser, H. T. Aretz, I. K. Jang, K. H. Schlendorf et al., “Characterization of human atherosclerosis by optical coherence tomography,” Circulation, vol. 106, pp. 1640–1645, 2002.
[3] I. K. Jang, B. E. Bouma, D. H. Kang, S. J. Park, S. W. Park, K. B. Seung et al., “Visualization of coronary atherosclerotic plaques in patients using optical coherence tomography: comparison with intravascular ultrasound,” J. Am. Coll. Cardiol., vol. 39, pp. 604– 609, 2002.
[4] M. E. Brezinski, G. J. Tearney, B. E. Bouma, J. A. Izatt, M. R. Hee, E. A. Swanson et al., “Optical coherence tomography for optical biopsy: properties and demonstration of vascular pathology,” Circulation, vol. 93, pp. 1206–1213, 1996.
[5] J. F. de Bore, S. M. Srinivas, B. H. Park, T. H. Pham, Z. Chen, T. E. Milner, and J. S. Nelson, “Polarization effects in optical coherence tomography of various biological tissues,” IEEE J. Selected Topics Quant. Electro., vol. 5, no. 4, pp. 1200–1204, 1999.
[6] J. F. de Bore, S. M. Srinivas, A. Malekafzali, Z Chen, and J. S. Nelson, “Imaging thermally damaged tissue by polarization sensitive optical coherence tomography,” Opt. Express , vol. 3, no. 6, pp. 212-218, 1998.
[7] J. F. de Boer, T. E. Milner, M. J. C. van Gemert, J. S. Nelson, “Two-dimensional birefringence imaging in biological tissue by polarization-sensitive optical coherence tomography,” Opt. Lett., vol. 22, pp. 934-936, 1997.
[8] B. Cense, T. C. Chen, B. H. Park, M. C. Pierce, J. F. de Bore, “In vivo birefringence and thickness measurements of the human retinal nerve fiber layer using polarization-sensitive optical coherence tomography,” J. Biomed. Opt., Vol.9, no.1, pp. 121-125, 2004.
[9] W. Drexler, D. Stamper, C. Jesser, X. Li, C. Pitris, K Saunders et
al., “Correlation of Collagen Organization with Polarization
Sensitive Imaging of in Vitro Cartilage: Implications for Osteoarthritis,” J. Rheumatology, vol. 28, no. 6, pp. 1311-1318, 2001.
[10] K. Schoenenberger, B. W. Colston, D. J. Maitland, L. B. Da Silva, M. J. Everett, ”Mapping of birefringence and thermal damage in tissue by use of polarization-sensitive optical coherence tomography,” Appl. Opt., vol.37, no. 25, pp.6026-6036,1998.
[11] C. K. Hitzenberger, E. Gotzinger, M. Sticker, M. Pircher and A. F. Fercher, “Measurement and imaging of birefringence and optic axis orientation by phase resolved polarization sensitive optical coherence tomography,“ Opt. Exp., vol. 13, pp. 780-790,2001.
[12] W. Jaross, V. Neumeister, P. Lattke, D. Schuh, “Determination of cholesterol in atherosclerotic plaues using near infrared diffuse reflection spectroscopy,” Atherosclerosis, vol. 147, pp. 327-337, 1999.
[13] A. Yariv, P. Yeh, Optical Waves in Crystals. Wiley, New York, 1984, pp. 72-74.
[14] M. D. Rekhter, “Collagen synthesis in atherosclerosis: too much and not enough,” Cardiovascular Research, vol. 41, pp. 376-384, 1999 A B C D 450 500 550 600 650 700 750 800 850 900 0 50 100 400 500 600 700 800 900 0 50 100 100 200 300 400 500 600 700 800 900 100 0 100 200 300 400 500 600 700 800 900 100 50 50 0 0 1224