Infrared brazing of Ti
50
Ni
50
shape memory alloy using two
Ag–Cu–Ti active braze alloys
R.H. Shiue, S.K. Wu *
Department of Materials Science and Engineering, National Taiwan University, Taipei 106, Taiwan, ROC Received 30 June 2005; accepted 24 October 2005
Available online 4 January 2006
Abstract
Microstructural evolution, shape memory effect and shear strength of infrared brazed Ti50Ni50shape memory alloy using Cusil-ABAwand Ticusilw
active braze alloys are investigated. The Ag–Cu eutectic braze alloy can readily wet Ti50Ni50substrate by minor titanium additions. The brazed Ti50Ni50/Cusil-ABAw/Ti50Ni50 joint is mainly comprised of Cu-rich, Ag-rich and CuNiTi phases. On the other hand, the brazed Ti50Ni50/Ticusilw/Ti50Ni50joint consists of Ag-rich, Cu-rich and TiCu2phases. Because the chemical composition of Ticusil braze alloy is located inside the huge miscibility gap, the molten braze tends to be separated into two liquids during brazing. One is rich in Ag, and the other is rich in both Cu and Ti. The Ag-rich liquid does not react with Ti50Ni50substrate. In contrast, the copper content is depleted from the matrix of brazed joint due to the formation of interfacial TiCu2phase. The TiCu2phase is less detrimental to the shape memory effect than CuNiTi phase during the shape recovery bending test. Shear strength of brazed joints exceeds 200 MPa for both braze alloys if the brazing time exceeds 180 s. However, thick interfacial CuNiTi and TiCu2layers can deteriorate the shear strength.
q2005 Elsevier Ltd. All rights reserved.
Keywords: A. Intermetallics, miscellaneous; B. Bonding; C. Joining; D. Microstructure; B. Phase diagrams
1. Introduction
Equiatomic Ti50Ni50 shape memory alloy (SMA) is well
known for its superior shape memory effect and pseudo-elasticity [1,2]. In addition, its high corrosion resistance and biocompatibility make Ti50Ni50 SMA an excellent candidate
for medical safety and robotics applications[3–5].
To join Ti50Ni50 SMA successfully without detrimental
to the characteristic of shape memory effect can extend its application. Different from the welding process, the base metal is essentially not melted during the brazing process. It is possible to braze Ti50Ni50 SMA without melting the
base metal in order to keep its shape memory effect. Compared with the traditional furnace brazing, infrared brazing is suitable in studying the mechanism and microstructural evolution of the joint with the advantage of its rapid heating rate as high as 3000 8C/min. Thus, infrared brazing has been applied to investigate the kinetics of brazing process in recent years [6,7].
The selection of filler metal plays a crucial role in brazing Ti50Ni50 SMA. The wettability of the braze alloy, the
mechanical properties of the brazed joint and the formation of intermetallic phases at the joint must all be considered in the selection of the filler metal. It is reported that the existence of Ti(Cu,Ni) phase, instead of CuNiTi phase, in the brazed joint is beneficial to preserve the shape memory effect of the infrared brazed Ti50Ni50 SMA with copper thin foil [8]. The
commercial Ag–Cu eutectic braze alloy (BAg-8) is well known for its use in joining copper alloys, stainless steels and nickel-base alloys. Although the solubility of silver is almost zero in Ti50Ni50alloy[9], the solubility of copper in Ti50Ni50
alloy is rather higher[10]. It is also reported that the wettability of Ag–Cu eutectic braze can be significantly improved with the addition of 1–5 wt% titanium [11,12]. Accordingly, it is possible to infrared brazing Ti50Ni50 alloy using the
silver-based braze alloy with the addition of minor amount of titanium.
In this study, infrared joining of Ti50Ni50SMA using two
silver-based braze alloys by adding different amount of titanium is studied. The wettability, microstructural evolution, shear strength and shape memory effect of infrared brazed joints are comprehensively evaluated in order to unveil the relationship between the microstructure and the performance of the brazed joints.
www.elsevier.com/locate/intermet
0966-9795/$ - see front matter q 2005 Elsevier Ltd. All rights reserved. doi:10.1016/j.intermet.2005.10.012
* Corresponding author. Tel.: C886 2 2363 7846; fax: C886 2 2363 4562. E-mail address: [email protected] (S.K. Wu).
2. Experimental procedure
Ti50Ni50 SMA was prepared by vacuum arc remelting
(VAR) of titanium rods (purity: 99.7 wt%) and nickel pellets (purity: 99.9 wt%). Both titanium rods and nickel pellets were cleaned by 1HF–15HNO3K64H2O (in ml) and saturated
NaOH solution prior to performing VAR. Both Cusil-ABAw
and Ticusilw
foils purchased from Wesgow
Metals were used in brazing. The thickness of braze alloys was 50 mm throughout the experiment. Chemical compositions, and solidus and liquidus temperatures of braze alloys are listed inTable 1.
The infrared furnace used in this study was ULVAC SINKO-RIKO RHL-P610C with the maximum heating rate of about 3000 8C/min. Infrared brazing was performed under 5! 10K5mbar vacuum, and the heating rate was set at 900 8C/min throughout the experiment. All specimens were preheated at 600 8C for 60 s to equilibrate the actual temperature in the specimen. The process variables used in this study are listed in
Table 2.
The size of brazed specimens was 10.0!10.0!2.5 mm3. All joined surfaces were polished by SiC papers to grit 600 and ultrasonic cleaned by acetone before infrared brazing. The area of the filler metal foil was approximately the same as that of the base metal. The graphite fixture was used in this study to enhance the absorption of infrared rays during infrared brazing.
Specimens were sandwiched between two graphite plates, and an R-type thermocouple in the upper graphite plate was contacted with the brazed specimen[8].
The schematic diagram of graphite fixture used for the shear test is shown inFig. 1, in which two black bold lines between Ti50Ni50 base metals are the braze alloys with the width of
approximately 1.5 mm. Shear tests of infrared brazed joints were performed using a Shimadzu AG-10 universal testing machine. The infrared brazed specimen was compressed with a constant speed of 1 mm/min. The Philips PW1710 X-ray diffractometer (XRD) with Cu Ka X-ray source was used to
analyze the structure of fracture surface after the shear test. The cross-section of the brazed joint was examined using a Philips XL-30 scanning electron microscope (SEM) equipped with an energy dispersive spectrometer (EDS). Quantitative chemical analyses were performed using a JEOL JXA 8600SX electron probe microanalyzer (EPMA) equipped with a wavelength dispersive spectrometer (WDS) with a spot size of 1 mm and an operational voltage of 20 kV.
The shape memory effect was evaluated by bending test as shown inFig. 2. The shape recovery ratio of the infrared brazed joint was obtained in the bending test[13]. The dimensions of the samples used for bending test was machined into 60.0! 5.0 mm2and 0.5 mm in thickness. The specimen was initially bent to qi in liquid nitrogen (77 K). Next, the specimen’s
temperature was increased to 130 8C in order to measure the shape recovery angle (qf). The shape recovery ratio of the joint
was defined by (qiKqf)/qito evaluate its shape memory effect.
Additionally, the shape recovery ratio of Ti50Ni50 base metal
with the same specimen size was also tested for the purpose of comparison.
Table 1
Solidus and liquidus temperatures of braze alloys Braze alloy Cusil-ABAw
Ticusilw
Solidus (8C) 780 830
Liquidus (8C) 815 850
Composition (wt%) 63Ag–35.25Cu–1.75Ti 68.8Ag–26.7Cu–4.5Ti
Fig. 1. The schematic diagram of shear test specimen with graphite fixture. Table 2
Summary of process variables used in the experiment Temperature
(8C)
Brazing time (s) Cusil-ABAw
braze alloy Ticusilw braze alloy 840 15 M – 840 60 M/S – 840 90 M – 840 180 M/S – 840 300 M/B/S – 870 15 M M 870 60 M/S M/S 870 90 M M 870 180 M/S M/S 870 300 M/S/W M/S/B/W 900 15 M M 900 60 M/S M/S 900 90 M M 900 180 M/S M/S 900 300 M/S/W M/S/W 930 15 – M 930 60 – M/S 930 90 – M 930 180 – M/S 930 300 – M/S/W
M, metallurgical observation specimen; S, shear test specimen; B, bending test specimen; W, wetting angle test specimen.
θi θf Ti50Ni50 Brazed Joint 60mm 5mm
Fig. 2. The schematic diagram of bending test specimen to measure the shape recovery ratio[8].
3. Results and discussion
3.1. Wetting angle of filler alloys with Ti50Ni50substrate
Dynamic wetting angles were measured in the sessile drop test using approximately 0.12 g BAg-8, Ticusilw and
Cusil-ABAwfiller alloys with near spherical shape on the Ti 50Ni50
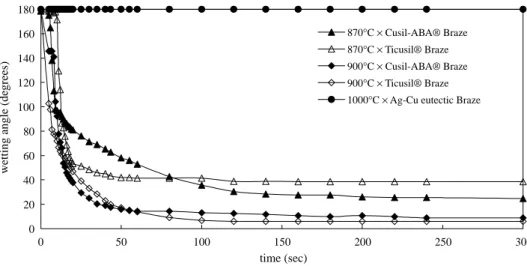
substrate. They were heated up to a specified temperature and held for 0–300 s. Fig. 3 shows the dynamic wetting angle measurements of Ag–Cu eutectic (BAg-8), Cusil-ABAw
and Ticusilw braze alloys on Ti
50Ni50 substrate at various
temperatures for 0–300 s. As depicted in Fig. 3, the Ag–Cu eutectic braze alloy is completely dewetted from the TiNi substrate, however, both Ticusilw and Cusil-ABAw alloys
demonstrate great improvement in wetting the TiNi substrate. Thus, Ti50Ni50can be effectively wetted by Ag–Cu braze alloy
with minor titanium addition. Upon increasing the test temperature from 870 to 900 8C, the wetting angles of both Ticusilw and Cusil-ABAw braze alloys decrease. This
characteristic will be further discussed in the following microstructural observation of the brazed joints.
3.2. Microstructural evolution of Ti50Ni50/Cusil-ABA w
/ Ti50Ni50infrared brazed joint
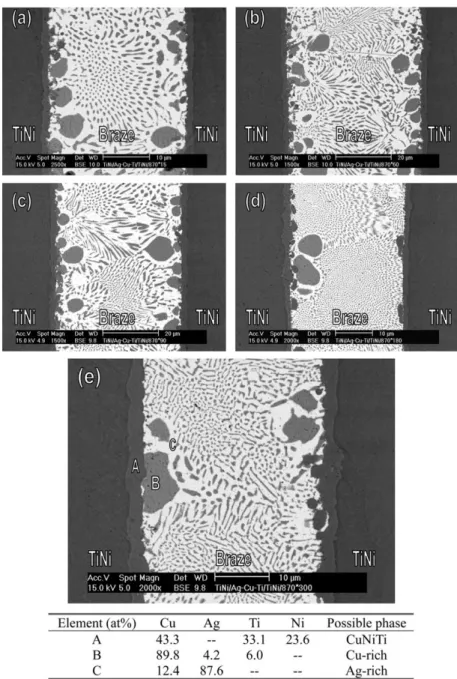
Fig. 4(a)–(e) shows the SEM backscattered electron images (BEIs) of Ti50Ni50/Cusil-ABAw/Ti50Ni50 specimen infrared
brazed at 870 8C for 15, 60, 90, 180 and 300 s, respectively. Most of the brazed region is with eutectic Ag–Cu which primarily consists of Ag-rich and Cu-rich phases. The SEM observations revealed that silver does not react with the substrate and the white Ag-rich matrix is not in contact with the substrate during infrared brazing. There is an interfacial reaction layer in between braze alloy and substrate. According toFig. 4, widths of the brazements are less than the original thickness of the Cusil-ABAw
foil (50 mm) due to the overflow of the molten braze out of the joint during infrared brazing.
Fig. 4also shows the EPMA results ofFig. 4(e). InFig. 4(e), there is one continuous reaction layer formed close to Ti50Ni50
substrate, as marked by A. The chemical composition of layer A consists of copper, titanium and nickel. According to the isothermal section of ternary Cu–Ni–Ti phase diagram as illustrated inFig. 5, the stoichiometry of layer A is close to the CuNiTi phase[14]. The CuNiTi phase can also be expressed as (CuxNi1Kx)2Ti where x ranges from 0.23 to 0.75[14]. Areas B
and C inFig. 4(e) are the copper-rich phase and the Ag-rich matrix, respectively. The binary phase diagrams of Ag–Cu and Cu–Ti show the highest solubility of silver and titanium in the copper is 5 and 8 at.%, respectively[15]. It is consistent with the current EPMA result of the copper-rich phase (Area B) alloyed with 4.2 at.% Ag and 6.0 at.% Ti. According to the experimental observation, higher brazing temperature, e.g. 900 8C, can accelerate the formation of a thicker CuNiTi reaction layer.
3.3. Microstructural evolution of Ti50Ni50/Ticusilw/Ti50Ni50
infrared brazed joint
Both the solidus and liquidus temperatures of Ticusilwalloy
are higher than those of Cusil-ABAw. Accordingly, higher
brazing temperatures are performed in brazing Ti50Ni50
substrate using Ticusilw
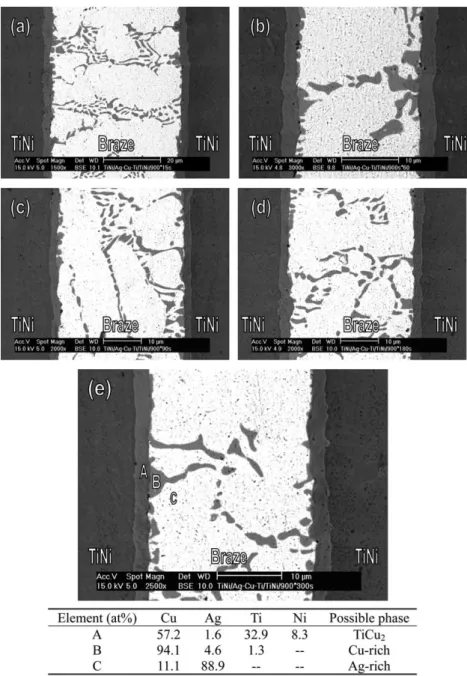
filler alloy. Fig. 6(a)–(e) shows the SEM BEIs of Ti50Ni50/Ticusilw/Ti50Ni50 specimen infrared
brazed at 900 8C for 15, 60, 90, 180 and 300 s, respectively. The EPMA results for the specimen in Fig. 6(e) are also included inFig. 6. The braze joint consists of Ag-rich and Cu-rich phases, and the silver does not react with the Ti50Ni50
substrate. It is obvious that the distribution of Cu-rich phase using Ticusilw braze alloy is different from that using
Cusil-ABAw braze alloy. The Cu-rich phase is consumed rapidly
even at the initial stage of brazing. It indicates that more vigorous reaction occurs in the Ticusilwbrazed joint than in the
Cusil-ABAw
one.
There is a continuous interfacial layer close to Ti50Ni50
substrate, as marked by A inFig. 6(e). According to the EPMA results, layer A can be identified as TiCu2. It is reported that the
Ni atoms can be replaced by Cu atoms in Ti33Ni67KxCuxand its
structure can vary from MoSi2structure of CuNiTi phase to
0 20 40 60 80 100 120 140 160 180 0 50 100 150 200 250 300 time (sec)
wetting angle (de
grees)
870°C × Cusil-ABA® Braze 870°C × Ticusil® Braze 900°C × Cusil-ABA® Braze 900°C × Ticusil® Braze 1000°C × Ag-Cu eutectic Braze
VAu2structure of TiCu2phase when the x in at.% is higher
than z55, as shown in Fig. 7 [16,17]. Although the binary TiCu2is a high temperature phase and does not exist at room
temperature, it is possible that the TiCu2 phase can be
stabilized in a ternary system in which an additional third element is alloyed[16].
3.4. Reaction path of infrared brazed Ti50Ni50alloy
The measurement of dynamic wetting angle demonstrates that the wettability of Ag–Cu eutectic braze on Ti50Ni50
substrate can be effectively improved by titanium addition. According to the liquidus projection of Ag–Cu–Ti ternary phase diagram shown inFig. 8, there is a large miscibility gap in the Ag–Cu–Ti phase diagram[14]. It may play an important role in explaining the mechanism of active brazing.
There are at least three major metallurgical phenomena during infrared brazing, including: melting of the braze alloy, dissolution of the substrate(s) and solidification of the molten braze [7]. All above metallurgical phenomena involve solid– liquid transformation. Additionally, the interfacial reaction between the braze alloy and Ti50Ni50substrate is also involved
during the infrared brazing. Therefore, both Ag–Cu–Ti and Cu–Ni–Ti ternary alloy phase diagrams are cited in the study. The chemical composition of the Cusil-ABA braze in atomic percent is 49.7% Ag, 47.2% Cu and 3.1% Ti as marked by point A in Fig. 8. Since the liquidus temperature of the Cusil-ABA alloy is 815 8C, it can form a homogeneous liquid at brazing temperatures between 840 and 900 8C. The molten braze alloy is readily reacted with Ti50Ni50substrate, and forms
interfacial TiCuNi phase as demonstrated in Fig. 4. The presence of interfacial CuNiTi results in isolation of molten
Fig. 4. SEM BEIs and EPMA chemical analysis results of Ti50Ni50/Cusil -ABA w
/Ti50Ni50specimens infrared brazed at 870 8C for (a) 15, (b) 60, (c) 90, (d) 180 and
braze during infrared brazing due to its rapid thermal cycle. If the cooling path of the molten braze follows the liquidus projection of Ag–Cu–Ti phase diagram, point A in Fig. 8
moves towards to U6and U7. The reaction scheme of U6and U7
are listed below[14,]:
U6: L C Cu3Ti2ðHTÞ4 ðAgÞ C Cu4Ti ð808 8CÞ (1)
U7: L C Cu4Ti4 ðAgÞ C ðCuÞ ð783 8CÞ (2)
Therefore, the microstructure of the brazed joint is mainly comprised of Ag-rich and Cu-rich phases. This is consistent with the experimental observations.
The chemical composition of the Ticusil braze alloy in atomic percent is 55.3% Ag, 36.5% Cu and 8.2% Ti as marked by point B in Fig. 8. Compared with the Cusil-ABA braze alloy, the amount of Cu is decreased and Ti is increased for the Ticusil alloy. It is also important to note that the chemical composition of Ticusil braze alloy is located inside the huge miscibility gap. Consequently, it is expected that the molten braze tends to be separated into two liquids during brazing. One is rich in Ag, and the other liquid is rich in both Cu and Ti
[14,18]. According to Fig. 8, the chemical composition of Ticusil (marked by B) is close to the reaction shown below[14]:
L100CCuTi4 L200CCu4Ti3 ð900 8CÞ (3)
The L200liquid is rich in Ag, and the L001 liquid is rich in Cu and Ti. Based on the Cu–Ti binary alloy phase diagram, a series of invariant reactions upon cooling of the Cu–Ti rich
liquid are listed below[15]:
CuTi C L4 Cu4Ti3 ðPeritectic; 925G10 8CÞ (4)
Cu4Ti3CL4 Cu2Ti ðPeritectic; 890G10 8CÞ (5)
L4 Cu2Ti C bCu4Ti ðEutectic; 875G10 8CÞ (6)
If the solidification of the Cu–Ti rich liquid follows Eqs. (4)–(6), the formation of interfacial Cu2Ti phase is caused by
peritectic and eutectic reactions as shown in Eqs. (5) and (6), respectively. On the other hand, solidification of the Ag-rich liquid follows Eq. (2), and both Cu-rich and Ag-rich matrix are observed in the experiment (Fig. 6).
Mercier and Melton [10] suggested that the copper solubility in Ti50Ni50is as high as 25 at.% at 155 8C. However,
the Ag-rich liquid has little effect on the reaction with TiNi substrate. According to the experimental observation, the Cu– Ti rich liquid preferentially reacts with Ti50Ni50 substrate to
form interfacial TiCu2or CuNiTi intermetallics.
For the Cusil-ABAwinfrared brazed joint, the Cu-rich phase
reacts with Ti50Ni50 substrate to form a CuNiTi interfacial
layer close to the substrate. This is consistent with Cu–Ni–Ti ternary phase diagram (Fig. 5), because CuNiTi phase shares the phase boundaries with copper and Ti50Ni50simultaneously.
For the Ticusilw
infrared brazed joint, the copper content is depleted from the matrix of brazed joint, as illustrated by EMPA analysis results in Fig. 6 due to the formation of interfacial TiCu2phase, instead of CuNiTi phase. Accordingly,
the copper content in the joint is significantly decreased after infrared brazing.
3.5. Shape recovery and shear tests of infrared brazed Ti50Ni50alloy
Table 3summarizes the bending test results for the shape recovery ratio of Ti50Ni50infrared brazed at 840 and 870 8C,
for 300 s. The shape recovery ratio of Ti50Ni50 base metal is
greater than 99%. FromTable 3, the shape recovery ratio of infrared brazed joint using Ticusilwfiller alloy is much higher
than that using Cusil-ABAw. As mentioned earlier, the major
difference in the microstructure of infrared brazed joints is the interfacial layer formed near to the Ti50Ni50 substrate. The
CuNiTi is observed in the case of Cusil-ABAw
brazed joint and TiCu2 is in Ticusilw. Yang et al. [8] indicated that the
formation of CuNiTi phase in brazing is detrimental to the shape memory effect of Ti50Ni50 substrate. Obviously,
Fig. 6. SEM BEIs and EPMA chemical analysis results of Ti50Ni50/Ticusil w
/Ti50Ni50specimens infrared brazed at 900 8C for (a) 15, (b) 60, (c) 90, (d) 180 and (e)
300 s.
the interfacial TiCu2 layer has less damage to the shape
memory effect of brazed Ti50Ni50alloy.
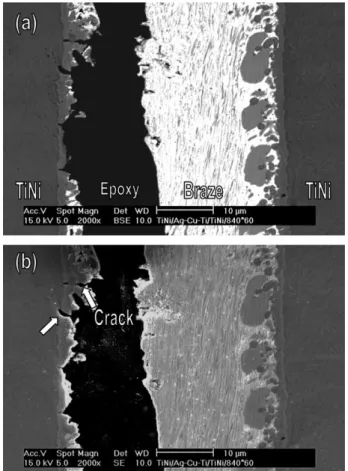
The cross-section of the bending test specimen was cut and mounted in an epoxy and then examined by SEM.Fig. 9shows the SEM images and EPMA results of the specimen infrared brazed at 840 8C and 300 s with Cusil-ABAwbraze alloy. The
cracks can be observed clearly in the interfacial CuNiTi layer, as indicated by the arrows inFig. 9(b).
Table 4 shows the shear strengths of specimens brazed at different conditions. The shear strength is 251 MPa for the Cusil-ABAwinfrared brazed specimen at 870 8C for 180 s and
is 242 MPa for the Tucusilw infrared brazed specimen at
900 8C for 180 s. The brazed joints have their shear strengths higher than 200 MPa if the brazing time exceeds 180 s at 870 and 900 8C, and the variation of shear strength is not obvious due to the absence of significant difference in the microstruc-tures of these infrared brazed joints.
The fractured specimens after shear tests were cross-sectioned and examined by SEM. Cracks can be observed clearly within the brittle interfacial CuNiTi layer for
Cusil-Fig. 8. The liquidus projection of Ag–Cu–Ti ternary phase diagram[14].
Fig. 9. Cross-section of bending test specimens and EPMA chemical analysis results of Ti50Ni50/Cusil-ABA
w
/Ti50Ni50infrared brazed at 840 8C for 300 s:
(a) BSE and (b) SE image. Table 3
Shape recovery ratios of Ti50Ni50base metal and infrared brazed joints using
Cusil-ABAw
and Ticusilw
filler metals
Specimen Shape recovery ratio
((qiKqf)/qi) (%)
50 mm Cusil-ABAw
foil at 840 8C for 300 s 64 50 mm Ticusilw
foil at 870 8C for 300 s 92
ABAwbrazed joint, as illustrated inFig. 10.Fig. 11shows the
SEM fractograph and EPMA results of two infrared brazed joints. For the Cusil-ABA brazed joint, the Ag-rich phase shows the dimple dominated appearance, as indicated by Area A in Fig. 11(a). Many cracks in Fig. 11(a) indicated by the arrows are initiated from the brittle CuNiTi phase (Area B) next to the Ag-rich matrix. Similarly, the dimple dominated fracture of the Ag-rich matrix (Area C) and the cleavage fracture of the TiCu2phase (Area D) are widely observed in
Fig. 11(b) for the Ticusilw brazed joint. Accordingly, the
presence of interfacial layer in between braze alloy and base metal is detrimental to the bonding strength of the infrared brazed joint.
Fig. 12shows the XRD results of the fractured surface for Ti50Ni50/Ticusilw/Ti50Ni50specimen after shear test. It is clear
that strong characteristic peaks of silver and Ti50Ni50substrate
are widely observed in the fractured surface. The copper phase is not observed clearly in the fractured surface resulting from the vigorous reaction in braze. The existence of interfacial
TiCu2 phase is confirmed by XRD analysis, as illustrated in
Fig. 12, which is in accordance with the aforementioned experimental results.
4. Conclusions
Microstructural evolution, interfacial reaction, shape recov-ery and shear strength of infrared brazed Ti50Ni50 shape
memory alloy using Cusil-ABAw
and Ticusilw
active braze
Table 4
Shear strengths of joints infrared brazed at various conditions
Brazing time (s) 60 180 300 50 mm Cusil-ABAw foil, 840 8C (MPa) 213 243 173 50 mm Cusil-ABAw foil, 870 8C (MPa) 130 251 225 50 mm Ticusilw foil, 870 8C (MPa) 199 218 214 50 mm Ticusilw foil, 900 8C (MPa) 152 242 208
Fig. 10. Cross-section of shear test specimens ofw
Ti50Ni50/Cusil-ABA w
/Ti
50-Ni50infrared brazed at 840 8C for 60 s: (a) BSE and (b) SE image.
Fig. 11. The fractograph of shear test specimen and EPMA chemical analysis results of infrared brazed (a) Ti50Ni50/Cusil-ABAw/Ti50Ni50at 870 8C for 180 s
and (b) Ti50Ni50/Ticusilw/Ti50Ni50at 900 8C for 300 s.
Fig. 12. XRD analysis of the fractured surface after shear test for the Ti50Ni50/Ticusil
w
alloys are studied. The following conclusions are drawn based on the experimental results.
1. Based on the results of wetting angle measurement, poor wettability of Ag–Cu eutectic braze on Ti50Ni50substrate
can be significantly improved by minor addition of titanium into the braze alloy.
2. The infrared brazed Ti50Ni50/Cusil-ABAw/Ti50Ni50joint is
mainly comprised of Ag-rich, Cu-rich and CuNiTi phases. In contrast, the infrared brazed joint using Ticusilw braze
alloy consists of Ag-rich, Cu-rich and TiCu2 phases.
Because the chemical composition of Ticusil braze alloy is located inside the huge miscibility gap, the molten braze tends to be separated into two liquids during infrared brazing. One is rich in Ag, and the other is rich in both Cu and Ti. The Ag-rich liquid does not react with Ti50Ni50
substrate. In contrast, the copper content is depleted from the matrix of brazed joint due to the formation of interfacial TiCu2phase.
3. Based on the results of bending test for the shape recovery ratio, the interfacial TiCu2layer in Ti50Ni50/Ticusilw/Ti
50-Ni50joint is less detrimental to the shape memory behavior
than the interfacial CuNiTi layer in Ti50Ni50
/Cusil-ABAw/Ti
50Ni50joint.
4. There is no significant difference in shear strength between these two braze alloys. Both shear strengths are higher than 200 MPa for infrared brazing time exceeding 180 s at 870 and 900 8C. The highest shear strength obtained for
Cusil-ABAw
braze alloy is 251 MPa at 870 8C for 180 s. Both CuNiTi and TiCu2interfacial layers are detrimental to the
bonding strength of brazed Ti50Ni50joint.
Acknowledgements
The authors gratefully acknowledge the financial support from National Science Council (NSC), Republic of China, under the grant number NSC 93-2216-E-002-008.
References
[1] Miyazaki S, Otsuka K, Suzuki Y. Scripta Metall 1981;15:287–92. [2] Otsuka K, Shimizu K. Int Met Rev 1986;31:93–114.
[3] Rocher P, El Medawar L, Hornez JC, Traisnel M, Breme J, Hildebrand HF. Scripta Mater 2004;50:255–60.
[4] Filip P, Lausmaa J, Musialek J, Mazanec K. Biomaterials 2001;22: 2131–8.
[5] Lin HC, Wu SK. Acta Metall Mater 1994;42:1623–30. [6] Shiue RK, Wu SK, Chen SY. Acta Mater 2003;51:1991–2004. [7] Shiue RK, Wu SK, Chan CH. J Alloy Comp 2004;372:148–57. [8] Yang TY, Shiue RK, Wu SK. Intermetallics 2004;12:1285–92. [9] Wu SK, Wayman CM. Unpublished work, University of Illinois at
Urbana-Champaign; 1984.
[10] Mercier O, Melton KN. Metall Trans 1979;10A:387–9. [11] Li R, Pan W, Chen J, Lian J. Mater Sci Eng A 2002;A335:21–5. [12] Paulasto M, van FJJ, Kivilahti JK. J Alloy Comp 1995;220:136–41. [13] Lin HC, Wu SK. Scripta Metall Mater 1992;26:59–62.
[14] Villars P, Prince A, Okamoto J. Handbook of ternary alloys phase diagrams. Metals Park: ASM International; 1995.
[15] Massalski TB. Binary alloy phase diagrams. Metals Park: ASM International; 1990.
[16] Pfeifer HU, Bhan S, Schubert K. J Less Common Metals 1968;14: 291–302.
[17] van FJJ, Bastin GF, Leenen AJH. J Less Common Metals 1978;57: 111–21.
[18] Chuang HW, Liaw DW, Du YC, Shiue RK. Mater Sci Eng A 2005;390: 350–61.
![Fig. 2. The schematic diagram of bending test specimen to measure the shape recovery ratio [8].](https://thumb-ap.123doks.com/thumbv2/9libinfo/8819336.231647/2.892.481.824.901.1076/schematic-diagram-bending-specimen-measure-shape-recovery-ratio.webp)
![Fig. 5. The isothermal sections of Cu–Ni–Ti at 870 8C in atomic percent [14].](https://thumb-ap.123doks.com/thumbv2/9libinfo/8819336.231647/5.892.170.736.104.580/fig-isothermal-sections-cu-ni-ti-atomic-percent.webp)
![Fig. 8. The liquidus projection of Ag–Cu–Ti ternary phase diagram [14].](https://thumb-ap.123doks.com/thumbv2/9libinfo/8819336.231647/7.892.467.812.600.1063/fig-liquidus-projection-ag-cu-ternary-phase-diagram.webp)