A Comparison of MICU Survival Prediction Using
the Logistic Regression Model and Artificial
Neural Network Model
Shu-Ping Lin · Chi-Hsueh Lee* · Yang-Shu Lu** · Ling-Nu Hsu***
ABSTRACT: Under the policy of restraint in medical expenditure and with the dual pressures of medical technology development and population aging, the critical care services will exert even greater pressure on the limited medical resources. Therefore, the objective of this study is to compare the abilities of two models, the Logistic Regression Model and the Neural Network Model, to predict the survival of critical care patients, in order to provide a more ethical and objective survival prediction system, as well as to promote more effective management of the resources of the medical intensive care unit (MICU). The two models use the Acute Physiology and Chronic Health Evaluation-II (APACHE-II) and Glasgow Coma Scale (GCS) scores of 1,496 patients stayed who in the MICU of a Taiwan medical center during January 2002-January 2004 to conduct the survival prediction. The study results show that the Neural Network Model has a better predictive ability than the Logistic Regression Model both with regard to the survivors (86.7%, n = 361) and with regard to the entire population of patients studied (74.7%, n = 498).
Key Words: survival rate, medical intensive care unit (MICU), Artificial Neural Network Model, Logistic Regression Model.
Introduction
Continually rising medical expenditures are a prob-lem for most countries all over the world. They try to con-trol the upward trend in medical expenses and to fully and effectively employ medical resources. Recently, develop-ments in medical technology and the sharp increase in the aged population have caused the demand for the intensive care unit (ICU) treatment to grow continuously, further adding to the difficulties of the medical expense control. According to Sznajder et al. (2001), ICU wards accounted for 10% of total US hospital beds, but their expenditures represented 34% of the total. The average expenditure was US$14,130 daily, or about US$6.4 billion yearly, which was over 1% of the American Gross Domestic Product (GDP). Additionally, patients over age 65 were about 38% of patients in American ICUs but accounted for 50% of the
total expenditures of the ICUs. Nowadays, Taiwan’s Na-tional Health Insurance scheme is under the dual pressures of the policy of restraint on medical expenditure and an aging population with 9.48% aged over 65 in 2004 (De-partment of Health, Executive Yuan, 2005b). It can be ex-pected that critical care services will cause huge and grow-ing pressure on limited medical resources and that ICUs will be unable to meet the demand.
According to statistics issued by Department of He-alth, the number of ICU beds increased from 1,744 to 6,955 between 1989 and 2004 (Department of Health, Executive Yuan, 2004, 2005a). The growth rate was 298.8% in 16 years. Tong (1998) mentioned that patients in the ICU must receive strict monitoring and care because most of them have life threatening and severe illnesses. Therefore, the most expensive and advanced medical facilities, and spe-cially trained medical personnel are highly needed. This
PhD, Associate Professor, Department of Technology Management, Chung Hua University; *MS, Adjunct Instructor, Department of Health Services Management, China Medical University, and Doctoral Candidate, Graduate Institute of Technology Management, Chung Hua University; **BS, Graduate Student, Graduate Institute of Technology Management, Chung Hua University; ***RN, MS, Director, Department of Nursing, China Medical University Hospital, and Adjunct Instructor, Department of Nursing, China Medical University.
Received: April 3, 2006 Revised: August 15, 2006 Accepted: September 5, 2006
Address correspondence to: Chi-Hsueh Lee, No. 91, Hsueh-Shih Rd., Taichung 40402, Taiwan, ROC. Tel: 886(4)2205-3366 ext. 5136; Fax: 886(4)2205-1276; E-mail: [email protected]
increases the expenditures of the ICU and accounts for about 20% of the total medical expenditures. Therefore, giving proper attention to both medical service quality and the allocation of limited medical resources, how to estab-lish an objective prediction system to assist ICU clinical care to be more effectively operated is an important issue.
For medical personnel, patients and their families, the most important thing is to increase the patient’s likelihood of survival. Therefore, if patients can know the situations that they are going to face as soon as possible, it may help related personnel to make effective and proper decisions. It will help them to make psychological adjustments and pre-paration. On the other hand, for the medical institutions, they can better organize the deployment of beds and make more effective utilization of the limited ICU beds. For the medical personnel, they can make early arrangements for assignments and medical support, and offer patients careful and proper care. Early prediction helps medical personnel to make arrangements and treatment plans, and to take the initiative in treatments. In addition, at present, when every medical organization faces an unfair global budget alloca-tion, as well as conflicts and disputes in the health insur-ance itemized payment schedule, it is very important to establish an objective predictive system to effectively as-sist the allocation of limited medical resources to ICUs and to offer a better medical service.
In the clinic, the medical personnel take survival as an indicator of successful treatment. It is especially important for critical patients because if patients know their condition earlier, then they may take the treatment enthusiastically to prevent their condition from worsening, reducing unneces-sary medical care, shortening the length of stay and saving medical costs and resources. Thus, early prediction has great importance and significance for ICU patients. This study conducts an empirical result comparison by data analysis method. Data came from the measurement of pa-tients’ degree of severity of illness and the mortality rate in a medical intensive care unit (MICU) by two widely used measuring tools, Acute Physiology and Chronic Health Evaluation-II (APACHE-II) and Glasgow Coma Scale (GSC), presently used in MICUs in Taiwan. In addition, the research refers to Goss and Ramchandani (1998), who used patients in an adult ICU in the USA, and compare the effectiveness of the Binary Logit Regression Model and Neural Networks Model to establish a simple, trustworthy, objective, and appropriate survival predictive model for patients in Taiwanese MICUs. The result of the comparison
will assist medical personnel in providing relevant sug-gestions and making appropriate medical decisions, and to allocate limited medical resources in promoting effec-tiveness.
Literature Review
In the past, the methods adopted in predictive research on survival in the ICU were mainly of two kinds: one was the Logistic Regression Model using parametric method and the other was the Artificial Neural Network Model using nonparametric method. Therefore, the purpose of this study is to utilize the APACHE-II and GCS commonly used in the Taiwanese MICU to further compare the accuracy of pre-dicted patient survival between the two models, the Logistic Regression Model and Artificial Neural Network Model.
Logistic Regression Model
The Logistic Regression Model mainly uses Dichoto-mous Dependent Variables, such as “survival” or “death”. The nature of Logistic Regression is similar to traditional regression analysis, but Logistic Regression is used to deal with problems of categorical data. Because categorical data is discrete, we must transfer the data to a continuous data pattern with data between 0 and 1, and then conduct regression using the transferred continuous data. The pur-pose is to look for the relationship between response vari-ables and a series of explained varivari-ables in the categorical pattern. Therefore, the greatest difference between Logis-tic Regression and generalized regression analysis is the varying response variables. The utilization of Logistic Regression needs to meet with the generalized hypothesis of traditional regression analysis. That avoids the collinear problem among the explained variables, allowing for sta-tistic basis hypotheses of residuals and auto-correlation and in accordance with normal distribution. Thus, Logistic Regression can only establish a linear model but cannot explain the relationship among independent variables.
Artificial Neural Network Model
An Artificial Neural Network is a kind of information processing system imitating the biological nerve network. The precise definition is: “An Artificial Neural Network is a calculation system, including software and hardware. It utilizes a large number of simple connected artificial neu-rons to imitate the capabilities of a biological nerve net-work. An artificial neuron is a simple simulation of a bio-logical neuron. It obtains data from the outside
environ-ment or other artificial neurons, performs a very simple calculation, and outputs the outcome to the outside envi-ronment or other artificial neurons.” (Chiu, 2002).
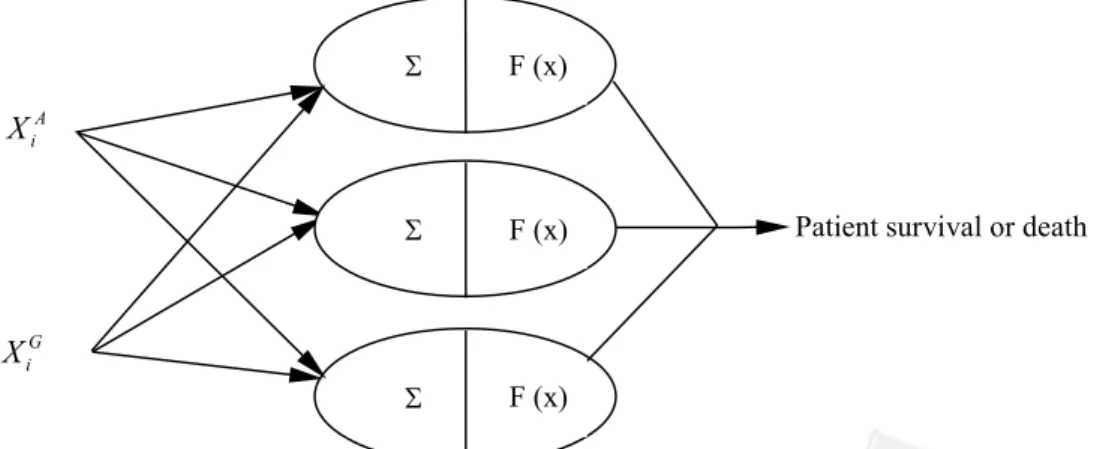
The structure of the Artificial Neural Network con-tains three layers: the input layer, the output layer and the hidden layer; each layer is formed by nodes (neurons) and links. The links of each layer represent the weight of in-formation transmission, and the weight value responds to the degree of influence between the neurons of different layers. The nodes of the input layer are the predicted vari-ables; the nodes of output layer are the outcome variables. Of the various Artificial Neural Network Models, the Back-Propagation Network (BPN) is the simplest and easi-est to understand. Therefore, it is the most commonly used model at present. Its structure is shown below in Figure 1.
When using the Artificial Neural Network Model it is not necessary to hypothesize the data input and output rela-tionship, and the model has the advantages of establishing non-linear models, expressing correlations between input variables and accepting logical, numerical and categorical variables as inputs, a high degree of accuracy, and strong adaptability. Therefore, the Artificial Neural Network Mo-del has been wiMo-dely used in many fields in recent years. Recently, Goss and Ramchandani (1998), and Wong and Young (1999) used the Artificial Neural Network Model to predict the ICU patient’s survival.
Comparison of Logistic Regression Model and
Artificial Neural Network Model
Both the Logistic Regression Model and Artificial Neural Network Model establish models by data and have adjustable parameters, such as the regressive coefficient of the Logistic Regression Model and the network-connected
weighting value and threshold value of the Artificial Neu-ral Network Model.
The differences between the alternative Logistic Re-gression Model and the Artificial Neural Network Model are that the Logistic Regression Model is a linear model but the Artificial Neural Network Model is both linear and non-linear; the Logistic Regression Model cannot show the correlation among input variables, but the Artificial Neural Network Model can; the numbers of adjusted variables in the Logistic Regression Model are fixed, but the numbers are variable in the Artificial Neural Network Model and often more than in the Logistic Regression Model; the regressive coefficient of the Logistic Regression Model has a unique solution, but the network-connected weight-ing value and threshold value of the Artificial Neural Net-work Model have non-unique solutions and it is also hard to prove which answer is the best solution.
Methods
Material Description
This study utilizes 1,496 admissions of an MICU at a Medical Center in Taiwan during 1 January, 2002 to 31 January, 2004. Six nurses trained in APACHE-II and GCS appraisal in skills were responsible for collecting patients’ APACHE-II scores, GCS scores, sex, survival or not, and age in the first 24 hours after admission to the ICU. Table 1 and Table 2 show detailed data of patient characteristics. The age distribution is from 14 to 104 and the average is 66.5. At 24 hours after admission, the measured average APACHE-II score was 15.8 (the standard deviation, SD was 9.36) with an average GCS score of 11.1 (the SD was 4.51). After ICU treatment, there were 72.79% survivals
A i
X
G iX
Patient survival or death
S F (x)
S F (x)
S F (x)
and 27.21% deaths. The average APACHE-II score of the 1,089 survivors was 13.9 (the SD was 7.99) and the average GCS score was 11.9 (the SD was 4.04). In the 407 deaths, the average APACHE-II score was 21.0 (the SD was 10.7) with an average GCS score of 8.87 (the SD was 4.93). We found that the deaths had a higher APACHE-II score and a lower GCS score. In this study, male patients accounted for 57.89% of the sample and female patients for 42.11%.
Instruments
Logistic Regression Model
As the Logical Regression Model is a parametric sta-tistical method, it needs to hypothesize a predictive vari-able with a specific rule. Therefore, firstly, the study hy-pothesizes that the survival rate of the ithpatient is given by
pi= P(Yi= 1½X Xi A
i G
, ), where Yi = 1 represents the ith
patient’s survival, Yi= 0 is the ithpatient’s death, Xi A
means the APACHE-II value measured when the ithpatient in the first 24 hours after admission to the ICU, and Xi
G is the GCS value measured when the ithpatient in the first 24 hours after admission to the ICU. The survival rate accord-ing to the Logical Regression Model is given by
...(1)
We calculate the equation (1) by the maximum likeli-hood method to geta, b1andb2, then get the optimal GFI index value and the survival rate accuracy, t0= $nl/n, by APACHE-II and GCS, where $nl stands for the number of correctly predicted patient survivals and deaths and n is the total patients.
The survival rate accuracy in (1) is explained by APACHE-II and GCS from collected data, and not predic-tive survival rate accuracy. We can get the predicpredic-tive sur-vival rate accuracy by Cross Verification, as follows. Group all patients in two groups randomly. The first group com-prising 2/3 of the patients is called the predictive sample, and the second one comprising 1/3 of the patient is called the test sample. Then, we calculate the predictive model of (1) using the predictive sample, and then introduce the test sample into (1) to get the predictive accuracy, t1= $ / ,3nlt n
where $nlt is the number of correctly predicted patient sur-vivals and deaths in the test sample and n is the total pa-tients.
Artificial Neural Network Model
The analysis steps of the Artificial Neural Network in the study were as follows.
Step 1. Set the training sample as the analyzed data; Xi A
(APACHE-II) and Xi G
(GCS) are the input layer; and the patient survival rate is the output layer. Table 1.
Characteristics of Patients and Outcomes
Total patients (n = 1,496) Survival (n = 1,089, 72.79%) Death (n = 407, 27.21%)
Items M SD Range M SD Range M SD Range
Age 66.5 16.170 14-104 66.8 16.440 14-104 65.8 15.43 0019-093 LOS 07.5 8.02 00-114 07.9 8.56 00-051 6.32 09.01 0000-114 APACHE-II 15.8 9.36 00-059 13.9 7.99 00-041 21.0 10.70 0000-059 GCS 11.1 4.51 03-015 11.9 4.04 03-015 8.87 04.93 0003-015
Note. LOS = Length of Stay; APACHE-II = Acute Physiology and Chronic Health Evaluation-II; GCS = Glasgow Coma Scale.
Table 2.
Gender and Characteristics of Patients
Male (n = 866, 57.89%) Female (n = 630, 42.11%)
Items M SD Range M SD Range
Age 66.50 15.820 19-104 66.4 16.650 14-104 LOS 07.44 8.24 00-114 07.6 7.71 00-051 APACHE-II 16.05 9.24 00-059 15.5 9.53 00-059 GCS 11.06 4.52 03-015 11.1 4.51 03-015
Note. LOS = length of stay; APACHE-II = Acute Physiology and Chronic Health Evaluation-II; GCS = Glasgow Coma Scale.
1 2 ln 1 A G i i i i p X X p = +a b +b
-Step 2. Place (xi A
, xi G
) on the input layer and calculate the weight value from the input layer to the hidden layer, zj x v x v in i A j i G j = 1 + 2 , where j = 1, 2, …, p, p is
the number of nodes in the hidden layer, and vijis
the linked weight from the input layer to the hidden layer. Convert zj x v x v in i A j i G j = 1 + 2 by Sigmoid
fun-ction (2), where the range is between 0 and 1.
...(2)
Then, we calculate the weight value, yin z w
j j j p = =
å
1transmitted from the hidden layer to the output layer, with the hidden layer value zj f zj
in
= ( ) , where wjkis
the linked weight from the hidden layer to the output layer, and the output layer value is y = f (yin). Step 3. Compute the deviation of the weight adjustment
from the hidden layer to the output layer, i.e.Dwj
=adizj, to do the back-propagation, wheredi= (ti
- yi) f¢( yi in
) anda is the learning rate; then, calcu-late the deviation of the weight adjustment from the input layer to the hidden layer, i.e.Dvj jxi
A 1 = ad * and Dv j jxi G 2 = ad * , where dj dj in j in f z = ' ( ) and dj d in k jk k m w =
å
1. The purpose is to minimize the error of the estimated value yiand the true value tiin the
back-propagation. Hence we set the error function as El yi ti i n = -=
å
1 2 2 1 2 3[ ] , where l represents the train-ing time, if El- El+1£ e, where e means the
de-signed minimum with training completed. Other-wise, the weight of each layer needs to be adjusted till El- El+1£ e. Finally, modify the weight from the
hidden layer to the output layer with wjk(new) = wjk
(old) +Dwjkand the weight from the hidden layer to
the input layer with vij(new) = vij(old) +Dvij.
Step 4. Introduce the test sample into the training sample model shown above and calculate the predictive accuracy as t2 = $ / , where $nnnt3nnnt n is the number
of correctly predicted patient survivals and deaths in the test sample, and n is the total patients. Based on the above, the ICU patient survival rate is estimated using both the Logistic Regression Model and the Artificial Neural Network Model. According to the sta-tistical data, the survival rate is 0.72; therefore, we set this as the cutoff value of the survival rate. That is, if the esti-mated survival rate in both models is greater than 0.72, then we predict the patient’s survival; otherwise we predict death.
Results and Discussion
Based on the previously established Logistic Regres-sion Model and the Back-Propagation Neural Network Model, this study analyzes on the predictive outcome of patient survival rate in the MICU and compares the effec-tiveness of prediction by the two models, as detailed below.
Logistic Regression Model
The collected data from 1,496 patients were intro-duced into the Logistic Regression Model. The results are detailed in Table 3.
The significant survival rate by the Logistic Regres-sion Model can be determined because G2= 1570.73 in this model and APACHE-II (c2= 46.86, p = .00), GCS (c2
= 10.95, p = .001) and the constant (c2
= 19.80, p = .00) of each independent variable coefficient all have a significant level. We can obtain a Logistic Regression Model, ln( p p i i 1- ) = 1.452- 0.063Xi A + 0.059Xi G , with a signifi-cant survival rate by Table 3. Hence the higher the assessed degree of severity of illness, the lower the survival rate, and the higher the coma index, the higher the survival rate. 1 ( ) 1 inj in j z f z e -= + Table 3.
Survival Rate by Logistic Regression Model
Variable Estimated value (b) Standard error (SE) Waldc2value p
A i X -0.063- 0.009 46.86 .000 G i X 0.059 0.018 10.95 .001 Constant 1.452 0.326 19.80 .000
Then, according to the above cutoff value of 0.72, we get the explained accuracy of 76.23% and by Cross Verifica-tion, the predictive accuracy of 60.64%. The details are shown below in Table 4.
Artificial Neural Network Model
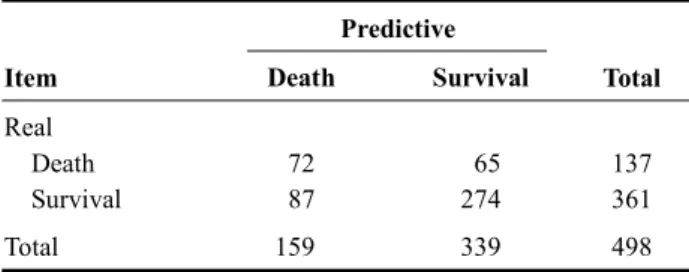
As the Artificial Neural Network does not have a spe-cific and fixed formula, we try to get the model with a better-predictive ability through different parameters. This study uses the hidden layer with three neurons and the learning rate (a) = 0.1 by Cross Verification (See Table 5). The predictive accuracy is 69.47%.
Comparison
As the study uses two different models the Logistic Regression and the Artificial Neural Network, to predict patient survival in the MICU, different cutoff values of the survival rate will influence the predictive accuracy. The predictive accuracy by the different adopted cutoff values is shown in Figure 2.
The effectiveness prediction of patients’ survival or death in the MICU is co-influenced by sensitivity and speci-ficity. Figure 3 shows the sensitivity of survival predictive accuracy and Figure 4 shows the specificity of death predic-tive accuracy. As shown in Figures 3 and 4, the sensitivity of the Artificial Neural Network Model is relatively better than the Logistic Regression Model, but the specificity varies by
different cutoff values. However, in order to favor the com-parison between these two models and achieve a higher pre-dictive accuracy in both models, the research set the cutoff value as 0.6. It means when the predictive survival rate of these two models is greater than or equal to 0.6, the research predicts the patient survived, whereas dead. The result of the overall predictive accuracy is as shown in Table 6.
The study result indicates that the predictive accuracy of survival (86.7%, n = 361) and total patients (74.7%, n = 498) in the Artificial Neural Network Model is better than those in the Logistic Regression Model. Thus, the effec-tiveness of the Artificial Neural Network Model to predict patient survival in a Taiwanese MICU is better than that of the Logistic Regression Model.
Table 4.
Logistic Regression: Predictive Accuracy Model
Predictive
Item Death Survival Total
Real
Death 100 037 137 Survival 159 202 361
Total 259 239 498
Table 5.
Artificial Neural Network: Predictive Accuracy Model
Predictive
Item Death Survival Total
Real
Death 72 065 137
Survival 87 274 361 Total 1590 339 498
Figure 3. Sensitivity (survival accuracy).
Figure 4. Specificity (death accuracy). Figure 2. Predictive accuracy (survival and death).
Conclusion
The study evaluates the predictive accuracy of pa-tient survival in a Taiwanese MICU using the Artificial Neural Network Model and the Logistic Regression Mo-del. The conclusion that the Artificial Neural Network Model provides an assurance of outcome prediction in ICU treatment, is the same as the conclusions reached with regard to prediction of ICU patient survival by the Neural Network Models by Goss and Ramchandani (1998) and Wong and Young (1999). Under the pressures of the policy of restraint in medical expenditure and the continu-ously increasing demand for critical care services, how to reduce unnecessary medical care, shorten length of stay and save medical costs and resources are goals pursued by every medical organization. Rapoport, Teres, Zhao, and Lemeshow (2003) found that compared with non-ICU care, the cost of first day in the ICU was approximately four times greater, and the cost of each subsequent ICU day was approximately 2.5 times greater. Stricker, Rothen, and Takala (2003) also pointed out that resources con-sumed by the 10.6% ICU patients hospitalized for more than seven days were 53.4% of the total consumed re-sources. Tarnow-Mordi, Hau, Warden, and Shearer (2000) found using multiple logistic regression analysis, that adjusted mortality was more than twice as high in patients exposed to high ICU workload than in those exposed to low workload. Therefore, using a good predictive system, medical organizations can adjust the workload of the ICU personnel at the appropriate time. Additionally, during bed shortages faced by the ICU daily, the system can help to lessen the pressure of bed allocation on medical per-sonnel. Moreover, if by additionally setting up a high-dependency unit (HDU), the medical organization can provide different medical resources and equipment, to enable critical care patients to receive appropriate care both on transfer into the ICU and on transfer out of the ICU, then it will be possible to optimize management in terms of both quality and cost.
Previous studies have found that impracticable fam-ily expectations were associated with increased resource utilization without significant survival benefit (Berge et al., 2005), and physicians’s decisions were often influ-enced by factors other than medical necessity (Giannini & Consonni, 2006). The fact that the goal of the ICU is to reduce patients’ short-term death rate; however, when the disease is uncured, related ethical problems may fol-low one by one. Therefore, how to make a decision or take care of both problems with the limited medical re-sources and humanity is a tough job. In society nowa-days, social value is decided by the ability to pay, not by the benefits obtained. This causes makes expensive med-ical resources not to be effectively utilized, especially in as much as some invasive, complex and expensive medi-cal instruments or equipment are used on patients who are unable to benefit from the treatment, in maintaining or monitoring their physiological signs and consuming massive medical expenses. From an ethical and moral point of view and without losing the sense of humanity, the meaning of life is not only to extend the patients’ time, but also to give them a better chance to face life. Therefore, in recent years, people have gradually come to value more the quality of life after treatment and good death. It becomes very important to use a good predictive system to decrease the difficulty of clinical decision-making by medical personnel, to assist medical person-nel in using more scientific and objective methods and give guidance in allocating expensive medical resour-ces, to change the practice of distributing limited sources by paying ability or age, and ensure patients re-ceive active and proper care in accordance with their objective prospects of survival.
Therefore by including the Artificial Neural Net-work Model in medical care information, medical care organizations not only can assist clinical medical per-sonnel in providing medical care services, but can also compare their performance with care providers interna-Table 6.
Comparison of Predictive Accuracy Between Logical Regression and Artificial Neural Network Models
Item n Logical Regression (%) Artificial Neural Network (%)
Predictive Accuracy
Survival 361 79.5 86.7
Death 137 50.4 43.1
tionally as a basis for improving their standards of clini-cal and mediclini-cal care and for strengthening their competi-tiveness.
References
Berge, K. H., Maiers, D. R., Schreiner, D. P., Jewell, S. M., Bechtle, P. S., Schroeder, D. R., et al. (2005). Resource utilization and outcome in gravely ill intensive care unit patients with predicted in-hospital mortality rates of 95% or higher by APACHE II scores: The relationship with physician and family expectations. Mayo Clinic
Proceed-ing, 80(2), 166–173.
Chiu, Y. H. (2002). The study of applying neural network
and data mining techniques to course recommenda-tion base on e-learning environment. Unpublished
mas-ter’s thesis, Chaoyang University of Technology, Tai-chung, Taiwan, ROC.
Chuang, Y. H. (2002). Exploring the patient severity of
ill-ness with nursing manpower in ICU — An example of medical center. Unpublished master’s thesis, Kaohsiung
Medical University, Taiwan, ROC.
Department of Health, Executive Yuan. (2004). Statistics &
An-alysis. Retrieved January 10, 2006, from http://www.doh.
gov.tw/statistic/data/ /82/TABLE03.XLS
Department of Health, Executive Yuan. (2005a). Statistics &
An-alysis. Retrieved January 10, 2006, from http://www.doh.
gov.tw/statistic/data/ /
93 /93 6.xls
Department of Health, Executive Yuan. (2005b). Statistics &
An-alysis. Retrieved January 10, 2006, from http://www.doh.
gov.tw/statistic/data/ /93/93 .pdf
Giannini, A., & Consonni, D. (2006). Physicians’ perceptions and attitudes regarding inappropriate admissions and re-source allocation in the intensive care setting. British
Journal of Anaesthesia, 96(1), 57–62.
Goss, E. P., & Ramchandani, H. (1998). Survival prediction in the intensive care unit: A comparison of neural net-works and binary logit regression. Socio-Economic
Plan-ning Sciences, 32(3), 189–198.
Rapoport, J., Teres, D., Zhao, Y., & Lemeshow, S. (2003). Length of stay data as a guide to hospital economic per-formance for ICU patient. Medical Care, 41, 386–397. Stricker, K., Rothen, H., & Takala, J. (2003). Resource use in
the ICU: Short- vs. long-term patient. Acta
Anaesthesio-logica Scandinavica, 47, 508–515.
Sznajder, M., Aegerter, P., Launois, R., Merliere, Y., Guidet, B., & Cubrea. (2001). A cost-effectiveness analysis of stays in intensive care unit. Intensive Care Medicine,
27(1), 146–153.
Tarnow-Mordi, W. O., Hau, O., Warden, A., & Shearer, A. J. (2000). Hospital mortality in relation to staff workload: A 4-year study in an adult intensive-care unit. The
Lan-cet, 356(9225), 185–189.
Tong, K. C. (1998). The utilization and cost benefit of the in-tensive care unit. Clinical Medicine, 41(6), 434–437. Wong, L. S. S., & Young, J. D. (1999). A comparison of ICU
mortality prediction using the APACHE scoring system and artificial neural networks. Anasesthesia, 54, 1048–1054.