An Embedded Gene Selection Method for Gene Expression Data
1Cheng-San Yang, 2Cheng-Hong Yang, 2Chao-Hsuan Ke , 3Li-Yeh Chuang
1
Dept. of Plastic Surgery, Chiayi Christian Hospital
2
Dept. of Electronic Engineering, National Kaohsiung University of Applied Sciences
3
Dept. of Chemical Engineering, I-Shou University E-mail: [email protected]
Abstract
In recent years, many studies have shown the microarray gene expression data is useful for disease identification and cancer classification. Due to it only has small number of samples, and contains thousands of genes simultaneously, it leads difficulty to implement the classification studies. Previous researches have shown that not all of the genes are necessary for identification of cancer category. Therefore, to extract small numbers and relevant genes involved in different types of cancer is an urgent and essential assignment. In this paper, both of the filter and wrapper frameworks were used to embed in a new gene selection method. The proposed method was combined with K-nearest neighbor classified algorithm to evaluate the classification performance on six published cancer classification data sets. The experiment results showed that our proposed method could select fewer numbers of gene subsets and lead to better accuracy of predictions than other literature methods.
Keyword: Gene selection, Gene expression data, Embedded model method
1. Introduction
DNA microarray technology allows monitoring and measuring simultaneously thousands of gene
expression activation levels in a single experiment, and has been used universally in medical diagnosis and genes analysis. Many research projects regarding to microarray analysis focus on clustering analysis and classification accuracy. In clustering analysis, the purpose of clustering is to analyze the gene groups that show a correlated pattern of the gene expression data, and provide insight of gene interactions and function. In classification accuracy, the purpose of classification is to build an efficient model for predicting the class membership of data, which is expected to produce the correct label on the training data, and predict the label for any unknown data correctly.
Gene expression data possesses a high dimension and a small sample size characters, which makes testing and training of general classification methods difficult. In general, only a relatively small number of gene expression data shows a strong correlation with a certain phenotype compared to the total number of genes investigated, which means that of the thousands of genes investigated, only a small number shows significant correlation with the phenotype in question. Thus, in order to analyze gene expression profiles correctly, feature (gene) selection is crucial for the classification process.
Some methods that are used for data reduction or specifically for feature selection in the context of microarray data analysis can be classified into two major groups: filter and wrapper model approaches.
The process of filtering model approach is separated before the classification process, in which each feature weight values is calculated, and the better features are chosen to represent the original dataset. However, the contribution of filter approach does not account its interaction with other features. The common filtering approaches include t-test [13], information gain(IG)[8], mutual information(MI), and entropy-based methods.
The wrapper model approach depends on feature addition or deletion to compose subset features, and uses evaluation function of learning algorithm to estimate the subset features. This kind of approach is similar to the optimal algorithm that searches the optimal result in a dimension space. The wrapper approach usually conducts a subset search by the optimal algorithm and classification algorithm to evaluate the subset. Many common optimal algorithms are applied, such as Genetic Algorithm (GA), Particle Swarm optimization (PSO) [9] and tabu search.
Particle swarm optimization is a population-based stochastic optimization technique, which was developed by Kennedy and Eberhart in 1995 [9]. PSO simulates the social behavior of organisms, such as birds in a flock or fish in a school, to describe an automatically evolving system. In PSO, each single candidate solution can be considered as "an individual bird of the flock", that is, a particle in the search space. Each particle used its own memory and knowledge gained by the swarms as a whole to find the best (optimal) solution. All of the particles have fitness values, which are evaluated by an optimized fitness function, and velocities which direct the movement of the particles. During the movement, each particle adjusts its position according to its own experience and the experience of a neighbor particle, thus the best position encountered is obtained by itself and its neighbor. The particles
move through the problem space by following a current of optimum particles. The process is then reiterated to a predefined number of times or until a minimum error is achieved.
In this study, we compared the gene selection performance by different filter mode and wrapper model, and combined the two models to build a new embedded model approach for gene selection approach. The proposed method was implemented on six microarray expression data for gene selection. The first model is to calculate the score values for each features using filter model approach. The second model is to select features based on the results of the first-stage using binary particle swarm optimization (BPSO), and to evaluate the selected features whether influence in classification accuracy using K-nearest neighbor (KNN) classifier. In the proposed embedded approach, K-nearest neighbor method with leave-one-out cross-validation (LOOCV) based on Euclidean distance calculations served as an evaluator of the embedded model approach for six multi-categories problems taken from the literature. The results showed through proposed method feature selection the proposed method can obtain fewer gene numbers and better classification accuracy than the other literature methods.
2. Gene Subset Selection
The process of our proposed method involves by two steps. In the first, we used some filter approaches to calculate the score values of each gene which are useful for distinction between different categories and retain the genes with high scores. In the second, we used evolution algorithm to select genes obtained from the first step, and evaluate the classification performance using K-nearest neighbor classifier.
2.1 Filter model approach
2.1.1 Information Gain
Quinlan [8] proposed a classification algorithm called ID3, which introduces the concept of information gain. Information gain simply is the reduction of classification entropy based on the observation of particular variable and used in the machine learning by decision tree, information gain is used in calculating significance of attributes. Each feature is chosen or deleted that depends on the value of information gain. Therefore, a threshold value has to be set for choosing the features; a feature is chosen when the information gain value of this feature is bigger than the threshold value, and vice versa.
Let S is the set of n instances and C is the set of k classes, P(Ci, S) represent the fraction of the examples in S that have class Ci. Then, the expected information from this class membership is shown as follows:
∑
= × − = k i i i S PC S C P S Info 1 )) , ( log( ) , ( ) ((1)
If a particular attribute A has v distinct values, the expected information required for the decision tree the weighted sum of expected information of the subsets of A based on the distinct values. Let Si be the set of instances whose value of attribute A is Ai.
∑
= × − = v i i i A InfoS S S S Info 1 ) ( ) ( (2)Then, the difference between Info(S) and InfoA(S) gives the information gain by partitioning S according on testing A. ) ( ) ( ) (A Info S Info S Gain = − A (3)
Higher of the information gain has a higher chance to get pure classes in a target class, if split on the variable with the highest gain.
2.1.2 Correlation-based Feature Selection
The Correlation-based Feature Selection (CFS) ranks attribute subsets according to a correlation based heuristic evaluation function. A subset of attributes is evaluated by considering the identification ability of each attribute [12]. The score evaluations function as Eq. 4:
(
)
ff cf s r k k k r k CFS 1 − + =(4)
where CFSs is the score value of a attribute subsetS containingk attributes, rcf is the average
attribute to class correlation
(
f∈S)
, andrff is theaverage attribute to the correlation. The CFS is used to determine the best combination attribute subset score values from original data sets, in which using heuristic search strategies to search the best combination. The common strategies include forward selection, backward elimination, and best first. In this study, we used weka [5] to implement CFS, and used selected gene subsets to identify different kinds of cancer types and various diseases.
2.2. Wrapper model approach
The wrapper model approach is a search procedure in the space of possible feature subsets. It depends on addition or deletion features to compose subset features. The wrapper approach usually divided into two models, one is deterministic, and the other is randomized [20]. The common deterministic
model has Sequential forward selection (SFS) and Sequential backward elimination (SBE), the randomized model has Estimation of distribution algorithms[6] and Evaluation optimal algorithm. Among all methods of these two models, we used evaluation optimal algorithm to select gene subsets [14]. This kind of approach is similar to optimal algorithm that searches optimal result in a dimension space, and uses classifier to evaluate selected gene subsets. At present, there are some evaluation optimal algorithms have been used to select gene subsets, such as Genetic Algorithm, Particle Swarm optimization [9], and tabu search.
2.3. Classification algorithm
K-Nearest neighbor (KNN) is a non-parametric pattern recognition approach [4], which has been applied to various information retrieval problems, such as pattern recognition and text categorization. The classifiers do not use any model for fitting but depends on memory, which works based on a minimum distance from the query instance to the training samples to determine the K-nearest neighbors. Any tied results are solved by a random procedure. The advantage of the KNN method is
simple and easy to implement. KNN is not negatively affected when the training data is large, and invariant to noisy training data. The disadvantages of KNN are need to determine parameter K (number of nearest neighbors), calculate the distance between the query-instance and all the training samples, sort the distances and determine the nearest neighbors based on the Kth minimum distance, as well as determine
the category of the nearest neighbors. In this study, the parameter for KNN is set to K=1.
3. Experimental framework
3.1 Experimental data sets
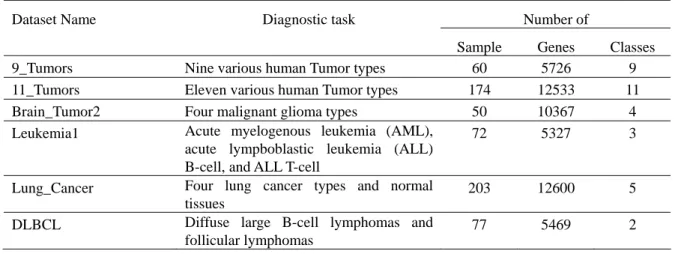
In this study, we used six multi-categories cancer-related human gene expression datasets, which were downloaded from http://www.gems-system.org [1]. The data format was arranged and shown in Table 1, which includes the data set name, the number of samples, categories and samples. In order to avoid bias, we implement linearly scale for each gene expression data value to the range [0, 1].
Table 1. Cancer-related human gene expression datasets
Dataset Name Diagnostic task Number of
Sample Genes Classes
9_Tumors Nine various human Tumor types 60 5726 9
11_Tumors Eleven various human Tumor types 174 12533 11
Brain_Tumor2 Four malignant glioma types 50 10367 4
Leukemia1 Acute myelogenous leukemia (AML), acute lympboblastic leukemia (ALL) B-cell, and ALL T-cell
72 5327 3
Lung_Cancer Four lung cancer types and normal tissues
203 12600 5
DLBCL Diffuse large B-cell lymphomas and
follicular lymphomas
3.2 Experimental design
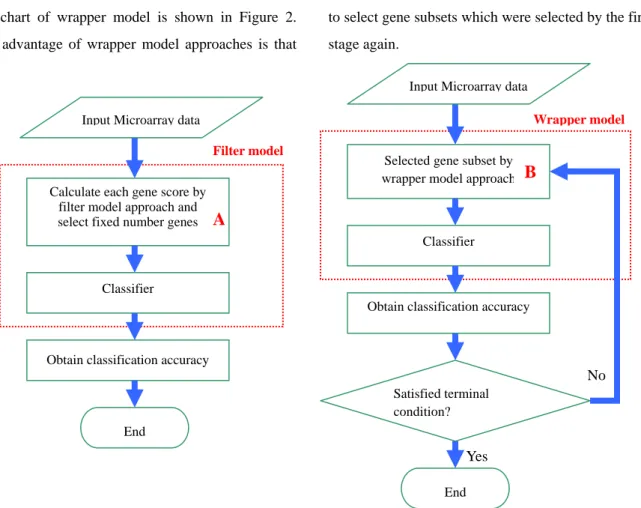
How many gene numbers of subset need to be selected is an important issue, it is the first problem need to be solve for gene selection. Many filter model of gene selection approach are proposed to deal with microarray data in the previous literature, such as t-test [13], BSS/WSS [15] and MRMR [2]. The flowchart of filter model is drawn as Figure 1. The advantage of filter model is that can fast select useful gene subsets, but the disadvantage is it does not take account for gene-gene interaction. Therefore, it will lead to obtain less classification accuracy. In order to solve this problem, the wrapper model approaches have been proposed especially. The common proposed approach of wrapper model have Sequential search [18], Genetic algorithm [10], and Correlated-based Feature Selection [12][21]. The flowchart of wrapper model is shown in Figure 2. The advantage of wrapper model approaches is that
could obtain better classification accuracy, because the wrapper model approach need collocate classifier to execute. However, the classifier will be considered during the gene selection process. Therefore, it needs much more computable time.
In order to utilize the advantages of both filter model and wrapper model, and avoid both disadvantages, we proposed an embedded model approach to perform gene subsets selection. We combined filter and wrapper model to build a two-stage method to select gene subsets, which is useful for the cancer types identification. In the first- stage, we used two different kinds of filter approaches to select specific number genes. In this study, we used weka software package [5] to calculate each attribute (gene) weight values and selected the fixed number gene. After the first-stage of gene subsets selection, optimal algorithm was used to select gene subsets which were selected by the first stage again.
Figure 1. The flowchart of filter model Figure 2. The flowchart of wrapper model No
Yes
Wrapper model
Satisfied terminal condition?
Selected gene subset by wrapper model approach
Classifier
End
B
Obtain classification accuracy Input Microarray data
Filter model
Calculate each gene score by filter model approach and select fixed number genes
Classifier
A
Obtain classification accuracy
End
Figure 3. The flowchart of embedded model
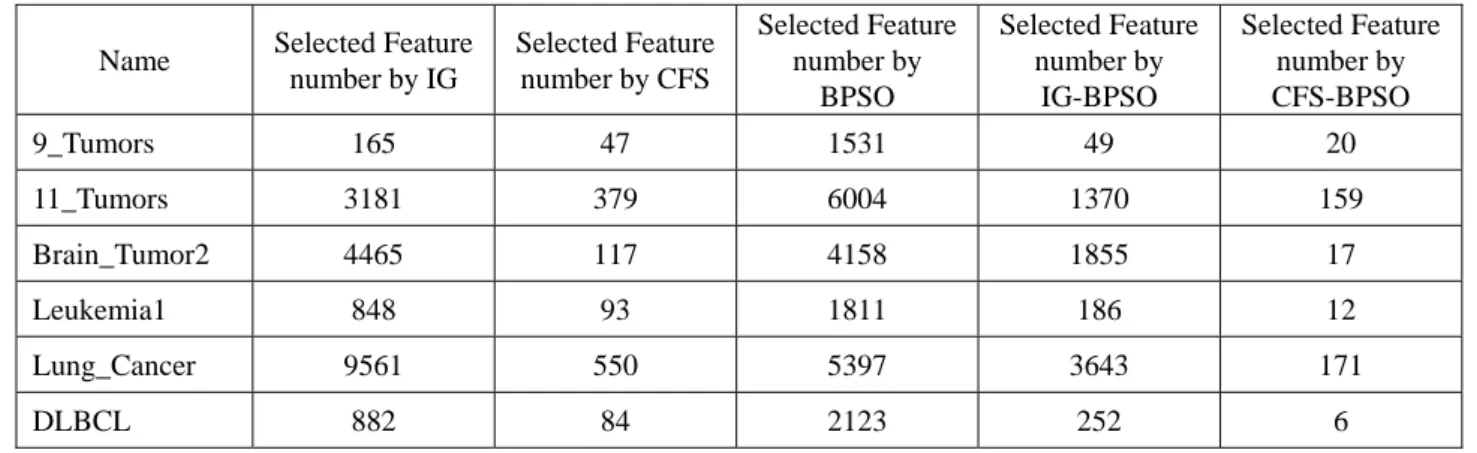
In the first-stage, we used Information Gain [8] and Correlation-based feature selection [21], two different filter model approaches to calculate each gene weight value. In order to achieve effective selection of gene subsets, we need set a threshold value for information gain. We chose the genes which threshold is 0, if the weight value of gene has
exceeded 0, to remain it, if not, then discard, the detail selected gene numbers are shown in Table 2. The higher values indicate this gene has higher discrimination of this feature from other categories, and meaning the feature can be used to effectively calculate the classification results.
Table 2. Selected Feature number by each filter model approach Name Selected Feature
number by IG Selected Feature number by CFS Selected Feature number by BPSO Selected Feature number by IG-BPSO Selected Feature number by CFS-BPSO 9_Tumors 165 47 1531 49 20 11_Tumors 3181 379 6004 1370 159 Brain_Tumor2 4465 117 4158 1855 17 Leukemia1 848 93 1811 186 12 Lung_Cancer 9561 550 5397 3643 171 DLBCL 882 84 2123 252 6 Yes No Embedded model Input Microarray data
Calculate each gene score by filter model method and select fixed number genes
Selected gene subset by wrapper model methods
Satisfied terminal condition?
End
B
A
In the second-stage, we focused on the feature genes which were selected at the first-stage using BPSO to implement feature genes selection again, in which a KNN serves as an evaluator of BPSO for classification. The procedure of the proposed method is described as following: initially, the position of each particle is represented in binary string form and generated which is selected feature genes at the first-stage randomly; the bit value {1} represents a selected feature, whereas the bit value {0} represents a non-selected feature. As above example, after the first-stage, we selected 5 genes ( f1, f2, f4, f7 and f10), when implement BPSO initial process, only aim at the 5 genes to execute initial process. For instance, pi =10011 which mean the f1, f7 and
10
f are selected at the ith particle.
The predictive accuracy of a 1-NN is determined by the LOOCV method that is used to measure the fitness of an individual. The best fitness value for each particle is pbestp (p=number of particles) and the best fitness value within a group of pbestp is the global fitness value gbest. Once pbest and gbest are obtained, we can keep track of the features of pbest and gbest particles with regard to their position and velocity. Each particle is updated according to the following equations.
(
)
(
old)
pd d old pd pd old pd new pd x gbest rand c x pbest rand c v w v − × × + − × × + × = 2 2 1 1 (5) if new pdv ∉(Vmin, Vmax) then new pd
v = max (min (Vmax, new
pd v ), Vmin) (6)
( )
new pd v new pd e v S − + = 1 1 (7) if(
( )
new)
pd v Srand()< then new=1
pd
x ;
else new=0
pd
x (8)
where w is the inertia weight, c1 and c2 are acceleration (learning) factors, and rand, rand1 and
rand2 are random numbers. Velocities new pd
v and
old pd
v are those of the new and old particle, respectively, xoldpd is the current particle position
(solution), and xnewpd is the updated particle position
(solution).
In Eq. 6, particle velocities of each dimension are tried to a maximum velocityVmax. If the sum of accelerations causes the velocity of that dimension to exceedVmax, then the velocity of that dimension is limited toVmax . Vmax and Vmin are user-specified parameters (Vmax= 6, Vmin=-6).
The feature after updating is calculated by the function S(vnewpd ) (Eq. 7), in which the velocity value isvnewpd . If ( )
new pd
v
S is larger than a randomly produced disorder number that is within {0.0~1.0}, then its position value Fn, n=1, 2, K, m is represented as {1} (meaning this feature is selected as a required feature for the next iteration). If
) (vnewpd
S is smaller than a randomly produced disorder number that is within {0.0~1.0}, then its position value Fn, n=1, 2, K, m is represented as {0} (meaning this feature is not selected as a required feature for the next iteration). The particle trajectory and velocity can be regarded as a change in the probability of finding it at a certain position and is therefore constrained to the range of [0.0, 1.0]. rand() is a quasi-randomly generated number within the range of [0.0, 1.0].
The whole procedure is repeated until either the fitness (classification accuracy) of a particle is 1.0 or the number of iterations is 100 (maximum number of iterations). The three factorsrand1, rand2 and are random numbers between [0.0, 1.0], whereas c1 and
2
4. Result and Discussion
In this study, we tested and analyzed the proposed approaches performance on the classification of six multi-categories cancer microarray expression data sets. There are many literatures have reported about gene selection for microarray data, such as Wang et al.,[19] used t-test score and Statnikov et al., [1] used sums of squares (BW) and signal-to-noise (S2N) to calculate each gene score, and then picked the gene with top scores to calculate the classification accuracy. In addition to the filter model gene selection approaches, other researches used evaluation algorithm to implement gene subset selection, called wrapper model approaches, such as Li et al., [10] used genetic algorithm and Xu et al., [14] used Particle Swarm Optimization to select gene subset. However, both of the filter model and wrapper mode have their disadvantages; the filter model could select important and speedy gene subsets than wrapper model, but the wrapper model could obtain better classification accuracy than filter model [21].
How many gene subsets are useful to identify cancer categories, it may be still a hard problem need to solve [16]. Regarding to microarray data analysis, many literature reports have indicated that many genes (noise) are useless for cancer categories identification [5][21]. In this study, we proposed an embedded approach which combined filter and wrapper model approach to compose as a new frame method. Our method takes both advantages of the filter and wrapper model that is useful to select few number gene subsets and improve the cancer classification performance. The embedded method divided into two groups: at the first-stage, we used filter model to select fixed number genes, and used wrapper model method to select gene subsets which have been selected by the first-stage. The advantage
of proposed method is the useful gene subset can be obtained at a short time, and using wrapper model to select genes which is more accuracy for different category identification.
In order to cleanly know the filter, wrapper and embedded model performance of gene selection approaches, we compared various combinations of selection models to evaluate the gene subset selection for identification ability of multi-categories cancer. In the first, we used two different filter model approaches to select specific number genes. The two filter model select approaches are information gain (IG) and Correlation-based Feature Selection (CFS).
The purpose of the first-stage is to select higher score genes which could be useful to identify different cancer or disease categories, and another objective is to eliminate harmful genes. The microarray data usually contain thousand of genes; many literatures indicate that not the entire genes are useful for classification accuracy [3]. If entire genes are used to calculate the classification performance, it would take large calculation time, and not ensure to obtain better results. After the first-stage, the selected gene subsets are contributed to identify different cancer and diseases categories. However, as mentioned previously, filter model could select individual gene which useful differentiate different cancer categorize, but could not to comprehend the interaction between gene and gene. Wang et al., [2] Xu et al., [14] and Golub et al., [17] indicated the diseases is formed not only by single gene, it means the cancer and disease is composed by more than one gene. For the reason, we guessed to search the interaction between gene and gene will be even more useful to identify different kind of cancer and diseases. Therefore, after the first-stage gene subset selection, we used the advantage of wrapper model which could search the interaction between gene and gene to select gene subsets.
To demonstrate the embedded model is useful to select important gene subset and improve the classification accuracy than the filter and wrapper model approaches individual. We in addition to used filter model approach to select gene subset, and used wrapper model approach to select gene separately. In our study, we used BPSO combined KNN classifier to implement gene subset selection.
Based on the results obtained from this experiment, we observed some outcomes of gene subset selection as following:
z The alone filter model gene selection approaches could select fewer gene number than original data gene numbers but could not obtain better classification accuracy. It could mean not all of genes are good for identification of different cancer or diseases categories.
z The alone wrapper model gene selection approaches also could select fewer gene number than original data gene numbers and also obtain better classification accuracy. But we found a noteworthy situation, that is the gene numbers which selected by wrapper model approach is more than selected by filter model. We think the reason is that the wrapper model approach is implemented to select gene subsets is similar to a combination problem. The method is to search the best combination for particular computation function, the common search best combination result is using evaluation algorithm (EA) to solve. However, the combination problems are a NP-hard problem that is not the most effective way to obtain the best result. Therefore, the wrapper model approach may not ensure to obtain fewer gene numbers than filter model
approaches.
z Our proposed method could obtain fewer gene numbers than both filter and wrapper model, and also obtain better classification accuracy. It proves that our method is competitive. The reason is our method has the advantages of both filter model and wrapper model, and avoids both disadvantages to improve the gene selection. We used filter model approach to select important genes and eliminate useless genes, and then used wrapper model approach to find the interaction between genes. Following the two models, we could obtain better classification performance and fewer gene numbers than individual filter and wrapper model approach.
z Between two filter model approaches, we found that CFS select fewer gene number but obtain better classification accuracy than Information gain. The reason is that two filter model approaches are using different model to calculate each gene scores. Information gain is using traditional method to calculate each single gene score values, but CFS is using combination method to calculate score values of each gene and other genes [12][21]. Through various combinations, CFS could find the best combination result for identification of different categories. For the reason, we could not obtain control fixed gene numbers at CFS process.
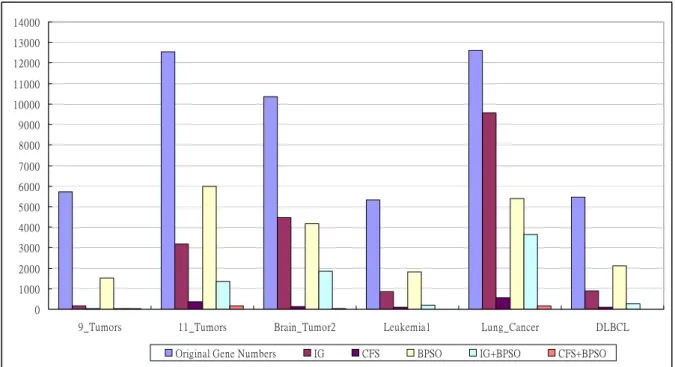
0 1000 2000 3000 4000 5000 6000 7000 8000 9000 10000 11000 12000 13000 14000
9_Tumors 11_Tumors Brain_Tumor2 Leukemia1 Lung_Cancer DLBCL Original Gene Numbers IG CFS BPSO IG+BPSO CFS+BPSO
Figure 4. The number of selected gene subsets by filter, wrapper and embedded model approaches.
30 35 40 45 50 55 60 65 70 75 80 85 90 95 100
9_Tumors 11_Tumors Brain_Tumor2 Leukemia1 Lung_Cancer DLBCL
Original Gene Numbers IG CFS IG+BPSO CFS+BPSO
Figure 5. The accuracy of selected gene subset by filter, wrapper and embedded model approaches.
Legends: (1) Original Gene Number: non-gene selection (2) IG: Information Gain (3) CFS: Correlated-based Feature Selection (4) BPSO: Binary Particle Swarm Optimization (5) IG+BPSO: Combine Information Gain and Binary Particle Swarm Optimization (6) IG+CFS: Combine Correlated-based Feature Selection and Binary Particle Swarm Optimization
Table 3. Accuracy of classification for gene expression data Filter model Wrapper model Embedded Non-Selection Non-Selection IG CFS BPSO IG- BPSO CFS- BPSO Data name OVR OVO DAG SVM WW CS KNN NN PNN KNN KNN KNN KNN KNN 9_Tumors 65.10 58.57 60.24 62.24 65.33 43.90 19.38 34.00 66.67 70.00 60.00 85.00 86.67 11_Tumors 94.68 90.36 90.36 94.68 95.30 78.51 54.14 77.24 83.33 90.23 83.91 93.63 100.0 Brain_Tumor2 77.00 77.83 77.83 73.33 72.83 68.67 60.33 62.83 78.00 90.00 80.00 84.00 100.0 Leukemia1 97.50 97.32 96.07 97.50 97.50 83.57 76.61 85.00 93.06 98.61 94.44 98.61 100.0 Lung_Cancer 96.05 95.59 95.59 95.55 96.55 89.64 87.80 85.66 90.15 95.07 91.63 94.58 98.03 DLBCL 97.50 97.50 97.50 97.50 97.50 86.96 89.64 80.89 93.51 96.10 90.91 100.0 100.0 Average 89.44 85.70 85.76 88.03 89.10 77.16 67.73 72.38 84.12 90.00 83.48 92.64 97.45
Legends: (1) Non-SVM: Tradition classification method. (2) MC-SVM: Multi-class support vector machines. (3) KNN:K-Nearest Neighbors. (4) NN: Backpropagation Neural Networks. (5) PNN: Probabilistic Neural Networks. (6) OVR:One-Versus-Rest. (7) OVO: One-Versus-One. (8) DAG: DAGSVM. (9) WW: Method by Weston and Watkins. (10) CS:Method by Crammer and Singer. (11) IG: Information Gain (12) CFS: Correlation-based Feature Selection (13) BPSO: Binary Particle Swarm Optimization (14) IG-BPSO: Information Gain + Binary Particle Swarm Optimization (15) CFS-BPSO: Correlation-based Feature Selection + Binary Particle Swarm Optimization
5. Conclusion
In this paper, two different kinds of filter model approaches and binary particle swarm optimization were combined to implement a gene selection process, and K-nearest neighbor (KNN) with Leave-one-out cross validation (LOOCV) method serve as a classifier for six classification profiles. Experimental results showed that the proposed method simplified the gene selection and the total number of parameters needed effectively, thereby obtaining a higher classification accuracy compared to other feature selection methods. The classification accuracy obtained by the proposed method has higher than other selected and non-selected in the entire six test problems. In the future, the proposed method can serve as other researches which need to implement feature selection, and can be applied to problems in other areas.
Reference
[1] A. Statnikov, C.F. Aliferis, I. Tsamardinos, D. Hardin, S. Levy, “A comprehensive evaluation of multicategory classification methods for microarray gene expression cancer diagnosis,” Bioinformatics, Vol. 21, No. 5, pp 631–643, 2005.
[2] C. Ding and H. Peng. Minimum redundancy feature selection from microarray gene expression data. In Proceedings of the IEEE Conference on Computational Systems Bioinformatics, pp. 523–528, 2003.
[3] C.H. Yeang, S. Ramaswamy, P. Tamayo, S. Mukherjee, R.M. Rifkin, M. Angelo, M. Reich, E. Lander, J. Mesirov, T. Golub, “Molecular classification of multiple tumor types,” Bioinformatics, Vol. 17, pp 1–7, Sup. 1, 2001. [4] D.L. Massart, B.G.M. Vandeginste, S.N.
Deming, Y. Michotte, and L. Kaufman, “The k-nearest neighbor method,” In Chemometrics:
A Textbook (Data Handling in Sciences and Technology, Vol.2) Elservier Sciences, New York, pp. 395-397.
[5] E. Frank, M. Hall, L. Trigg, G. Holmes, I.H. Witten, “Data mining in bioinformatics using Weka,” Bioinformatics, Vol. 20, No. 15, pp. 2479-2481, 2004.
[6] I. Inza and P. Larrañaga and R. Etxebarria and B. Sierra, "Feature subset selection by Bayesian networks based optimization." Artificial Intelligence, Vol. 27, pp. 143-164, 1999.
[7] I. Inza, P. Larra˜naga, R. Blanco, and A. Cerrolaza. Filter versus wrapper gene selection approaches in DNA microarray domains. Artificial Intelligence in Medicine, 31(2):91–103, 2004.
[8] J.R. Quinlan, “Induction of decision trees,” Machine Learning, No. 1, 1986, pp.81-106. [9] J. Kennedy, and R.C. Eberhart, “A discrete
binary version of the particle swarm algorithm,” In Proceedings of the 1997 Conference on Systems, Vol. 5, pp 4104-4108, Oct. 12-15, 1997.
[10] L. Li, C. R. Weinberg, T. A. Darden, and L. G. Pedersen, “Gene selection for sample classification based on gene expression data: study of sensitivity to choice of parameters of the GA/KNN method,” Bioinformatics, Vol. 17, No. 12, pp. 1131-1142, 2001.
[11] L.P. Wang, Feng Chu, and Wei Xie, "Accurate cancer classification using expressions of very few genes," IEEE Transactions on Bioinformatics and Computational Biology, vol.4, no.1, pp. 40-53, Jan.-March, 2007.
[12] M.A. Hall, Correlation-based feature selection for machine learning. Ph.D. Thesis. Department of Computer Science, University of Waikato. 1999.
[13] P. Jafari and F. Azuaje. An assessment of
recently published gene expression data analyses: reporting experimental design and statistical factors. BMC Medical Informatics and Decision Making, 6(1):27, 2006.
[14] R. Xu, G. Anagnostopoulos, and D. Wunsch II, "Multi-class cancer classification using semi-supervised ellipsoid ARTMAP and particle swarm optimization with gene expression data," IEEE/ACM Transactions on Computational Biology and Bioinformatics, vol. 4, no. 1, pp. 65-77, 2007.
[15] S. Dudoit, J. Fridlyand, and T. Speed. Comparison of discriminant methods for the classification of tumors using gene expression data. Journal of the American Statistical Association, 97(457):77–87, 2002.
[16] T. Li, C. Zhang, and M. Ogihara, “A Comparative Study of Feature Selection and Multiclass Classification Methods for Tissue Classification Based on Gene Expression,” Bioinformatics, Vol. 20, No. 15, pp. 2429-2437, 2004.
[17] T.R. Golub, D.K. Slonim, P. Tamayo, M. Gaasenbeek, C. Huard, J.P. Mesirov, H. Coller, M. Loh, J.R. Downing, M.A. Caligiuri, C.D. Bloomfield, E.S. Lander, Molecular classification of cancer: class discovery and class prediction by gene expression monitoring, Science 286, pp. 531-537, 1999.
[18] T.T. Wang, and C.H. Hsu, “Two-stage classification methods for microarray data,” Expert Systems with Applications, Vo. 34, Iss. 1, pp. 375-383, Jan. 2008.
[19] W. Buckinx, E. Buckinx, D. Van den Poel, G. Wets, “Customer-adapted coupon targeting using feature selection,” Expert Systems with Applications, 26 (4), pp. 509-518, 2004.
[20] Y. Saeys, I. Inza, and P. Larrañaga, “A review of feature selection techniques in
bioinformatics” Advance Access published on Aug. 24, 2007.
[21] Y. Wang, I. V. Tetko, A. H. Mark, F. Eibe, F. Alex, F.X. M. Klaus, W.M. Hans, “Gene selection from microarray data for cancer classification — a machine learning approach,” Computational Biology and Chemistry, Vol. 29, Issue 1, pp. 37-46, Feb. 2005.