Pretreatment Maximal Standardized Uptake Value of the Primary
Tumor Predicts Outcome to Radiotherapy in Patients
with Pharyngeal Cancer
Shih-Chieh LIN
1, Chih-Ying LIAO
6, Chia-Hung KAO
2,3*
†, Kuo-Yang YEN
2,5,
Shih-Neng YANG
1,5, Yao-Ching WANG
1, Ji-An LIANG
1,3and Shang-Wen CHEN
1,3,4*
†FDG PET-CT/SUV/Pharyngeal carcinoma/Radiotherapy/Tumor volume.
This study aimed to investigate whether the combination of clinical information, tumor volume and pretreatment SUVmax at the primary tumors might improve the prognostic stratification in pharyngeal cancer (PC) patients treated with radiotherapy (RT). Sixty-two patients with PC (35 oropharynx; 27 hypo-pharynx) treated with RT were enrolled in this retrospective analysis. All patients received pretreatment FDG- PET or PET/CT. The primary tumor relapse-free survival (PRFS) was calculated according to dif-ferent variables. The median values of the SUVmax for the primary tumors (SUVp-max) and the gross tumor volume (GTVp) were used to divide patients into two groups. Independent prognosticators were identified by the Cox regression analysis. In this study, the median SUVp-max and GTVp was 11 and 15.5 ml. Patients having tumors with SUVp-max > 11 had a significantly inferior 2-year PRFS (41% vs. 75%, p = 0.003) compared with patients having lower uptake tumors. Multivariate analysis of the PRFS showed two prognostic factors: SUVp-max > 11 (p = 0.04, hazard ratio = 2.67) and GTVp > 15.5 ml (p = 0.03, hazard ratio = 2.88). For patients with a GTVp less than 15.5 ml, there was a more significant impact of SUVmax-p on their PRFS compared to that for those with large ones. We disclosed a higher pretreat-ment SUVp-max is a predictor for primary recurrence in PC patients treated with RT, particularly for those with smaller tumor volumes. Patients with a large tumor volume or a higher SUVp-max should be considered for requiring more aggressive treatment approaches.
INTRODUCTION
Over the past decade definitive radiotherapy (RT) or con-current chemoradiotherapy (CCRT) has been increasingly employed in organ preservation scheme for oropharyngeal
and hypopharyngeal cancers. Despite recent advances in the high-precision delivery of RT, such as intensity-modulated radiotherapy (IMRT), implementation of individualized therapy is limited by a lack of comprehensive knowledge about individual response to a given RT until treatment has been completed. Although the traditional TNM classifica-tion or computed tomogram (CT)- based tumor volume has been used as a predictor of prognosis in head and neck patients,1,2) this parameter may not accurately reflect RT
out-come because of the greater variations in the radiosensitivity between tumors, even with the same origins.
Several methods for assessing tumor response before RT have been applied; one of the most easily or increasingly used is positron emission tomography and computed tomo-gram (PET/CT) or PET scan, which have the potential to improve treatment outcome by providing improved lymph node staging, and perhaps predictive factors. Theoretically, a high SUV value of the tumor probably implies a higher chance of tumor aggressiveness. Based on the results of 17 studies identified; however, the predictive value for head and neck cancer patients treated with RT or CCRT was not
*Corresponding author: Phone: 886-4-22052121-7450/7412, Fax: 886-4-22336174,
E-mail: [email protected] E-mail: [email protected]
1Department of Radiation Oncology, China Medical University Hospital,
Taichung Taiwan; 2Department of Nuclear Medicine and PET Center, China
Medical University Hospital, Taichung, Taiwan; 3School of Medicine,
College of Medicine School, China Medical University, Taichung, Taiwan;
4School of Medicine, College of Medicine, Taipei Medical University,
Taipei, Taiwan; 5Department of Biomedical Imaging and Radiological
Science, China Medical University, Taichung, Taiwan; 6Department of
Radiation Oncology, Taichung Hospital, Taichung Taiwan. †Contributed equally to this work.
Conflicts of Interest: All authors declare there were no actual or potential conflicts of interest in this study.
conclusive. Eight investigators indicated that the maximal standardized uptake value (SUVmax) could play a role in predicting RT/CCRT outcome,3–10) whereas the others
showed that it does not.2,11–18) These inconsistencies could be
a result of the heterogeneity of treatment modalities, the het-erogeneity of tumor sites, the use of several endpoints and the use of various SUVmax cut-off points.11) Furthermore,
substantial numbers of patients in theses studies were treated with surgery. In particular, most published studies did not examine the impact of tumor volume when investigating the predictive value of the SUVmax. Possibly studies with homogeneous tumor types, treatment characteristics and stratified for tumor volumes would be able to establish a real role for an optimal SUVmax cut-off for future treatment individualization.
This study aimed to investigate whether the combination of clinical information, tumor volume and pretreatment SUVmax at the primary tumors might improve the prognos-tic stratification in pharyngeal cancer (PC) patients after definitive RT or CCRT. We hypothesized that a higher pre-treatment SUVmax would adversely affect the local tumor control following RT. By this way, radiation oncologists might be able to assess the feasibility of salvage surgery ear-lier, or conduct a dose escalation scheme for those who have great probability of local failure.
MATERIALS AND METHODS
Patient population
Between Jan 2007 and Dec 2010, a cohort of 62 newly diagnosed oropharyngeal or hypopharyngeal cancer patients, who would undergo definitive CCRT or RT with IMRT at China Medical University Hospital, were enrolled in this ret-rospective study (certificate number of local institutional review board: DMR99-IRB-010-1). The median age was 51 years (range, 37 to 76 years). Fifty-nine patients were male and 3 were female. They received a pretreatment PET or PET/CT for pretreatment staging. The interval between the images and the commencement of RT was less than 2 weeks. No patient was known to have a history of diabetes and all had a normal serum glucose level before taking the PET/CT image. Nasopharyngeal cancer was not included in this study because of its relatively higher radiosensitivity and the difference in staging strategy compared to the other pharyn-geal cancers. The characteristics of the 62 patients are listed in Table 1.
PET/CT image acquisition
All patients were asked to fast for at least 4 hours before
18F-FDG PET/CT imaging. Approximately 60 minutes after
the administration of 370 MBq of 18F-FDG, images were
taken by PET scanner (Advance NXi PET scanner, General Electric Medical Systems, Milwaukee, WI, USA) before December 2008 or PET/CT scanner (PET/CT-16 slice,
Discovery STE, GE Medical System, Milwaukee, Wisconsin USA) after December 2008. During the uptake period, patients were asked to rest. The PET/CT workstation provid-ed the quantification of FDG uptake in terms of SUV. Nucle-ar medicine physicians identified the locations and values of SUVmax for all the primary tumors (SUVp-max). Then radiation oncologists reviewed the consistency of PET/CT images with nuclear medicine physicians. They also recon-firmed the allocated point of the SUVmax within the tumors. This procedure has been addressed in our previous report.19)
Delineation of CT-based tumor volume
CT-based tumor volume definition was previously described.20) Briefly, contouring of the tumor volume and
normal and critical structures was performed without knowl-edge of the PET results in an effort to reduce bias. Radiation oncologists, who had clinical experiences of more than
Table 1. Patient characteristics (totally 62)
Characteristic Value
Age (years) 37–76 (median, 51)
Sex Male 59, Female 3
Smoking Yes: 53, No: 19
Betel nut Yes: 42, No: 20
Alcoholism Yes: 43, No: 19
Pathology
W-D/M-D squamous cell carcinoma 44
P-D squamous cell carcinoma 8
Unclassified squamous cell carcinoma 10 Primary lesion site:
Oropharynx: 35 (56.5%)
Hypopharynx: 27 (43.5%)
AJCC 7th Stage II: 12, III: 20, IV: 30
GTV of the primary tumor (mL)
mean ± SD, 25.3 ± 24.8
median (range) 15.5 (2.3–130.2)
SUVmax of the primary tumor
mean ± SD, 11.9 ± 4.8
median (range) 11.0 (3.9–30.5)
Concurrent chemotherapy or drug
Cisplatin-based chemotherapy 54
Cetuximab 4
None 4
Follow up (months) 6–80 (median, 24)
Abbreviation: W-D = well-differentiated; M-D =moderately-differentiated; P-D = poorly-=moderately-differentiated; AJCC = American Joint Committee on Cancer; SD: standard deviation.
10 years, delineated the primary gross tumor volume (GTVp) and the metastatic lymph node volume. Neck lymph nodes were considered pathological when their smallest axis diameter was > 1 cm. To reduce inter-observer variations, at least 2 different radiation oncologists carried out the con-touring of the tumors for each patient. An average of the readings was used as the measured volume.
Treatment
RT was performed using a sequential IMRT technique as reported previously.20) All patients received 1.8 Gy daily up to
a total dose of between 68.4 and 73.8 Gy (median, 70.2 Gy). The clinical target volumes (CTV) were considered to be two regions with different risks: CTV1 encompassed the primary tumor, metastatic lymph nodes, and the regions adjacent to the gross tumor, and CTV2 consisted of the ipsi-lateral or contraipsi-lateral N0 regions at risk of harboring micro-scopic tumors. The dose delivered to CTV1/CTV2 during the first course was 50.4 to 54 Gy with a further boost of 16.2 to 21.6 Gy to the CTV1 during the second course. Thus, the median cumulative doses to the CTV1 and CTV2 were 70.2 Gy and 54.0 Gy, respectively. The median RT duration was 56 days. Because a phase 3 trial showed a survival ben-efit of CCRT in patients with unresectable head and neck cancers,21) patients with age less than 70 years and suitable
renal function were suggested to have CCRT. In all, 54 patients had concurrent chemotherapy. The regimen consist-ed of cisplatin (80–100 mg/m2 on Days 1, 22, 43). Four
patients had combined Cetuximab (400 mg/m2 loading dose,
then 250 mg/m2 weekly). Four patients received RT alone.
Follow-up
After completion of treatment, all patients were followed
up every 1 to 2 months over the first 2 years, and then every 3 to 4 months thereafter. A physical examination and laryn-goscopy were performed during each follow-up examina-tion, and a CT scan of the neck was done every 4 to 6 months over the first 2 years. The follow-up period for all patients ranged from 6 to 80 months (median, 24 months). Following RT, the definition of primary failure was based on
Table 2. Patient outcome
Outcome Patient number
(totally 62) Alive without evidence of recurrence 29
Alive with evidence of recurrence 11
Primary relapse alone 8
Neck lymph node relapse alone 2
Primary relapse with distant metastasis 1
Died of cancer 18
Primary relapse 12
Primary relapse and distant metastasis 1 Primary and neck lymph node relapse 3
Neck lymph node relapse 2
Died of complication without evidence
of recurrent cancer 1
Died of concurrent disease 3
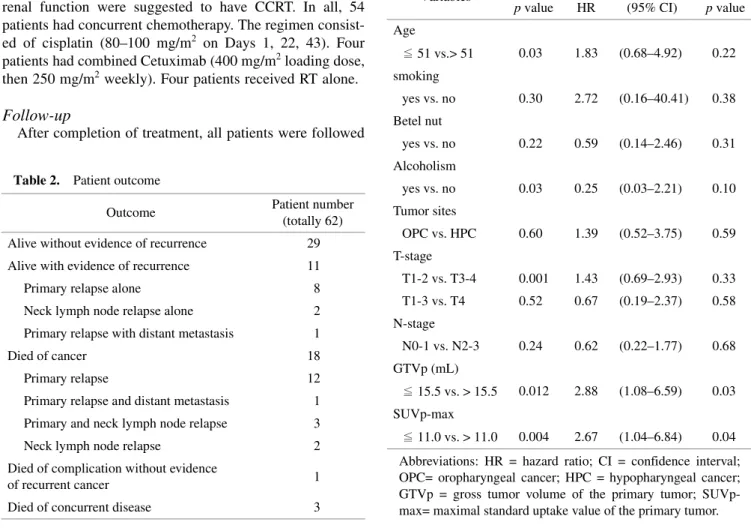
Table 3. The distribution of the SUVp-max and GTVp with respect to T classification No Mean GTVp ± SD ml (range) Mean SUVp-max ± SD (range) ALL 62 25.3 ± 24.8 (2.3–130.2) 11.9 ± 4.8 (3.9–30.5) T1-2 24 11.4 ± 5.8 (2.3–25.5) 9.9 ± 3.6 (3.9–18.7) T3 10 31.5 ± 24.4 (3.6–72.0) 12.3 ± 3.9 (6.7–20.1) T4 28 32.4 ± 29.1 (5.1–130.2) 13.7 ± 5.4 (5.1–30.5) Abbreviations: GTVp = gross tumor volume of the primary tumor; SD= standard deviation; SUVp-max= maximal standard uptake value of the primary tumor.
Table 4. Result of univariate, multivariate analysis and esti-mating hazard ratio of for primary relapse-free survival
Variables Univariate Multivariate
p value HR (95% CI) p value
Age ≦51 vs.> 51 0.03 1.83 (0.68–4.92) 0.22 smoking yes vs. no 0.30 2.72 (0.16–40.41) 0.38 Betel nut yes vs. no 0.22 0.59 (0.14–2.46) 0.31 Alcoholism yes vs. no 0.03 0.25 (0.03–2.21) 0.10 Tumor sites OPC vs. HPC 0.60 1.39 (0.52–3.75) 0.59 T-stage T1-2 vs. T3-4 0.001 1.43 (0.69–2.93) 0.33 T1-3 vs. T4 0.52 0.67 (0.19–2.37) 0.58 N-stage N0-1 vs. N2-3 0.24 0.62 (0.22–1.77) 0.68 GTVp (mL) ≦15.5 vs. > 15.5 0.012 2.88 (1.08–6.59) 0.03 SUVp-max ≦11.0 vs. > 11.0 0.004 2.67 (1.04–6.84) 0.04 Abbreviations: HR = hazard ratio; CI = confidence interval; OPC= oropharyngeal cancer; HPC = hypopharyngeal cancer; GTVp = gross tumor volume of the primary tumor; SUVp-max= maximal standard uptake value of the primary tumor.
the laryngoscopy results, a CT scan of the neck, or both. The RECIST criteria were used to assess the follow-up image findings.22) When the patient had a persistent tumor or local
recurrence after initial complete remission, salvage surgery was suggested when this was technically feasible and the patient’s condition allowed it.
Statistical analysis
In this study, median values for the SUVp-max and the GTVp were used as cut-off points. Because we hypothesized a positive impact of pretreatment SUVmax on local control by RT, the study endpoint simply focused on primary tumor relapse-free survival (PRFS) instead of other parameters
such as nodal failure. The PRFS was calculated using the Kaplan-Meier method. A successful surgical salvage for any recurrence in primary sites or neck lymph nodes was not tak-en into account whtak-en labeling the relapse-free. The log-rank test and the Cox regression were performed to explore the impact of explanatory variables on PRFS. Statistical signif-icance was defined as two-sided, p < 0.05. A correlation test between the SUVp-max and the GTVp was also done using the Pearson’s correlation with significance at 0.01. All cal-culations were performed with SPSS 13.0 for Windows (SPSS Inc, Chicago, IL, USA).
RESULTS
At the time of analysis, 29 patients were alive without
Fig. 1. Primary relapse-free survival according to the SUVp-max > 11 and ≦ 11.
Fig. 2. Primary relapse-free survival according to the GTVp > 15.5 ml and ≦ 15.5 ml.
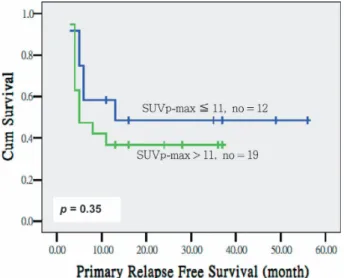
Fig. 3. Primary relapse-free survival divided by the SUVp-max > 11 and SUVp-max ≦ 11 for patients with GTVp ≦ 15.5 ml.
Fig. 4. Primary relapse-free survival divided by the SUVp-max > 11 and SUVp-max ≦ 11 for patients with GTVp > 15.5 ml.
known recurrent disease. Eleven patients had primary or nodal relapse but were still alive after salvage or palliative treatment. Eighteen patients had died of tumor recurrence. One had died of complication. Three patients were dead due to metachronous esophageal cancer. Table 2 summarizes the outcome of patients in this study. When initial treatment response was assessed at 1 to 2 month after the completion of treatment, complete remission of the primary tumor was observed in 42 patients (67.7%). With a median follow-up interval of 2 years, 25 patients (40.3%) developed recurrenc-es at the primary site with or without nodal failure. For all patients, the 2-year overall survival and 2-year PRFS were 60% and 57%, respectively.
The mean SUVp-max was 11.9 ± 4.8 (median 11.0; range, 3.9 to 30.5), whereas the mean GTVp was 25.3 ml ± 24.8 (median 15.5 ml; range, 2.3 to 130.2 ml). The distribution of the SUVp-max and pGTV with respect to T classification in is shown in Table 3. The correlation test showed there was no obvious association between the GTVp and the SUVp-max values (p = 0.24).
The impact of the tumors and the patient-related parame-ters on the PRFS was analyzed by univariate and multivari-ate analyses, and is presented in Table 4. As illustrmultivari-ated in Figs. 1 and 2, patients having tumors with SUVp-max > 11 had a significantly worse 2-year PRFS (41% vs. 75%, p = 0.003) compared with those having lower uptake tumors. Subjects having tumors with GTVp > 15.5 ml had an inferior 2-year PRFS (42% vs. 74%, p = 0.005) compared with those having smaller tumor volumes. Multivariate analysis of the PRFS showed two prognostic factors: SUVp-max > 11 (p = 0.04, hazard ratio = 2.67, 95% CI 1.04–6.84) and GTVp > 15.5 mL (p = 0.03, hazard ratio = 2.88, 95% CI 1.08–6.59). When using the SUVp-max > 11 in predicting primary recurrence at 2 year, the sensitivity, specificity, positive pre-dictive value, negative prepre-dictive value and accuracy was 69.2%, 72.0%, 72.0%, 69.2% and 70.6%, respectively.
When the PRFS curve was further stratified by the median value of the GTVp, the 2-year PRFS for SUVp-max ≦ 11 and SUVp-max > 11 were 92% and 47% (p = 0.014) for patients with GTVp ≦ 15.5 ml, whereas that for those with large volumes were 49% and 37% (p = 0.35), as depicted in Figs. 3 and 4. The predictive value of the SUVp-max did better for patients with smaller tumor volumes.
To minimize the confounding variables from the treatment modalities, a subgroup analysis was carried out for 54 patients treated with CCRT. Similarly, multivariate analysis of the PRFS showed SUVp-max > 11 was a predictor with a HR of 5.84 (p = 0.006, 95% CI 1.65 to 20.66).
DISCUSSION
Identification of factors predictive of treatment outcome in cancer patients is of great potential interest, because such research may allow therapy to be tailored to the
characteris-tics of individual tumors. The fact that pretreatment tumor volume can be a predictive factor is not novel. Because of variation in the radiosensitivity between tumors, treatment results might be optimized if prognostic factors, such as information from molecular image or other biomarkers could be used to supplement the clinical stage. Our study implement-ed patient- or tumor-relatimplement-ed, volumetric and PET/CT data when investigating the RT outcome in PC patients. All the subjects were treated with a consistent IMRT scheme. The result demonstrated that FDG uptake of the primary tumor, as mainly measured by the SUVmax, was associated with worse PRFS in PC patients treated by IMRT. A SUVp-max > 11 represents a biological phenotype for predicting recur-rence of primary tumor, particularly for those with the GTVp < 15.5 ml. This finding is consistent with a notion that within a limited tumor burden a higher FDG uptake might represent tumor aggressiveness such as proliferative activity, hypoxia, low apoptosis rate and p53 overexpression as described in some molecular studies.23–25) These
charac-teristics could be potentially adverse factors in patients treat-ed with RT/CCRT.
Our findings need to be compared with some earlier RT studies for head and neck cancers. Allal et al.3) showed the
SUVmax of the primary tumor remained significant adverse factors, either by considering the median value of 4.76 or the best cut-off of 3.5 in terms of local control or disease-free survival. However, 39.2% (47/120) of the patients were treated with surgery in their study. On the other hand, the investigation by Brun et al.4) is the only study indicating that
SUVmax is a prognostic factor in a patient population treat-ed with definitive RT/CCRT. They found that disease-free survival was worse when SUVmax was > 9. Because these studies included some proportion of patients with oral cavity cancers, which are always treated mainly by surgery with or without adjuvant RT, direct comparison might not be straightforward due to the heterogeneity of tumor sites. In addition, both studies analyzed the impact of clinical stage alone without CT-based tumor volumes information. In con-trast, Ohnishi K et al.2) reported an RT study for PC patients
with a combination of comprehensive pretreatment parame-ters. In their study, SUVmax > 12 was significantly associ-ated with local failure in univariate analysis, but only tumor volume > 10 ml remained an adverse factor in multinivariate analysis. To clarify the predictive value and an optimal cut-off point for SUVmax, previous and our studies highlighted the importance of working out comprehensive in-house data, including patient-related or volumetric information for those institutions using pretreatment FDG uptake as a biomarker for RT.
Another approach of implementing pretreatment PET/CT as a predictor is the measurement of metabolic tumor vol-ume (MTV). Chung et al.12) has investigated the outcome of
RT for PC and suggested the MTV > 40 ml was only a sig-nificant predictor for the disease-free survival. Another
study indicated a higher MTV of 9.3 mL is significantly associated with an increased risk of recurrence and death.13)
In the two studies, the regions of the MTVs were defined on the pretreatment PET/CT by a fixed SUV value of 2.5. While the debate between fixed and adaptive threshold still exits despite it has been discussed for a long time. In partic-ular, our previous investigation showed the latter approach could obtain a better match with the presumed tumor vol-umes.19) Also, Schinagl et al.11) conducted a predictive trial
of 77 head and neck cancer patients with eligible for defin-itive RT/CCRT. Five PET segmentation methods were applied: interpreting FDG PET visually, applying an isocon-tour at a SUV of 2.5, using fixed thresholds of 40% and 50% of the maximum FDG activity and applying an adaptive threshold based on the signal-to-background. They conclud-ed there is no role yet for pretreatment FDG PET as a pre-dictor of RT outcome. However, this potential application needs further exploration, focusing both on PET-based tumor volume and SUVmax of the primary tumor.
Despite the limitation, such as short follow-up duration, this study provides a reference value of SUVmax for opti-mizing an organ preservation scheme for PC when both PET/CT and primary tumor volume become a part of pre-treatment workup. Based on our data, we recommend the best treatment modification, such as dose escalation or con-sideration of adjunctive surgery, should be considered for tumors with a pretreatment SUVp-max more than 11 or with large tumor volumes. Certainly, the results have to be exam-ined further with longer follow-up interval and PC patients could not be classified simply by this model. Nonetheless, some progress of prognostic stratification could be done by this approach and might lead to a more appropriate selection of suitable candidates for organ preservation scheme.
CONCLUSION
The pretreatment SUVp-max > 11 is a predictor for recur-rence of primary tumor in PC patients treated with RT/CCRT, particularly for those with smaller tumor volumes. PC patients with a large tumor volume or a higher SUVp-max should be considered for requiring more aggressive treat-ment approaches, such as RT dose escalation or adjunctive surgery.
ACKNOWLEDGEMENTS
We want to thank the grant support of the study projects (DMR-94-080 and DMR-98-052) in our hospital and Taiwan Department of Health, Cancer Research Centers for Excel-lence (DOH100-TD-C-111-005).
REFERENCES
1. Studer G, et al (2007) Volumetric staging (VS) is superior to
TNM and AJCC staging in predicting outcome of head and neck cancer treated with IMRT. Acta Oncol 46: 386–394. 2. Ohnishi K, et al (2011) Prediction of local failures with a
combination of pretreatment tumor volume and apparent dif-fusion coefficient in patients treated with definitive radiother-apy for hypopharyngeal or oropharyngeal squamous cell carcinoma. J Radiat Res 52: 522–530.
3. Allal AS, et al (2004) Prediction of outcome in head-and-neck cancer patients using the standardized uptake value of 2-[18F]fluoro-2-deoxy-D-glucose. Int J Radiat Oncol Biol Phys 59: 1295–1300.
4. Brun E, et al (2002) FDG PET studies during treatment: pre-diction of therapy outcome in head and neck squamous cell carcinoma. Head Neck 24: 127–135.
5. Halfpenny W, et al (2002) A possible prognostic factor in head and neck cancer. Br J Cancer 86: 512–516.
6. Lee SW, et al (2008) Prediction of prognosis using standard-ized uptake value of 2-[(18)F]fluoro-2-deoxy-d-glucose posi-tron emission tomography for nasopharyngeal carcinomas. Radiother Oncol 87: 211–216.
7. Machtay M, et al (2009) Pretreatment FDG-PET standardized uptake value as a prognostic factor for outcome in head and neck cancer. Head Neck 31: 195–201.
8. Minn H, et al (1997) Prediction of survival with fluorine-18-fluoro-deoxyglucose and PET in head and neck cancer. J Nucl Med 38: 1907–1911.
9. Roh JL, et al (2007) 2-[18F]-Fluoro-2-deoxy-D-glucose pos-itron emission tomography as guidance for primary treatment in patients with advanced-stage resectable squamous cell car-cinoma of the larynx and hypopharynx. Eur J Surg Oncol 33: 790–795.
10. Schwartz DL, et al (2004) FDG-PET prediction of head and neck squamous cell cancer outcomes. Arch Otolaryngol Head Neck Surg 130: 1361–1367.
11. Schinagl DAX, et al (2011) Can FDG PET predict radiation treatment outcome in head and neck cancer? Results of a pro-spective study. Eur J Nucl Med Mol Imaging 38: 1449–1458. 12. Chung MK, et al (2009) Metabolic tumor volume of [18F]-fluorodeoxyglucose positron emission tomography/computed tomography predicts short-term outcome to radiotherapy with or without chemotherapy in pharyngeal cancer. Clin Cancer Res 15: 5861–5868.
13. Seol YM, et al (2010) Measurement of tumor volume by PET to evaluate prognosis in patients with head and neck cancer treated by chemo-radiation therapy. Acta Oncol 49: 201–208. 14. La TH, et al (2009) Metabolic tumor volume predicts for
recurrence and death in head-and-neck cancer. Int J Radiat Oncol Biol Phys 74: 1335–1341.
15. Soto DE, et al (2008) Correlation between pretreatment FDG-PET biological target volume and anatomical location of failure after radiation therapy for head and neck cancers. Radiother Oncol 89: 13–18.
16. Suzuki K, et al (2009) Value of fluorodeoxyglucose positron emission tomography before radiotherapy for head and neck cancer: does standardized value predict treatment outcome? Jpn J Radiol 27: 237–242.
17. Thorwarth D, et al (2006) Combined uptake of [18F]FDG and [18F]FMISO correlates with radiation treatment outcome in
head and neck cancer patients. Radiother Oncol 80: 151–156. 18. Vernon MR, et al (2008) Clinical outcomes of patients receiv-ing integrated PET/CT-guided radiotherapy for head and neck carcinoma. Int J Radiat Oncol Biol Phys 70: 678–684. 19. Kao CH, et al (2010) 18F-FDG PET/CT-based gross tumor
volume definition for radiotherapy in head and neck cancer: a correlation study between suitable uptake value threshold and tumor parameters. Radiat Oncol 5: 76.
20. Chen SW, et al (2009) Prognostic impact of tumor volume in patients with stage III-IVA hypopharyngeal cancer without bulky lymph nodes treated with definitive concurrent chemo-radiotherapy. Head Neck 31: 709–716.
21. Adelstein DJ, et al (2003) An intergroup phase III comparison of standard radiation therapy and two schedules of concurrent chemoradiotherapy in patients with unresectable squamous cell head and neck cancer. J Clin Oncol 21: 92–98.
22. Therasse P, et al (2000) New guidelines to evaluate the
response to treatment in solid tumors. European Organization for Research and Treatment of Cancer, National Cancer Insti-tute of the United States, National Cancer InstiInsti-tute of Canada. J Natl Cancer Inst 92: 205–216.
23. Minn H, et al (1995) In vitro comparison of cell proliferation kinetics and uptake of tritiated fluorodeoxyglucose and L-methionine in squamous-cell carcinoma of the head and neck. J Nucl Med 36: 252–258.
24. Clavo AC, Brown RS and Wahl RL (1995) Fluorodeoxyglu-cose uptake in human cancer cell lines is increased by hypoxia. J Nucl Med 36: 1625–1632.
25. Furuta M, et al (1997) Rapid rise in FDG uptake in an irradi-ated human tumour xenograft. Eur J Nucl Med 24: 435–438. Received on September 8, 2011 Accepted on February 7, 2012 J-STAGE Advance Publication Date: May 11, 2012