Mulberry leaf polyphenol extracts reduced hepatic lipid
accumulation involving regulation of adenosine monophosphate
activated protein kinase and lipogenic enzymes
Cheng-Hsun Wua,b,c,e, Shu-Chun Chena, Ting-Tsz Oua, Yu-Ching Changa,c,*, Charng-Cherng Chyauf, Chau-Jong Wanga,c,*
aInstitute of Biochemistry and Biotechnology, Chung Shan Medical University, No. 110, Section 1, Chien-kauo N. Road, Taichung, Taiwan
bDepartment of Anatomy, China Medical University, No. 91, Hsueh-Shih Road, Taichung 404, Taiwan.
cDepartment of Biochemistry, China Medical University, No. 91, Hsueh-Shih Road, Taichung 404, Taiwan.
dDepartment of Medical Research, Chung Shan Medical University Hospital, Taichung 402, Taiwan.
eDepartment of Medical Research, China Medical University Hospital, Taichung 404, Taiwan.
fInstitute of Biotechnology, College of Medicine and Nursing, Hung Kuang University, Taichung, Taiwan.
*Corresponding author Chau-Jong Wang, Professor. Tel: + 886-4-24730022ext11670 Fax: +886-4-2324-8167
Address: No.110, Sec. 1, Jianguo N. Rd., South District, Taichung, Taiwan 402 e-mail: [email protected] 1 2 3 4 5 6 7 8 9 10 11 12 13 14 15 16 17 18 19 20 21 22 23 24 25 26 27
ABSTRACT
Fat accumulation in the liver increases the risk of developing progressive liver injury. It can induce all the symptoms of metabolic syndrome, which is associated with many additional health problems, including increased risk of obesity, hypertension, insulin resistance, and non-alcoholic fatty liver disease (NAFLD). Therefore, prevention and treatment of fat accumulation in the liver are relevant to health promotion. Mulberry leaf polyphenol extracts (MLPE) have been known to modulate serum fasting glucose, lipid and antiatherosclerosis. However, the effect of MLPE on regulating hepatic lipid metabolism is unclear. This study evaluated the effects and mechanisms of MLPE in reducing hepatic lipid accumulation in cell culture. We found MLPE could regulate hepatic lipid accumulation. Further, numerous lipogenic enzymes, such as FAS (fatty acid synthetase), ACC (acetyl-CoA carboxylase), HMGCR (HMG-CoA reductase) and associated-lipogenic transcriptional factors (SREBP1 and SREBP2) were suppressed by MLPE. Our results show MLPE is able to reduce hepatic lipid accumulation through activation of the AMPK (AMP-activating protein kinase) signaling pathway. It may have potential therapeutic implications for human NFALD. 28 29 30 31 32 33 34 35 36 37 38 39 40 41 42 43
Keywords: Mulberry leaf polyphenol extracts; Fatty acid synthetase; Acetyl-CoA
carboxylase; HMG-CoA reductase ; AMP-actived protein kinase ; non-alcoholic fatty liver disease 46 47 48 49 50 51
1. Introduction
Unburnt energy is conserved in the form of fat in adipose tissue, leading to obesity and obesity-associated fatty liver disease (FLD) (Evans, Barish, & Wang, 2004). Obesity is closely associated with diseases such as non-alcoholic fatty liver disease (NAFLD), hypertension, hyperlipidemia, arteriosclerosis and cancer (Kopelman, 2000; Tilg & Moschen, 2006; Wellen & Hotamisligil, 2005). Obesity seems to be an important risk factor for non-alcoholic fatty liver disease (Ruderman, Chisholm, Pi-Sunyer, & Schneider, 1998). Therefore, prevention and treatment of NAFLD are relevant to health promotion.
Cryptogenic cirrhosis has been estimated to account for 5-30% of end-stage liver disease, and it has been asserted many of these cases of cirrhosis and the associated hepatocellular carcinoma represent the progression of NAFLD (Adams, Angulo, & Lindor, 2005). The underlying cause of fat accumulation in NAFLD is mostly due to the synthesis of fatty acids and inhibition of fatty acid oxidation (Reddy & Rao, 2006). Differentiated adipocytes store fatty acids in the form of triglycerols (TG) in their cytoplasm, with involvement of various enzymes such as FAS (Weissman, 1999). Activation of FAS expression through modulation of SREBP-1 has been reported in human breast cancer (Magana & Osborne, 1996). The hepatic TG content in human is significantly correlated with plasma TG level and fat mass (Qureshi &
52 53 54 55 56 57 58 59 60 61 62 63 64 65 66 67 68 69 70
Abrams, 2007). TG is synthesized in the liver, secreted into the blood stream and transported to the peripheral organs, including the adipose tissue (Duval, Muller, & Kersten, 2007; Muller, Lindman, Brantsaeter, & Pedersen, 2003). High intake of saturated fatty acids is associated with a high level of serum cholesterol (Steinberg, 1995). It is believed circulating concentrations of lipids and free fatty acids are increased after high-fat feeding, and the hyperlipidemia as well as the elevated plasma low-density lipoprotein (LDL) may result in initiation of atherosclerosis (Carling, 2004; Hardie, Hawley, & Scott, 2006; Rusinol et al., 2000).
Mulberry leaf has been used in traditional medicine for antidiabetes, antihyperlipidemics, reducing high blood pressure, high cholesterol and neutral fat (Assy et al., 2000; Steinberg, Parthasarathy, Carew, Khoo, & Witztum, 1989). The literature indicates mulberry leaf possesses anticancer effects and inhibits hyperglycaemia (Zhou et al., 2001). Several studies have reported mulberry leaf has potential antioxidant activity (Kim et al., 1999; Arabshahi-Delouee & Urooj, 2007; Katsube et al., 2006). Our previous studies have shown that mulberry leaf extract (MLE) is rich in polyphenols and can effectively inhibit vascular smooth muscle cells (VSMC) proliferation and migration (Chan et al., 2010; Yang et al., 2011). It contains several functional components, including flavonoids, which are known to be powerful polyphenols and antioxidants (Oliaro-Bosso et al., 2009).
71 72 73 74 75 76 77 78 79 80 81 82 83 84 85 86 87 88 89
This study investigated the hepatic hypolipidemia effect of MLPE. The results showed MLPE attenuated OA-induced hepatic lipid accumulation by activating of AMPK signals in hepatic cells.
2. Materials and methods
2.1. Materials
The mulberry leaves were collected in Dadu Township, located in central Taiwan. The 3-(4, 5-dimethylthiazol-zyl)-2, 5-diphenylterazolium bromide (MTT), oleic acid, and statin were purchased from Sigma-Aldrich (St. Louis, MO, USA). GSH peroxidase (GPx), superoxidase (SOD) and SREBP antibodies were obtained from Santa Cruz Biotechnology (CA, U.S.A.). Anti-pThr172-AMPK and anti-AMPK antibodies were purchased from Cell Signaling Technology (Beverly, MA, USA). Anti-β-actin and anti-catalase antibodies were purchased from Sigma-Aldrich.
2.2 Preparation of MLE and MLPE
Fresh mulberry leaves (100 g) were harvested and immediately dried at 50℃ in an oven. The dried leaves were heated in 1500 mL of deionized water. Following filtration, we removed the residue. The suspension was stored at -80℃ overnight and lyophilized to obtain MLE particles. For preparation of the polyphenol extract of mulberry leaves (MLPE), 100 g dried powder of mulberry leaves was merged in 300 mL of ethanol and heated at 50℃ for 3 h. The extract was filtered and thereafter 90 91 92 93 94 95 96 97 98 99 100 101 102 103 104 105 106 107 108 109
lyophilized under reduced pressure at room temperature. The powder was then resuspended in 500 mL of 50℃ distilled water, followed by extraction with 180 mL of ethyl acetate three times, redissolved in 250 mL of distilled water, stored at 70℃ overnight, and lyophilized.
2.3 Total phenolic content assay
Total phenolic compound content in each extract was spectrophotometrically determined in accordance with the Folin-Ciocalteu procedure by reading the absorbance at 725 nm against a methanol blank (Lakenbrink, Lapczynski, Maiwald, & Engelhardt, 2000). Briefly, samples (20 μl, water added to 1.6ml) were introduced into test tubes, and then 100 μl of Folin-Ciocalteu reagent and 300 μl of sodium carbonate (20%) were added. The tubes’ contents were mixed and incubated at 40℃ for 40min. Absorption at 725 nm was measured. The total phenolic contents were expressed as milligrams per gram of MLPE for gallic acid (GA) and rutin.
2.4 Total polysaccharide content assay
We used the phenol-sulfuric acid method (Siddiqui et al., 2009) to measure the polysaccharide content. The MLE was diluted in deionized water, and the dissolved extracts were filtered through a 0.22 μm filter (MILLEXHA) prior to treatment. Briefly, 100 μl of MLE, 100 μl of phenol (5%), and 500 μl of H2SO4 (95.5%) were mixed and then incubated at room temperature for 15 min. The absorbance at 490 nm was used to determine the amount of carbohydrate in the sample. Different 110 111 112 113 114 115 116 117 118 119 120 121 122 123 124 125 126 127 128 129
concentrations of glucose (0, 10, 30, 50, 70, and 90 μg/ml) were used as standards.
2.5 Lipid content assay
Lipid content was measured by the acid hydrolysis method. The MLE (1 g) were mixed with hydrochloric acid (20 ml) in a conical flask, then heated in a water bath at 70-80 ℃ for about 50 min. After heating, the mixture was cooled to room temperature, and then 10 mL of ethanol and 20 ml of ethyl ether were added to a separatory funnel. The separatory funnel was vigorously shaken to ensure complete mixing of the two liquid phases. Then, the two liquid phases were allowed to separate for at least 2 h until the layers were clearly separated. The lower solvent was collected in a new beaker, and the upper solvent (ethyl ether) was collected in a conical flask. Ethyl ether (20 ml) was added to the lower solvent and poured into a separatory funnel, which was shaken vigorously to ensure complete mixing of the two liquid phases. The above process was repeated three times. The collected ethyl ether was evaporated under vacuum and then dried in an oven. The weight of the flask was measured and used as the content of lipid after the flask tare weight was subtracted.
2.6 High-performance liquid chromatography (HPLC) assay of polyphenol content
The components of MLE were determined by HPLC analysis using a Hewlett-Packard Vectra 436/33 N system with a diode array detector (Hewlett-Hewlett-Packard, Palo Alto, CA, USA). The HPLC method employed a 5 uM RP-18 column (4.6 × 150 mm 130 131 132 133 134 135 136 137 138 139 140 141 142 143 144 145 146 147 148 149
i.d.). The MLE were filtered through a 0.22 uM filter disk, and then 20 mg/ml of the MLE was injected into the column. The mobile phase contained two solvents: A, 20 % acetic acid/water; B, 0.5 % acetic acid in water/ acetonitrile.
2.7 Cell culture
HepG2 cells obtained from the American Type Culture Collection were maintained in DMEM supplemented with 10% fetal calf serum, 100 U/ml penicillin, 100 μg/ml streptomycin, and 2 mM L-glutamine and kept at 37℃ in a humidified atmosphere of 5 % CO2. Cells were grown to 70% confluence and then incubated in serum-free medium for 24 h before treatments. To induce FA overloading, HepG2 cells at 70 % confluence were exposed to a long-chain oleic acid (OA). OA/BSA complex was prepared as reported previously. Stock solutions of 1M OA prepared in culture medium containing 1% BSA were conveniently diluted in culture medium to obtain the desired final concentrations. The OA/BSA complex solution was sterile-filtered through a 0.22 μm pore membrane filter and stored at -20 ℃.
2.8 Determination of cell viability MTT Assay
To evaluate the cytotoxicity of MLE and OA, the MTT [3-(4, 5-Dimethylthiazol-2-yl)-2, 5-diphenyltetrazolium Bromide Assay] assay was performed. Cells were seeded at a density of 1×10⁵/ml and treated with various concentrations of MLE and OA for 24 h. After exposure, media were removed, and the cells were washed with phosphate-buffered saline (PBS). Thereafter, the medium was changed to the one 150 151 152 153 154 155 156 157 158 159 160 161 162 163 164 165 166 167 168 169
containing MTT (5 mg/ml) for 4 h incubation. The viable cell was directly proportional to the production of formation. Following dissolution in isopropanol, the result was read at 563 nm with a spectrophotometer (Beckman DU640).
2.9 Oil red staining
HepG2 cells were cultured in a 6-well plate and treat with various concentrations of MLE. Fallowing treatments, cells were washed three times with iced PBS and fixed with 4% paraformalin for 60 min. After fixation, cells were washed and stained with Oil Red solution (stock solution, 3 mg/ml in isopropanol; working solution, 60% Oil Red stock solution and 40% distilled water) for 10 min at room temperature. After staining, cells were washed with PBS to removed unbound dye, and then observed under a microscope (Olympus, Tokyo).
2.10 Nile red staining
HepG2 cells were cultured in a 6-well plate and treated with various concentrations of MLE. After treatments, cells were washed three times with iced PBS and fixed with 4% paraformalin for 60 min. The cells were stained with 1 μg/ml Nile red for 5 min in phosphate-buffer saline. To quantify Nile red content levels, flow cytometry was performed at an excitation wavelength of 488 nm.
2.11 Statistical analysis
Results are reported as the mean ± standard deviation of 3 independent experiment, and statistical comparisons were evaluated by one way analysis (ANOVA), P< 0.05 170 171 172 173 174 175 176 177 178 179 180 181 182 183 184 185 186 187 188 189
was considered statistically significant.
3. Results
3.1 MLE content assay
By extracting dry mulberry leaves, we obtained 27% of water extracts. Polyphenols, are widely found in many plants and has effective functions in lowering lipid and antioxidant effect. Thus, the single-ring type of polyphenol compounds (Gallic Acid, GA) and multi-ring type of polyphenol compounds (rutin) can be used to determine the standard content of total polyphenol. The table 1 show that MLE contains the single-ring polyphenol compounds (21.16 %) and multi-ring polyphenol compounds (26.6 %). We showed that the compositions of MLE were polysaccharide (25 %), protein (2.3 %), and oil (8.4 %).
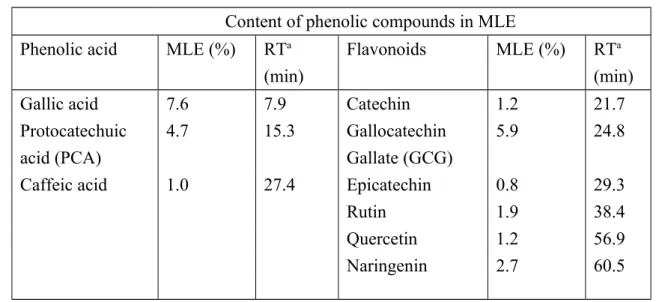
Both phenolic acid and flavonoids are the main polyphenols made by plants. We next determined the polyphenolic compositions of MLE via HPLC analysis (figure 1). The analysis of phenolic acids revealed the presence of gallic acid (7.6%), protocatechuic acid (15.3%), and caffeic acid (1.0%), as well as flavonoids including catechin (1.2 %), gallocatechin gallate (5.9 %), epicatechin (0.8 %), rutin (1.9 %), quercetin (1.2 %), and naringenin (2.7 %). Detailed polyphenolic compositions of the MLE are given in table 2.
3.2 The effect of OA, MLE and MLPE on cell viability of HepG2 cells.
190 191 192 193 194 195 196 197 198 199 200 201 202 203 204 205 206 207 208 209
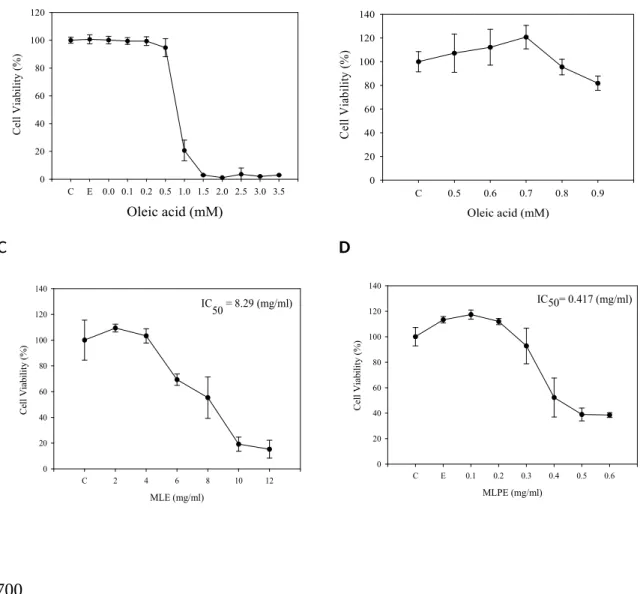
By using different concentrations of OA, MLE, and MLPE to treat HepG2 cells, after 24 h, we analyzed cell viability. Fig.2A and B showed, under the concentration of 0.7 mM OA, cell viability is unaffected. When the concentration of OA is more than 0.9 mM, it damages cells, especially under the effect of 1.0 mM OA, and cell viability is only 20 %. The lethal drug doses (IC50) of MLE and MLPE are 8.29 and 0.417 mg/ml each (figure 2C, D). This experiment focuses on the premise intracellular lipid accumulation will not cause any damage to cells. So the follow-up experiment will be based on doses of 1, 2 and 3 mg/ml MLE and 0.1, 0.2, and 0.3 mg/ml MLPE by treating with HepG2 cells.
3.3 The effect of different concentration of OA on lipid accumulation in HepG2 cells
The above results show cell growth condition is good in 0.1-0.7 mM OA and cell survival rates maintain 100%. Thus, we use 0.2, 0.5, and 0.7 mM OA to culture HepG2 cells to observe the fat accumulation. Fig. 3A is the result of using oil red staining (left), and we observed the phenomenon of the accumulation of cytoplasmic droplets, which is shown by the arrow-signaled part. Nile red fluorescent staining (right) showed fat accumulation distributed red fluorescence. These results indicated fat occured in the cytoplasma in a doses dependent manner. Next, using Nile red 210 211 212 213 214 215 216 217 218 219 220 221 222 223 224 225 226 227 228
staining and flow cytometric analysis to detect the intensity of fluorescence, we find the stronger the intensity of fluorescence is, the more fat it has. Fig. 3B shows cells treated with 0.2, 0.5 and 0.7 mM OA tend to increase 2 to 3 times of the intracellular fat (P < 0.001). In addition, the solvent used to make OA, ethanol, has a slight induction of lipid accumulation, but does not have any significant meaning. The result can prove that OA induces lipid accumulation in the liver cells (Figure 3).
3.4 Inhibition of OA-induced lipid accumulation by MLE and MLPE in HepG2 cells.
Next, we co-treated with OA and MLE, MLPE, and Statin to compare the effect of reducing the intracellular lipid accumulation. Oil red and Nile red staining showed the droplets of oil are clearly visible in cells. The fat content of HepG2 is 2.3 times higher(P<0.05) than the control group after being induced by OA. (Fig 4A, B) MLE treatment of cells at high doses of 3 mg/ml resulted in reduced lipid content (2.3 fold to 1.5 fold) compared to the OA group. (P<0.05). Treatment with Statin also reduces lipid content by about 1.5 times ( P<0.05) compared with the OA group. After co-treatment with OA and different concentrations of MLPE (0.1, 0.2, 0.3 mg/ ml) and statin, the intracellular fat contents were reduced 1.3, 1.0 and 0.8 times respectively (Fig 5C). The results show the ability of MLPE to inhibit intracellular fat 229 230 231 232 233 234 235 236 237 238 239 240 241 242 243 244 245 246 247
accumulation is clearly effective with a higher concentration (figure 5). The above experimental result shows these three drugs all have the effect of inhibiting intracellular fat accumulation.
3.5 Effect of MLE and MLPE on the expression of TG synthesis related proteins.
FAS is mainly involved in fatty acid synthesis, so when the amount of sugar or fat in food is too much, it will stimulate significant expression of FAS. As shown in figure 6A, cells induced by OA have 1.17 times the expression of FAS. Compared with the control group, after cells have added 1, 2, 3 mg/ml MLE each, the expression of FAS is 1.02, 0.95 and 0.97 times. Fig. 6B shows cells induced by OA have 1.24 times the expression of FAS. After adding 0.1, 0.2, and 0.3 mg/ml MLPE each, the expression of FAS is 1.20, 1.05, and 0.60 times. This reveals that MLE and MLPE can reduce the expression of FAS in HepG2 cells after being induced by OA, and it is dose-dependent.
The function of ACC is the same as that of FAS, both of which are enzymes for the synthesis of fatty acid. ACC is responsible for catalyzing acetyl-CoA into malnoyl-CoA; FAS can synthesize malnoyl-CoA synthesis into long-chain fatty acids.
In Fig. 6A, the expression of ACC induced by OA is increased 1.81 times, indicating the synthesis of fatty acid is very active. Compared with the control group, when treating with difference concentration of MLE (1, 2, 3 mg/ml), the expression of ACC 248 249 250 251 252 253 254 255 256 257 258 259 260 261 262 263 264 265 266 267
is decreased 1.70, 1.68 and 1.59 times, respectively. The phosphorylation of ACC was increased 1.63, 1.68, and 2.51 times by MLE (1, 2, 3 mg/ml) treatment, when compared with the control group. Fig. 6A shows, with the increasing concentration of MLE, the p-ACC/ACC ratio varies. The highest expression is treatment with 3 mg/ml MLE and the lowest expression is inducement by OA, meaning MLE, in addition to reducing the phosphorylation of ACC, can inhibit the activation of ACC ( p <0.001). In Fig. 6B, we know the phosphorylation of ACC in MLPE is 0.1 mg/ml (2.07 times), 0.2 mg/ml (1.31 times), and 0.3 mg/ml (1.07 times) each. Compared with the group induced by OA (2.30 times), it shows a decreasing trend. The expression of p-ACC is 0.1 mg/ml (1.40 times), 0.2 mg/ml (2.10 times), and 0.3 mg/ml (2.01 times) each. Compared with the group induced by OA (1.24 times), it shows an increasing trend. The results of the p-ACC/ACC ratio are shown in Figure 6B. Cells induced by OA will reduce the p-ACC/ACC ratio (p <0.05), while the 0.3 mg/ml MLPE will increase the p-ACC/ACC ratio about 2.0 times (p <0.001), showing that MLPE will inhibit the activation of ACC.
SREBP1 is responsible for the biosynthesis of fatty acids control respectively, such as the transcription FAS and ACC being able to converse the free fatty acid in the liver to TG and store it, and differentiate it in fat cells. Fig. 6A and Fig. 6B show both MLE and MLPE can reduce the expression of SREBP1. From those data, we can 268 269 270 271 272 273 274 275 276 277 278 279 280 281 282 283 284 285 286
validate through inhibition of those transcription factors, MLE and MLPE may regulate the synthesis of fatty acid and cholesterol.
3.6 Effect of MLE and MLPE on the expression of cholesterol synthesis related proteins
Fig. 7A shows the expression of HMGCR induced by OA is 1.75 times. Compared with the control group, after cells have 1, 2, and 3 mg/ml MLE added, the expression of HMGCR is 0.97, 1.07, and 0.98 times. In Fig. 7B, the expression of HMGCR which is induced by OA is 1.20 times. Compared with the control group, after cells have 0.1, 0.2, and 0.3 mg/ml MLPE added, the expression of HMGCR is 0.92, 0.50, and 0.39 times. This reveals both MLE and MLPE can reduce the expression of HMGCR in HepG2 cells after inducement by OA.
Fig. 7A reveals the expression of LDLR induced by OA is 0.91 times. Compared with the control group, after cells have 1, 2, and 3 mg/ml MLE added, the expression of LDLR is 0.78, 0.64, and 0.55 times. Fig. 7B reveals the expression of LDLR induced by OA is 1.07 times. Compared with the control group, after cells have 0.1, 0.2, and 0.3 mg/ml MLPE added, the expression of LDLR is 0.80, 0.74, and 0.47 times. These showed both MLE and MLPE can reduce the expression of LDLR in HepG2 cells after inducement by OA, and it is dose-dependent.
SREBP2 is responsible for the biosynthesis of cholesterol control respectively, such 287 288 289 290 291 292 293 294 295 296 297 298 299 300 301 302 303 304 305 306
as the transcription HMGCR, and LDLR. Fig. 7A and Fig. 7B show both MLE and MLPE can reduce the expression of SREBP2, and it is dose-dependent. We can validate through the inhibition of those transcription factors, MLE and MLPE may regulate the synthesis of cholesterol.
3.7 Effect of MLE and MLPE on the phosphorylation of AMPK
By phosphorylation, AMPK can inhibit ACC activity to reduce the synthesis of fatty acid. However, AMPK itself required the phosphorylation of AMPK kinase to be activated. In addition, AMPK is an important regulator in the metabolism mechanism for sugar and fat. In Fig. 8A, for the expression of AMPK induced by OA, there is no change in cells. Compared with the control group, the expression of p-AMPK, after being treated with MLE, significantly increased by 1.18, 1.35, and 1.80 times.
To further confirm ACC activation is regulated by AMPK, we observed the expression of AMPK and AMPK. After treated with 3 mg/ml MLE, the p-AMPK/AMPK ratio has an upward trend (p <0.05), which means MLE can activate AMPK (Fig. 8A).
In Fig. 8B, the expression of AMPK is 0.1 mg/ml (0.98 times), 0.2 mg/ml (1.46 times), and 0.3 mg/ml (1.28 times) each. Compared with the group induced by OA (0.83 times), it shows an increasing trend. The expression of p-AMPK is 0.1 mg/ml (1.43 times), 0.2 mg/ml (1.66 times), and 0.3 mg/ml (2.07 times). Compared with the 307 308 309 310 311 312 313 314 315 316 317 318 319 320 321 322 323 324 325 326
group induced by OA (1.10 times), it shows an increasing trend. As shown in Fig. 8, our results show 0.3 mg/ml MLPE increase the p-AMPK/AMPK ratio by about 2.3 times (p <0.05), indicating MLPE activates the expression of AMPK. We demonstrate that MLE and MLPE can inhibit the activation of ACC by activating AMPK and reduce the lipid synthesis of cells.
3.8 Comparison of MLE, MLPE and Statin for lipogenic enzymes expression.
From the previous experiment, we validate that MLE and MLPE, by inhibiting the expression of FAS, HMGCR, and LDLR, can reduce the synthesis of fatty acid and cholesterol, and confirm it is regulated by AMPK. Next, during the experiment, we add one clinical cholesterol lowering drug Statin, to compare the effectiveness of regulating these proteins. Cells which are induced by OA have Statin (5 μM), MLE (3 mg / ml) and MLPE (0.3 mg / ml) added, and we then use Western Blot to analyze the protein expression (Fig. 8C). In the expression of FAS, the control group induced by OA is 1.07 times. The expression of Statin, MLE and MLPE is 1.10, 0.85, and 0.80 times each. This shows that MLPE has the best inhibition result and Statin shows no variation. In the expression of HMGCR, the expression of the group induced by OA is 1.14 times. The expression of Statin, MLE and MLPE in each group is 1.06, 0.88, and 0.90 times. These show MLE and MLPE have almost the same effectiveness, and are 327 328 329 330 331 333 334 335 336 337 338 339 340 341 342 343 344 345
even better than Statin. In the expression of LDLR, the expression of the group induced by OA is 0.96 times. The expression of Statin, MLE and MLPE in each group is 1.05, 0.95, and 0.94 times. This shows those three drugs have no effect in enhancing the effectiveness of LDLR. The experimental results show both MLE and MLPE can inhibit the synthesis of TG and cholesterol, and the pharmacological mechanism of Statin serves as the HMGCR inhibitor, and can only regulate the expression of HMGCR. However, the results also show HepG2 cells treated with 5 μM Statin can reduce the effectiveness of cholesterol synthesis, but because the dose is far lower than that for human therapy, it is not as effective as the use of MLE and MLPE.
4. Disccusion
Obesity is closely associated with diseases such as NAFLD, hypertension, hyperlipidemia, arteriosclerosis and cancer (Kopelman, 2000). The liver plays an essential role in lipid metabolism via regulating lipogenesis and oxidative stress (Madan, Bhardwaj, Thareja, Gupta, & Saraya, 2006). In the present investigation, to verify the inhibition of MLPE of OA-induced lipid accumulation, HepG2 cells were treated with indicated concentrations of MLPE in the presence of OA for 24 h. The results indicate MLPE has an effect on suppressing OA-mediated lipid accumulation (Figure 3C and 4C). Our finding is consistent with previous reports that rutin could 346 347 348 349 350 351 352 353 354 355 356 357 358 359 360 361 362 363 364
significantly reduce the levels of OA-induced lipid accumulation (Wu et al., 2011). Polyphenols are plants secondary metabolites derived from the phenylpropanoid biosynthetic pathway that feature more than one phenolic ring in their basic chemical structure. The MLE maybe inhibit lipid accumulation (Li, Ma, Wang, & Tian, 2005).The major polyphenol components of MLE are gallic acid (7.6 %), Gallocatechin gallate (5.7 %), and protocatechuic acid (4.7 %) (Table 2). Studies have indicated that gallic acid inhibits HFD-induced dyslipidemia (Hsu & Yen, 2007) and protocatechuic acid intake lowered hepatic lipid content in mice (Liu, Lin, Wang, Mong, & Yin, 2010). According to these reports, we infer that these polyphenol might inhibit obesity and hepatic lipid accumulation. Recent studies on obesity in the field of food science have focused on the search for functional food ingredients or herbal extracts that can suppress the accumulation of body fat (Carling, 2004).
The mechanism underlying fat accumulation of NAFLD is mostly due to the synthesis of fatty acids and inhibition of fatty acid oxidation (Reddy & Rao, 2006). We further examined the statins to compare the effect of MLPE with statins on lipid homeostasis. The statins (or HMGCR inhibitors) are a class of drugs that lower cholesterol levels in people. The results show the expressions of FAS and HMGCR in cells increase by OA treatment, and both MLPE can inhibit the expression of those proteins (Fig. 6 and Fig. 7). We suggest mulberry leaves extract may inhibit the 365 366 367 368 369 370 371 372 373 374 375 376 377 378 379 380 381 382 383
synthesis of TG and cholesterol. This is consistent with FAS being the main enzyme in lipogenesis, which is a curative index in obesity treatment (Kemp et al., 2003). Others study have demonstrated that polyphenols are the major compound of mulberry which has antioxidant activity against low-density lipoprotein (LDL) in
vitro and in vivo (Ziaee, Zamansoltani, Nassiri-Asl, & Abbasi, 2009; Chou, Chang, Hung, Chen, & Chiu, 2013). It contains several nutritional components including flavonoids, which are known as powerful polyphenols and antioxidants (Oliaro-Bosso et al., 2009;Chang et al., 2013 ).
The function of ACC is the same as that of FAS, both of which are enzyme for the synthesis of fatty acid. AMPK is a multi-subunit enzyme recognized as a major regulator of lipid biosynthetic pathways due to its role in the phosphorylation and inactivation of key enzymes, such as ACC (Zhou et al., 2001). On the other hand, AMPK has been highly valued in the research of lipometabolism. It can adjust the synthesis of fatty acid (Kemp et al., 2003). We therefore examined the effect of MLPE on AMPK activity and the protein expression of SREBP-1. The data showed MLPE-treated cells had significantly increased phosphorylation levels of AMPK (Fig. 8). This agrees with previous studies where polyphenolic extracts from numerous plants activated AMPK (Hwang et al., 2005). Several reports demonstrate AMPK plays a key role in regulating carbohydrate and fat metabolism, serving as a metabolic 384 385 386 387 388 389 390 391 392 393 394 395 396 397 398 399 400 401 402
master which switches its response to alterations in cellular energy change (Winder & Hardie, 1999). Our data also showed the expression of SREBP-1 was reduced in response to MLPE treatment (Fig. 6). This agrees with a recent study suggesting AMPK mediates a decrease in SREBP-1 protein expression (Auger et al., 2005). SREBP-1 is a key lipogenic transcription factor, which directly activates the expression of more than 30 genes (including FAS), dedicated to the synthesis and uptake of fatty acids, cholesterol, and TG (Brown & Goldstein, 1997; Edwards, Tabor, Kast, & Venkateswaran, 2000; Sakakura et al., 2001).
In fact, activation of AMPK has validated a strategy for liver steatosis therapy (Brooks, Brooks, Lee, Lee, & Kim, 2009) and has suppressed FAS expression because it prevents SREBP-1 translocation from the nuclei (Weng, Ho, Ho, & Lin, 2007). This report found FAS has the same ability to activate AMPK and then reduce SREBP-1 expression, finally leading to inhibition of hepatic lipogenesis. In conclusion, we prove MLPE can reduce lipid accumulation. We also propose that AMPK is pivotal in closing the anabolic pathway and promoting catabolism by down regulating the activity of key enzymes in the lipid metabolism, such as, HMGCR, ACC, and FAS. MLPE can suppress fat accumulation in the liver and could be developed as a potential therapeutic treatment to reduce the formation of a fatty liver and NAFLD. 403 404 405 406 407 408 409 410 411 412 413 414 415 416 417 418 419 420 421
ACKNOWLEDGMENT
This study was supported by National Science Council (NSC99-2632-13040-MY3), Taiwan.
Reference:
Adams, L. A., Angulo, P., & Lindor, K. D. (2005). Nonalcoholic fatty liver disease.
Canadian Medical Association Journal, 172(7), 899-905.
Arabshahi-Delouee, S., & Urooj, A. (2007). Antioxidant properties of various solvent extracts of mulberry (Morus indica L.) leaves. Food Chemistry, 102, 1233– 1240.
Assy, N., Kaita, K., Mymin, D., Levy, C., Rosser, B., & Minuk, G. (2000). Fatty infiltration of liver in hyperlipidemic patients. Digestive Diseases and
Sciences, 45(10), 1929-1934.
Auger, C., Teissedre, P. L., Gerain, P., Lequeux, N., Bornet, A., Serisier, S.,
Besancon, P., Caporiccio, B., Cristol, J. P., & Rouanet, J. M. (2005). Dietary wine phenolics catechin, quercetin, and resveratrol efficiently protect
hypercholesterolemic hamsters against aortic fatty streak accumulation.
Journal of Agricultural and Food Chemistry, 53(6), 2015-2021.
Brooks, S. C., 3rd, Brooks, J. S., Lee, W. H., Lee, M. G., & Kim, S. G. (2009). Therapeutic potential of dithiolethiones for hepatic diseases. Pharmacology &
Therapeutics, 124(1), 31-43.
Brown, M. S., & Goldstein, J. L. (1997). The SREBP pathway: regulation of cholesterol metabolism by proteolysis of a membrane-bound transcription factor. Cell, 89(3), 331-340.
Carling, D. (2004). The AMP-activated protein kinase cascade--a unifying system for energy control. Trends in Biochemical Sciences, 29(1), 18-24.
Chan, K. C., Ho, H. H., Peng, C. H., Lan, K. P., Lin, M. C., Chen, H. M., & Wang, C. J. (2010). Polyphenol-rich extract from mulberry leaf inhibits vascular smooth muscle cell proliferation involving upregulation of p53 and inhibition of cyclin-dependent kinase. Journal of Agricultural and Food Chemistry, 58(4), 2536-2542.
Chang, Y. Y., Yang, J., Chiu, C. H., Lin, Y. L., Chen, J. W., & Chen Y. C. (2013) Antioxidative and anti-inflammatory effects of polyphenol-rich litchi (Litchi 422 423 424 425 426 427 428 429 430 431 432 433 434 435 436 437 438 439 440 441 442 443 444 445 446 447 448 449 450 451 452 453 454 455
chinensis Sonn.)-flower-water-extract on livers of high-fat-diet fed hamsters.
Journal of Functional Foods,5, 44-52.
Chou, M.C., Chang, R., Hung, Y. H., Chen, Y. C., & Chiu C. H. ( 2013) Antrodia camphorata ameliorates high-fat-diet induced hepatic steatosis via improving lipid metabolism and antioxidative status. Journal of Functional Foods, doi.org/10.1016/j.jff.2013.04.019
Duval, C., Muller, M., & Kersten, S. (2007). PPARalpha and dyslipidemia.
Biochimica et Biophysica Acta, 1771(8), 961-971.
Edwards, P. A., Tabor, D., Kast, H. R., & Venkateswaran, A. (2000). Regulation of gene expression by SREBP and SCAP. Biochimica et Biophysica Acta,
1529(1-3), 103-113.
Evans, R. M., Barish, G. D., & Wang, Y. X. (2004). PPARs and the complex journey to obesity. Nature Medicine, 10(4), 355-361.
Hardie, D. G., Hawley, S. A., & Scott, J. W. (2006). AMP-activated protein kinase--development of the energy sensor concept. The Journal of Physiology, 574(Pt 1), 7-15.
Hsu, C. L., & Yen, G. C. (2007). Effect of gallic acid on high fat diet-induced dyslipidaemia, hepatosteatosis and oxidative stress in rats. British Journal of
Nutrition, 98, 727-735.
Hwang, J. T., Park, I. J., Shin, J. I., Lee, Y. K., Lee, S. K., Baik, H. W., Ha, J., & Park, O. J. (2005). Genistein, EGCG, and capsaicin inhibit adipocyte differentiation process via activating AMP-activated protein kinase.
Biochemical and Biophysical Research Communications, 338(2), 694-699.
Kemp, B. E., Stapleton, D., Campbell, D. J., Chen, Z. P., Murthy, S., Walter, M., Gupta, A., Adams, J. J., Katsis, F., van Denderen, B., Jennings, I. G., Iseli, T., Michell, B. J., & Witters, L. A. (2003). AMP-activated protein kinase, super metabolic regulator. Biochemical Society Transactions, 31(Pt 1), 162-168. Kim, S. Y., Gao, J. J., Lee, W. C., Ryu, K. S., Lee, K. R., & Kim, Y. C. (1999).
Antioxidative flavonoids from the leaves of Morus alba. Archives of
Pharmacal Research, 22(1), 81-85.
Kopelman, P. G. (2000). Obesity as a medical problem. Nature, 404(6778), 635-643. Lakenbrink, C., Lapczynski, S., Maiwald, B., & Engelhardt, U. H. (2000). Flavonoids
and other polyphenols in consumer brews of tea and other caffeinated beverages. Journal of Agricultural and Food Chemistry, 48(7), 2848-2852. Li, B. H., Ma, X. F., Wang, Y., &Tian, W. X. (2005). Structure-activity relationship
of polyphenols that inhibit fatty acid synthase. Journal of Biochemisty, 138, 679-685.
Liu, W. H., Lin, C. C., Wang, Z. H., Mong, M. C., & Yin, M. C. (2010). Effects of 456 457 458 459 460 461 462 463 464 465 466 467 468 469 470 471 472 473 474 475 476 477 478 479 480 481 482 483 484 485 486 487 488 489 490 491 492 493
protocatechuic acid on trans fat induced hepatic steatosis in mice. Journal of
Agricultural and Food Chemistry, 58, 10247-10252.
Madan, K., Bhardwaj, P., Thareja, S., Gupta, S. D., & Saraya, A. (2006). Oxidant stress and antioxidant status among patients with nonalcoholic fatty liver disease (NAFLD). Journal of Clinical Gastroenterology, 40(10), 930-935. Magana, M. M., & Osborne, T. F. (1996). Two tandem binding sites for sterol
regulatory element binding proteins are required for sterol regulation of fatty-acid synthase promoter. Journal of Biological Chemistry, 271(51), 32689-32694.
Muller, H., Lindman, A. S., Brantsaeter, A. L., & Pedersen, J. I. (2003). The serum LDL/HDL cholesterol ratio is influenced more favorably by exchanging saturated with unsaturated fat than by reducing saturated fat in the diet of women. Journal of Nutrition, 133(1), 78-83.
Oliaro-Bosso, S., Calcio Gaudino, E., Mantegna, S., Giraudo, E., Meda, C., Viola, F., & Cravotto, G. (2009). Regulation of HMGCoA reductase activity by
policosanol and octacosadienol, a new synthetic analogue of octacosanol.
Lipids, 44(10), 907-916.
Qureshi, K., & Abrams, G. A. (2007). Metabolic liver disease of obesity and role of adipose tissue in the pathogenesis of nonalcoholic fatty liver disease. World
Journal of Gastroenterology, 13(26), 3540-3553.
Reddy, J. K., & Rao, M. S. (2006). Lipid metabolism and liver inflammation. II. Fatty liver disease and fatty acid oxidation. American Journal of Physiology -
Gastrointestinal and Liver Physiology, 290(5), G852-858.
Ruderman, N., Chisholm, D., Pi-Sunyer, X., & Schneider, S. (1998). The
metabolically obese, normal-weight individual revisited. Diabetes, 47(5), 699-713.
Rusinol, A. E., Yang, L., Thewke, D., Panini, S. R., Kramer, M. F., & Sinensky, M. S. (2000). Isolation of a somatic cell mutant resistant to the induction of
apoptosis by oxidized low density lipoprotein. Journal of Biological
Chemistry, 275(10), 7296-7303.
Sakakura, Y., Shimano, H., Sone, H., Takahashi, A., Inoue, N., Toyoshima, H., Suzuki, S., & Yamada, N. (2001). Sterol regulatory element-binding proteins induce an entire pathway of cholesterol synthesis. Biochemical and
Biophysical Research Communications, 286(1), 176-183.
Siddiqui, M. J., Hafizoh, S. N., Ismail, Z ., Sahib, H. B., Helal, M.H.S., & Abdul-Majid, A. M. S. (2009). Analysis of Total Proteins, Polysaccharides and Glycosaponins Contents of Orthosiphon stamineus Benth. In Spray and Freeze Dried Methanol: Water(1:1) extract and its Contribution to Cytotoxic and 494 495 496 497 498 499 500 501 502 503 504 505 506 507 508 509 510 511 512 513 514 515 516 517 518 519 520 521 522 523 524 525 526 527 528 529 530 531
Antiangiogenic Activities. Pharmacognosy research, 1, 320-326.
Steinberg, D. (1995). Role of oxidized LDL and antioxidants in atherosclerosis.
Advances in Experimental Medicine and Biology, 369, 39-48.
Steinberg, D., Parthasarathy, S., Carew, T. E., Khoo, J. C., & Witztum, J. L. (1989). Beyond cholesterol. Modifications of low-density lipoprotein that increase its atherogenicity. The New England Journal of Medicine, 320(14), 915-924. Katsube, T., Imawaka, N., Kawano, Y., Yamazaki, Y., Shiwaku, K., & Yamane, Y.
(2006). Antioxidant flavonol glycosides in mulberry ( Morus alba L.) leaves isolated based on LDL antioxidant activity. Food Chemistry, 97, 25-31.
Tilg, H., & Moschen, A. R. (2006). Adipocytokines: mediators linking adipose tissue, inflammation and immunity. Nature Reviews Immunology, 6(10), 772-783. Weissman, C. (1999). Nutrition in the intensive care unit. critical care, 3(5), R67-75. Wellen, K. E., & Hotamisligil, G. S. (2005). Inflammation, stress, and diabetes. The
Journal of Clinical Investigation, 115(5), 1111-1119.
Weng, M. S., Ho, C. T., Ho, Y. S., & Lin, J. K. (2007). Theanaphthoquinone inhibits fatty acid synthase expression in EGF-stimulated human breast cancer cells via the regulation of EGFR/ErbB-2 signaling. Toxicology and Applied
Pharmacology, 218(2), 107-118.
Winder, W. W., & Hardie, D. G. (1999). AMP-activated protein kinase, a metabolic master switch: possible roles in type 2 diabetes. American Journal of
Physiology, 277(1 Pt 1), E1-10.
Wu, C. H., Lin, M. C., Wang, H. C., Yang, M. Y., Jou, M. J., & Wang, C. J. (2011). Rutin inhibits oleic acid induced lipid accumulation via reducing lipogenesis and oxidative stress in hepatocarcinoma cells. Journal of Food Science, 76(2), T65-72.
Yang, M. Y., Huang, C. N., Chan, K. C., Yang, Y. S., Peng, C. H., & Wang, C. J. (2011). Mulberry leaf polyphenols possess antiatherogenesis effect via inhibiting LDL oxidation and foam cell formation. Journal of Agricultural
and Food Chemistry, 59(5), 1985-1995.
Zhou, G., Myers, R., Li, Y., Chen, Y., Shen, X., Fenyk-Melody, J., Wu, M., Ventre, J., Doebber, T., Fujii, N., Musi, N., Hirshman, M. F., Goodyear, L. J., & Moller, D. E. (2001). Role of AMP-activated protein kinase in mechanism of metformin action. The Journal of Clinical Investigation, 108(8), 1167-1174. Ziaee, A., Zamansoltani, F., Nassiri-Asl, M., & Abbasi, E. (2009). Effects of rutin on
lipid profile in hypercholesterolaemic rats. Basic and Clinical Pharmacology
and Toxicology, 104(3), 253-258. FIGURE LEGENDS 532 533 534 535 536 537 538 539 540 541 542 543 544 545 546 547 548 549 550 551 552 553 554 555 556 557 558 559 560 561 562 563 564 565 566 567 568 569
Figure 1. HPLC chromatogram of MLE. HPLC chromatogram of MLE (20 mg/ml)
showed nine kinds of standard polyphynols. The arrow indicated the retention time of polyphenols.
Figure 2. Cell viability of HepG2 cells were treated with OA, MLE and MLPE.
(A-B) HepG2 cells were treated with OA under different concentration (0.1-3.5 mM) for 16 h and analyzed by MTT assay. The data were mean±SD from 4 samples for each group. (C-D) Cultured HepG2 cells were treated with various concentrations of MLE and MLPE for 24 hours and analyzed by MTT assay. The data were mean±SD from four samples for each group. C, control; E, ethanol
Figure 3. OA induced lipid accumulation in HepG2 cells. (A) Cultured cells had
induced lipid accumulation with OA. Cellular neutral lipid accumulation using Oil red staining (left) and Nile red staining (right) were measured. The white arrow indicated lipid dropts. HepG2 cells were incubated at 2.4×10⁶ cells/well. Representative fluorescent photomicrographs are shown (× 200). (B) Quantification of intracellular fat content with flow cytometric analysis. The data were mean±SD from three samples for each group. **p < 0.001 in relation to the control group. C, control; E, ethanol.
Figure 4. Inhibition of OA-induced lipid accumulation by MLE in HepG2 cells.
570 571 572 573 574 575 576 577 578 579 580 581 582 583 584 585 586 587 588 589
(A-B) Cultured cells were induced lipid accumulation with OA for 16 h and treated with MLE (1-3 mg/ml) or statin (5 μM) for 24 h. To measure cellular neutral lipid accumulation by using Oil red staining and Nile red staining. HepG2 cells were incubated at 2.4×10⁶ cells/well. Representative fluorescent photomicrographs are shown (× 100). (C) Quantification of intracellular fat content with flow cytometric analysis. The data were mean±SD from three samples for each group. #p < 0.05 in relation to the control group. *p < 0.05 in relation to the OA-induced group. **p < 0.001 in relation to the OA-induced group. C, control; E, ethanol; S, statin
Figure 5. Inhibition of OA-induced lipid accumulation by MLPE in HepG2 cells.
(A-B) Cultured cells were induced lipid accumulation with oleic acid (OA) for 16 h and treated with MLPE (0.1-0.3 mg/ml) or statin (5 μM) for 24 h. To measure cellular neutral lipid accumulation using Oil red staining and Nile red staining. HepG2 cells were incubated at 2.4×10⁶ cells/well. Representative fluorescent photomicrographs are shown (× 100). (C) Quantification of intracellular fat content with flow cytometric analysis. The data were mean±SD from three samples for each group. #p < 0.05 in relation to the control. *p < 0.05 in relation to the OA-induced group. **p < 0.001 in relation to the OA-induced group. C, control; E, ethanol; S, statin
Figure 6. Effect MLE and MLPE on the expression of TG synthesis related
590 591 592 593 594 595 596 597 598 599 600 601 602 603 604 605 606 607 608 609
proteins. (A) Cultured cells were induced lipid accumulation with OA for 24 h and
treated with MLE (1, 2, 3 mg/ml) and (B) MLPE (0.1, 0.2, 0.3 mg/ml). Protein expressions were detected by Western blot analysis. Actin was used as a control. C, control; E, ethanol. Quantification of FAS, p-ACC/ACC and SREBP1 was depicted means±SD from three samples for each group. ##p < 0.001 in relation to the E control. *p < 0.05 in relation to OA-induced group. **p < 0.001 in relation to the OA-induced group. C, control; E, ethanol.
Figure 7. Effect MLE and MLPE on the expression of cholestrol synthesis related proteins. (A) Cultured cells were induced lipid accumulation with OA for 24
h and treated with MLE (1, 2, 3 mg/ml) and (B) MLPE (0.1, 0.2, 0.3 mg/ml). Protein expressions were detected by Western blot analysis. Actin was used as a control. C, control; E, ethanol. Quantification of HMGCR, LDLR and SREBP2 was depicted means±SD from three samples for each group. ##p < 0.001 in relation to the E control. *p < 0.05 in relation to OA-induced group. **p < 0.001 in relation to the OA-induced group. C, control; E, ethanol.
Figure 8. Effect MLE and MLPE on the phosphorylation of AMPK and expression of lipogenic enzymes. (A) Cultured cells were induced lipid accumulation
with OA for 24 h and treated with MLE (1, 2, 3 mg/ml) and (B) MLPE (0.1, 0.2, 0.3 610 611 612 613 614 615 616 617 618 619 620 621 622 623 624 625 626 627 628 629
mg/m). (C) Cells were induced lipid accumulation with OA for 24 h and were treated with MLE (3 mg/ml), MLPE (0.3 mg/ml) and statin (5 μM). Actin was used as a control. AMPK phosphorylation (pThr172-AMPK), FAS, HMGCR, and LDLR were detected by Western blot analysis. Quantification of p-AMPK/AMPK and proteins were depicted means±SD from three samples for each group. ##p < 0.001 in relation to the E control. *p < 0.05 in relation to the OA-induced group. **p < 0.001 in relation to the OA-induced group. C, control; E, ethanol; S, statin.
630 631 632 633 634 635 636 637 638 639 640 641 642 643 644 645 646 647 648 649 650 651 652 653 654 655 656 657 658
Table 1 Composition of MLE (mulberry leaf extract)
MLE %
Polyphenolic component
Gallic acid (as standard) 21.16 Rutin ( as standard) 26.6
Polysaccharide 25.0
Protein 2.37
Lipid 8.40
Table 2 HPLC chromatograms assay
Content of phenolic compounds in MLE Phenolic acid MLE (%) RTa
(min)
Flavonoids MLE (%) RTa (min)
Gallic acid 7.6 7.9 Catechin 1.2 21.7
Protocatechuic acid (PCA)
4.7 15.3 Gallocatechin
Gallate (GCG)
5.9 24.8
Caffeic acid 1.0 27.4 Epicatechin 0.8 29.3
Rutin 1.9 38.4 Quercetin 1.2 56.9 Naringenin 2.7 60.5 a RT as retantion time 659 660 661 662 663 664 665 666
Figure 1 667 668 669 670 671 672 673 674 675 676 677 678 679 680 681 682 683 684 685 686 687 688 689 690 691 692 693 694 695 696
Figure 2 Oleic acid (mM) C E 0.0 0.1 0.2 0.5 1.0 1.5 2.0 2.5 3.0 3.5 C el l V ia bi li ty ( % ) 0 20 40 60 80 100 120 Oleic acid (mM) C 0.5 0.6 0.7 0.8 0.9 C el l V ia bi li ty ( % ) 0 20 40 60 80 100 120 140 MLPE (mg/ml) C E 0.1 0.2 0.3 0.4 0.5 0.6 C el l V ia bi li ty ( % ) 0 20 40 60 80 100 120 140 IC50= 0.417 (mg/ml) D MLE (mg/ml) C 2 4 6 8 10 12 C el l V ia bi li ty ( % ) 0 20 40 60 80 100 120 140 IC 50 = 8.29 (mg/ml) C A B 697 698 700 701 702 703 704 705 706 707 708 709 710 711