ELSEVIER PII: S0032-3861 (97) 10018-0
Printed in Great Britain. All righls reserved (X)32-3861/98/$19.00-¢q).(1()
Sequential distribution of copolyesters
containing the phosphorus linking pendant
groups characterized by 1H-n.m.r.
Shinn-Jen Chang and Feng-Chih Chang*
Institute of Applied Chemistry, National Chiao-Tung University, Hsinchu, Taiwan, ROC
(Received 28 October 1996; revised 25 December 1996; accepted 8 August 1997)
A series of phosphorus-containing copolyesters were synthesized by polycondensation of terephthalic acid (TPA), ethylene glycol (EG) and 9•••-dihydr•-••-[2•3-di(hydr•xycarb•ny•)pr•py•]-9-•xa-••-ph•sphaphenanthrene-l•-
oxide (DDP). Chemical structures of these phosphorus-containing copolyesters were characterized by ~H-n.m.r.. Experimental results show that these methylene protons of the ethylene glycol unit resonate at lower field than those of the DDP aliphatic protons. The resonance intensity of DDP aliphatic protons increases with the increase of the phosphorus content. The tH-n.m.r, spectrum of the DDP aliphatic protons contain three peaks since the proton in H - C - P has greater coupling constant than that of H-C-C. The chemical shifts of these methylene protons in the ethylene glycol unit vary with different sequences. The methylene protons in the ethylene glycol of the T - E - T unit resonate at lower field than those of P - E - T ( T - E - P ) and P - E - P units. The monomer molar traction, sequential distribution and degree of randomness of the phosphorus-containing copolyester were determined through analyses of the resonances of methylene protons in the ethylene glycol unit. The molar fractions of the DDP comonomer determined by n.m.r, analyses are close to the charged values in synthetic step and the values determined by an UV method. Moreover, the copolyesters were found to be as random copolymers with a degree of randomness equal to about 1. © 1998 Elsevier Science Ltd. All rights reserved.
(Keywords: ~H-n.m.r.; phosphorus-containing copolyester; sequential distribution)
INTRODUCTION
In recent years, emphasis has been placed on the necessity for various flame-retardant products, and much effort has been directed to this purpose. Phosphorus-containing flame retardants have been developed to replace the conventional halogen-containing flame retardants to meet the require- ments of low smoke and low toxicity in view of environmental protection and public security. As the flame retardants are chemically bonded to the polymeric main chains 1-3, they will not migrate to the surfaces of polymers during processing, such as extrusion, injection moulding or spinning, and thus the flame retarding effect and physical properties are not affected.
The flame retardant effect of the phosphorus containing 4 6 polymer was proposed via a solid-phase mechanism - . The correlation of the phosphorus content with their flame retardancy has been studied 4'7"s. The phosphorus content of a phosphorus-containing polymer is usually determined by the UV method 9. The chemical structure of a phosphorus- containing copolymer is also known to affect the flame retardancy H,- ~3.
The chemical structure of a copolymer as random, alternative, or block copolymer is an important factor in determining its final properties (comprising flame retardancy). For a copolyester, nuclear magnetic resonance spectroscopy (n.m.r.) is a powerful technique for qualitative and quantitative analyses of its chemical structure |4-2s. Yamadera and Murano ~4 showed that the degrees of randomness of some copolyesters can be determined by n.m.r.. These analyses can be effective if the resonance
* T o w h o m corresptmdence should be addressed
signals of the given proton(s) or carbon(s) with different sequences have different chemical shifts. It has also been shown that the aromatic protons of the terephthalate unit of copolyesters with different aromatic and aliphatic diol sequences have different resonance signals ~5-~7. The resonance signals of carbons of the aromatic carbons of the terephthalic acid, aliphatic carbons of the ethylene glycol and 1,4-butanediol were tbund to give a quartet Is. Additionally, the resonance signals from the proton(s) or carbon(s) of the glycol unit of copolyesters with different diacid sequences also result in different chemical shifts and thus the sequential distributions can be determined L4.I9-2s. In this paper, the phosphorus-containing copolyesters
of various phosphorus contents, poly(ethylene
terephthalate)-co-poly(ethylene DDP)s (PET-co-PEDDP)s,
were synthesized by the polycondensation of terephthalic
acid, ethylene glycol and phosphorus-containing
comonomer (9,10-dihydro- 10- [2,3-di(hydroxycarbonyl)-
propyl]-9-oxa-10-phosphaphenanthrene-10-oxide, herein- after referred to as DDP). We attempt to analyze the sequential distribution and the phosphorus content of these phosphorus-containing copolyesters by using the proton nuclear magnetic resonance since the use of the ~H-n.m.r. method has the advantages of small sample size, fastness and non-destructiveness.
EXPERIMENTAL
Terephthalic acid (TPA) and ethylene glycol (EG) were obtained from Tuntex Distinct Corp., Taiwan. 9,10-dihydro- 9-oxa-10-phosphaphenanthrere- 10-oxide (DOP) and itaconic acid were purchased from the Sanko Ltd., Japan. Tetrabutyl orthotitanate was purchased from Merck Schuchardt Ltd.
DDP (phosphorus-containing comonomer) was prepared by an addition reaction of DOP with itaconic acid 29.
The phosphorus-containing copolyesters of various phosphorus contents, ranging from 0.5 to 4.0 wt%, were synthesized through co-condensation of DDP with TPA and EG catalyzed by tetrabutyl orthotitanate. The preparation was made according to a method previously described by
Chang et al.~° (as shown in Scheme 1). The copolyester with Table 1 phosphorus content of 0.5 wt% is denoted as P05, 0.7 wt% Sequence is denoted as P07 and so on. The intrinsic viscosity at 30°C
in phenol/l,l,2,2-tetrachloroethane (60/40 wt/wt) of each PET" copolyester was slightly greater than 0.60 dl/g.
1H-n.m.r. spectra of copolyesters in CF3COOD were carried out by a Bruker Am 400 n.m.r, by using tetramethylsilane (TMS) as an internal standard. The UV
method 9 was employed to determine the phosphorus content p40 ~, of the copolyester.
RESULTS A N D DISCUSSION
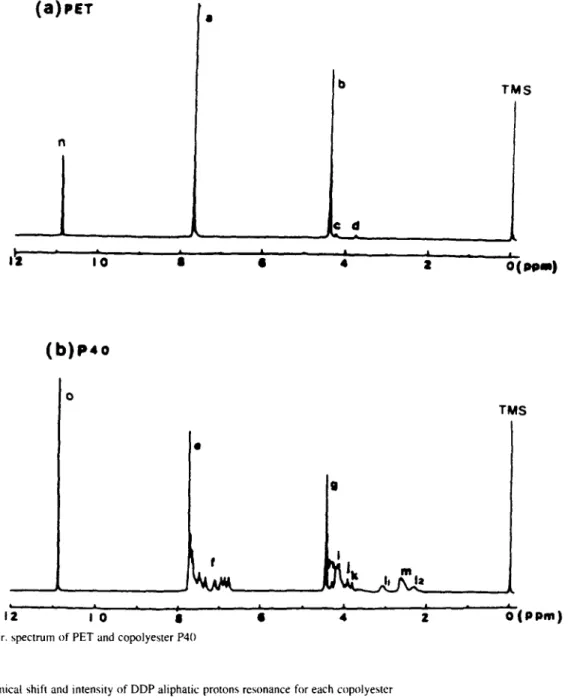
Proton n.m.r, spectra of PET and PET-co-PEDDP P40 (copolyester with phosphorus content of 4.0 wt%) are shown in Figure la,b. The chemical structure and resonance p e g assignments are shown in Scheme 2 and Scheme 3 and
Table 1. The chemical shifts for aliphatic and aromatic protons are in the ranges of 2.0-5.0 and 6 . 5 - 8 . 0 ppm, respectively.
The chemical shifts of aliphatic protons for the methylene protons of the ethylene glycol unit is 3.3 to 5.0 ppm and that for the DDP aliphatic protons is 2.0 to 3.2 ppm as shown in
Figure lb. The inductive effect of the oxygen causes the shifting farther downfield with increasing electronegativity.
Assignments of resonance peaks of PET and copolyesters P40
Proton Chemical shi~
(ppm) a 7.79 b 4.48 c 4.34 d 3.86 n' 10.91 e 7.79 f 7.53-6.81 g 4.48 h 4.34 i 4.25-4.17 j 3.97 k 3.86 1 (/~,/:) 3.12, 2.34 m 2.63-2.71 o' 10.91
"PET is poly (ethylene terephthalate)
h P40 is phosphorus-containing copolyester with phosphorus-content of 4.0 wt%
'n and o are the solvent peak of CF~COOI)
0 0
I
I
H O - - C - ~ - - C - - O HT P A
q- H O -- CHz -- CH: -- O H -.]-E G
0 0I
I
I"[O-- C - - C H ~ C ~ - - C-- OHI
CH2I
O ~ P - - OD D P
Ti(OBu) 4 esterification at 230 °C II mr polycondensation at 275 °C (3 0 0 O I ~ - ~ I I I H O - e C ~ C ~ O C H ~ C H 2 0 - ~ - C -- C H - - C H z - - C -- O C H : -- CH~ O--~--m H I CHz I O ~ P ~ O PET-co-PEDDPScheme 1 The preparation of PET-co-PEDDP polymer.
( a ) P E T . A I'z ,o d TMS • - & ,,IL • , I
i
,
~
z o1~,,,1 ( b ) P 4 O F i g u r e ! f 1 2 ' I A o * a J *IH-n.m.r. spectrum of PET and copolyester P40
TMS
I i
- | m
• & , I -
• 4 z o ( p p m )
Table 2 The chemical shift and intensity of DDP aliphatic protons resonance for each copolyester Intensity at Ii m 12 Sample 3.12 (ppm) 2.63-2.71 (ppm) 2.34 (ppm) l / m " m + 1 ~ + I~ P05 0.054 0.181 0.051 0.580 . . . 0.286 P07 0.057 0.189 0.055 0.593 0.301 P 10 0.045 0.134 0.044 0.664 0.223 P20 0.157 0.513 0.159 0.616 0.829 P30 0.180 0.555 0.184 0.656 0.919 P40 0.286 0.862 0.298 0.677 1.446
"1 = (11 + 12). lira is the resonance intensity ratio of protons I to protons m ~m + /, + /2 is the total resonance intensity of DDP aliphatie protons
Thus, the methylene protons (g, h, i, j, k) in Figure lb
resonate at lower field than those of the DDP aliphatic protons (m and I). The expanded n.m.r, spectra from 2.0 to 3.2 ppm and 3.3 to 5.0 ppm of various copolyesters are shown in Figures 2 and 3. Figure 2 shows that the
intensities of the DDP aliphatic proton resonances increase with the increase of the phosphorus content due to higher DDP molar fraction. Thus, the resonance intensities can be used to quantify the DDP molar fraction in a copolyester.
Tables 2 and 3 list the proton resonance intensities and peak
assignments of DDP aliphatic protons and methylene protons of the ethylene glycol unit. Table 2 reveals that
the DDP aliphatic protons resonances give three peaks and their relative intensities at chemical shifts of 3.12, 2.63-2.71, and 2.34 ppm are approximately 1:3:1 for each copolyester. Considering the chemical structure in Scheme 3
of a copolyester, the aliphatic protons of DDP should possess only m and l two peaks. However, the tH-n.m.r. spectra shown in Figure 2 give three peaks because the
proton in H - C - P has greater coupling constant than that of
P E T II O H H O CH~ ---(- C C - - O - - CH2 --CH: --O-~n C ~ C - - O - - CH, - - - - O - - H H H H H P E T - C O - P E D D P O
f
e e m o o ~ , _ ~ o oi R~_~ I
O h kI
I O-~1
-o4,-.,c ~--~C--O--C".--C~--OH
C - - O - - CH~ - - 0 ~ C C - - 0 - - CH~ - - CH2 - - ( ~ H - C1"I2 ~ - - CH2
/ \
/
H H H 11
Scheme 2 The sequences of PET-co-PEDDP polymer.
Figure 2
P 4 o
alo =is
(ppm)
P 3 O P Z o p I o P o T POS
Expanded n.m.r, spectra of copolyesters with chemical shifts ranging from 2.0 to 3.2 ppm
H - C - C . Thus, the resonance peak of P - C H 2 - C splits into two peaks at 3.12 (10 and 2.34 (12) ppm, and the total numbers of resonance peaks of aliphatic protons of DDP now become three. The resonance intensity ratios of protons l (13.12 + 12.34) to protons m (I2.63_2.71) are from 0.580 to 0.677
(about 2:3) as shown in Table 2 where,
1~ ~2 resonance intensity of ~H-n.m.r. at 3.12 ppm chemical shift; 123~ resonance intensity of ~H-n.m.r. at 2.34 ppm chemical shift; 1263_27~ resonance intensity of ~H-n.m.r. from 2.63 to 2.71 ppm
chemical shift.
The resonance intensity ratio of protons l to m shown in
Table 2 represents the proton number ratio of l to m shown
in Scheme 3.
By comparing with the resonance peaks of a PET, the resonance of the methylene protons in the ethylene glycol unit of the phosphorus-containing copolyester can be from four possible sequences as shown in Scheme 3. The resonance signals of methylene protons for the copolyester with TEgT, TE~P(PE,T) and PEjP sequences resonate at 4.48 (proton g), 4.25-4.17 (proton i) and 3.97 (proton j) ppm,
respectively. The fl-methylene proton (proton h) and a-^t\l proton (proton k) of the hydroxyl terminal unit ( T - E - O H ) in the ethylene glycol resonate at 4.34 and 3.86 ppm, respectively 31. The summarized data are listed in Table 1 where T is the terephthalate unit. E is the ethylene glycol unit and P is the DDP unit.
Figure 3 shows the resonance peaks of the methylene
protons in ethylene glycol unit of the phosphorus-containing copolyesters with chemical shift ranging from 3.3 to 5.0 ppm. The methylene protons of the T - E - T unit (protons) resonate at lower field than that of P - E - T ( T - E - P ) (protons i) and P - E - P units (protons j), since the electronegativity of the P unit is weaker than that of the T unit. The wider peak of proton i is given by two non-equivalent CH2 group protons of the EG units present in the T - E - P (and P - E - T ) hetro- triads; this is an unresolved muitiplet 32. The intensity of peak h is equal to peak k (lh ---- ID because the hydroxyl terminal unit of T - E - O H possesses both a- and
fl-methylene protons. The resonance intensities of
methylene protons of ethylene glycol unit of each sample are listed in Table 3. Comparisons of the resonance peaks of
T - E - T e g e O H H O O H H O
I ...~ I
I _~
I
- - C C - - O - - CH2 --CH2 - - O ~ C C - - O ~ H H H H P - E - T ( T - E - P ) o o i I m I - - C ~ C H - - C H 2 ~ C - - O - - C H 2 - - C H 2 - - O II Ctt~
f P - E - P e O H H O [ [C-~C--O--
H Hm
Ol
J
o/
m
C ~ C H ~ C H 2 - - C - - O - - C H ~ - - C H 2 - - 0 ~ C ~ C H ~ C H = - - C ~ i I ] CH2 t f f T - E - O H Scheme 3 - - 0 ~ CH2 - - CH2 ~ O - - H H HThe sequences of PET-co-PEDDP polymer.
Table 3 The resonance intensities of methylene protons of ethylene glycol unit and molar fraction percent of DDP
Intensity of chemical shifts (%)
Sample t,, i j h k Xp (%)" P05 86.5 7.9 0 2.8 2.8 3.95 1:)07 80.4 8.4 0.1 5.5 5.5 4.30 PI0 76.4 13.9 0.3 4.7 4.7 7.25 P20 66.3 23.8 1.6 4. I 4.1 13.50 P30 51.9 30.3 4.8 6.5 6.5 19.95 P40 39.6 43.1 9. I 4. I 4.1 30.65
"Xp (%) is the molar fraction percent of DDP, Xp = ( I / 2 + I j ) / S × 1 0 0 % , where S is the total integrated intensities of resonance peaks of methylene protons of the ethylene glycol ( S = I~, + I i . / • i,. + 6,
Figure 3
P4o P3o P2O p I o
!
4.5 3.5
~ppm)
Expanded n.mr. spectra of copolycsters with chemical shifts ranging from 3.3 to 5.0 ppm
p o t
&
POS
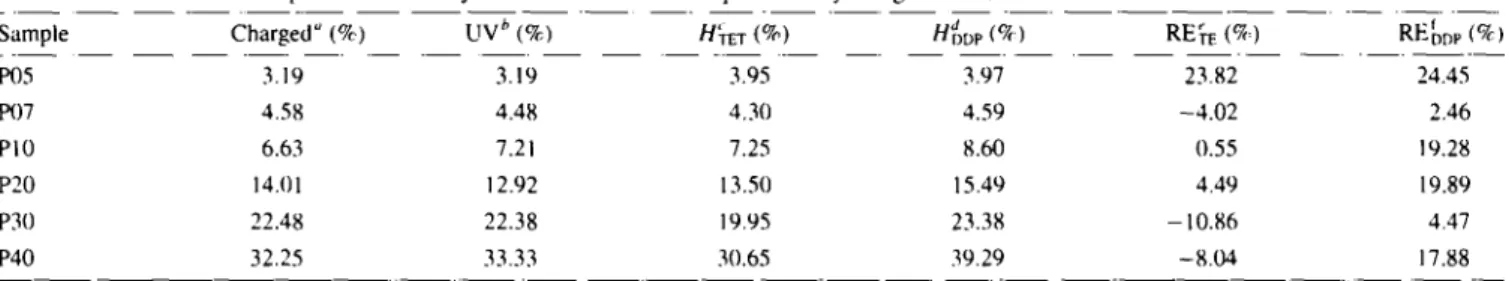
Table 4 The molar fraction percent of DDP by the ~H-n.m.r. method, experimentally charged value, UV methods, and relative error d
Sample Charged" (%) UV b (%) H~I~T (%) HDDP (oh:) R E ~ (%) RE[~Dp (%)
P05 3.19 3.19 3.95 3.97 23.82 24.45 1:'07 4.58 4.48 4.30 4.59 -4.02 2.46 PI0 6.63 7.21 7.25 8.60 0.55 19.28 P20 14.01 12.92 13.50 15.49 4.49 19.89 P30 22.48 22.38 19.95 23.38 - 10.86 4.47 P40 32.25 33.33 30.65 39.29 -8.04 17.88
"The charged value in the synthetic step ~' By UV method
' HTI~T is molar the fraction percent calculated by ~H-n.m.r. intensities of methylene protons of ethylene glycol unit method, Xp(%) = (/PET/2 + /~'E:t' + la~ou)l S x 100%
aHt) m, is the molar fraction percent calculated by ~H-n.m.r. intensities of aliphatic protons of DDP method, Xp(%) = IDDplS × 100% RE-n-q" is the relative error (ck) of Hrzr versus UV
/REt)DP is the relative error (%) of HDt)r, vers'us UV
the methylene protons from samples of P05, P07, PI0, P20, P30 and P40 reveal that the resonance intensity of proton g at 4.48 ppm decreases with the increase of the phosphorus content. Higher phosphorus content implies higher content of the P - E - T ( T - E - P ) and P - E - P units. Thus, the molar fractions of terephthalate (XT) and DDP (Xp) of a phosphorus-containing copolyester can be calculated from the intensities of the five peaks of the methylene protons,
xv
= (ITET +/TEP/2 + ITEOH)/S= (! x + l i / 2 + i h + l k ) / S
(I)
xp
= (IpET/2 +IpEp)/S
= ( U 2 + / j ) / s (2)
W h e r e ]TET (lg), ITE p (li) ( w h e r e [TEP -~' /PET), /PEP (I.i) a n d /TEOH (lh,ID represent the integrated intensities of methylene protons resonance signals of TET, TEP, PEP sequence and TEOH terminal unit, respectively. S is the total integrated intensities of the resonance peaks of methylene protons in
the ethylene glycol (comprising methylene protons of TET, TEP (PET), PEP sequences and or- and/3-methylene protons of T - E - O H ) . The summarized results are listed in
Table 3.
The molar fractions of terephthalate (XT) and DDP (Xo) can also be obtained from the total resonance intensities of aliphatic protons of DDP by the equations (3) and (4),
Xp = IDDp/S = (I I + Ira)IS (3)
XT = 1 -- Xp (4)
where IDI~p represents the integrated intensity of the DDP aliphatic protons (IDDP = 1~ + l m = / 3 . 1 2 + / 2 . 3 4 + 12.63-2.71). The molar fraction of DDP (Xp) and the results calculated by equation (3) are listed in Table 4. The DDP molar fraction of the phosphorus-containing copolyesters determined by the UV method and the charged value in the synthetic step are also listed in Table 4. The DDP molar fractions obtained from tH-n.m.r, analyses are fairly close to the charged values in synthetic step and values from the UV spectrum method. The use of the tH-n.m.r, method in calculating
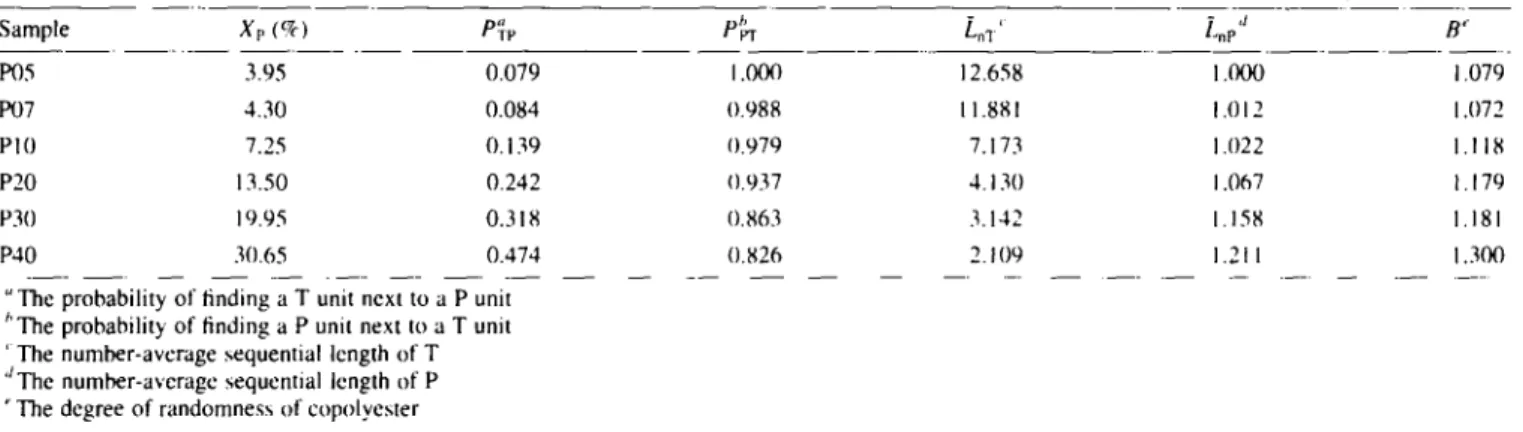
T a b l e 5 The molar fraction percent of DDP. number-average sequential length, and degree of randomness determined by )H-n.m.r. analyses Sample X r. ( % ) P"~ )' P~r Ln,I' L.p ,l B" P05 3.95 0.079 1.000 12.658 1.000 1.079 I:)07 4.30 0.084 0.988 I 1.881 1.012 1.072 PI0 7.25 0.139 0.979 7.173 1.022 1.118 P20 13.50 0.242 0.937 4.130 1.067 I. [ 79 P30 19.95 0.318 0.863 3.142 I. 158 I. 18 I P40 30.65 0.474 0.826 2.109 1.211 1.300
"The probability of finding a T unit next to a P unit ~'The probability of finding a P unit next to a T unit ' The number-average sequential length of T aThe number-average sequential length of P "The degree of randomness of copolyester
monomer molar fraction has the advantages of small sample size, fastness and non-destructiveness. Thus, the ~H-n.m.r. method is convenient to calculate the DDP molar fraction of the phosphorus-containing copolyester. By taking the DDP monomer molar fractions (HTET and HDDP, Table 4) obtained from ~H-n.m.r. method to fit a linear least fitted equation, the calculated values from the square multiple correlation coefficient are 0.998 and 0.996, respectively. These fittings based on ~H-n.m.r. intensities of the aliphatic protons are considered to be adequate for the linear least fitted equation because the square multiple correlation coefficients are all greater than 0.632 .
The relative errors of the column HTET versus column UV (i.e., the error of comonomer molar fraction calculated from rH-n.m.r, method by equation (2) relative to that of the UV experimental method) and column Hoop versus column UV (i.e., the error of comonomer molar fraction calculated from IH-n.m.r, method by equation (3) relative to that of the UV method) are listed in Table 4. These results reveal that ~H-n.m.r. is an adequate method to analyze monomer molar fraction of a phosphorus-containing copolyester due to relatively smaller error. The relative error of sample P05 are relatively higher because the small S/N ratio which is not unexpected.
By taking ethylene glycol unit as a reference point, the probability of finding a P unit next to a T untt xs-
PI"P = ITEp/(ITEp 4-/rET 4-/TEOII) ( 5 ) Similarly, the probability of finding a T unit next to a P unit can be calculated by the following equation.
PPT ---- IPEI"I(IPET 4-/PEP) (6) The PTP and PPT of phosphorus-containing copolyesters are summarized in Table 5. The probability of P unit next to a T unit for sample P40 is substantially higher than sample P05 because the former has significantly higher DDP molar fraction than the latter• Copolyester containing higher phosphorus content implies greater probability of finding a P unit next to a T unit•
The number-average sequential length of the T (L, T) and P (L,p) units are calculated by the lollowing equations
L..) = 1/PTp (7)
L.T
= I/PpT (8)The average sequential lengths of phosphorus-containing copolyesters are summarized in Table 5. The sample P40 has lower sequential length of the T unit than that of the sample of P05 because the former has higher phosphorus content than the latter.
The degree of randomness is defined by )4
B = PTP 4- P m (9)
For a total randomness of a copolymer, B is equal to 1. For an alternative copolymer, B is equal to 2 and a block copolymer, B is close to zero.
Table 5 lists the degrees of randomness of the ~HhOSphorus-containing copolyesters determined by
-n.m.r. analyses• The difference in monomer reactivity may be significant in the melt polycondensation, however, the transesterification reaction renders random distribution of various sequences of copolyesters. The degrees of randomness of these phosphorus-containing copolyesters are close to I as shown in Table 5. Therefore, these copolyesters are random or nearly random with uniform phosphorus distribution in the polymer chain.
CONCLUSIONS
A series of phosphorus-containing copolyesters have been characterized using a 4 0 0 M H z ~H-n.m.r.. Methylene protons of ethylene glycol unit resonate at a lower field than that of the DDP aliphatic protons• The resonance intensity of the DDP aliphatic protons increase with the
- I
mcrease of the DDP content. H-n.m.r. spectra of the DDP aliphatic protons possess three peaks because the proton in H - C - P has greater coupling constant than that of H - C - C . The chemical shifts of methylene protons of ethylene glycol unit vary with different sequence• The chemical shift of the methylene protons in the ethylene glycol of the T - E - T unit is higher than those of P - E - T ( T - E - P ) and P - E - P units. Molar fractions of phosphorus-containing comonomer (DDP), their sequential distributions and degrees of randomness were determined through analyses of the corresponding multiplet of the methylene protons in ethylene glycol unit. Molar fractions of the DDP comonomer obtained from ~H-n.m.r. analyses are close to the experi- mentally charged values in synthetic step and the values determined by the UV method• These copolyesters are random or nearly copolymers with degree of randomness equal to about I.
REFERENCES
1. Kleiner. H. J., Finke. M., Bollert. U. and Herwig. W., U.S. Pat..
1976, 3(941 ), 752.
2. Bollert. U.. Lohmar. E. and Ohorodnik, A., U.S. Pat.. 1977, 4(033),
936.
3. lsota. H.. Nakamura, M. and Sawahara, K.. Jap. Pat., 1992.92(281 ).
016.
4. Hilado. C. J.. Hame Retardants. Technomic, Westpor, Conn., 1973,
p . I .
5. Bank. M., Ebdon, J. R. and Johnson, M., Polymer. 1994.34, 4547. 6. Cullis, C. F. and Hirschler, M. M., The Cumbustion o f Organic
Polymer,~, Clarendon Press, Oxford, 1981. p. 241.
7. Yang, C. P. and Wang, S. S., J. Polym. Sci. A, 1989, 27, 3351. 8. Sato, M., Kondo. M. and Yokoyama. M.. J. Appl. Polym. Sci., 1984,
29. 299.
9. Tomson, M. B., Baronc. J. P. and Nancolla,s, G. H., Atomic. Abs. Newslett.. 1977, 16, 117.
10. Nair, C. P. R., Clouet, G. and Guilben, Y., Polym. Degrad. Stab., 1989, 26. 305.
1 I. Krevclen, D. W., Polymer, 1975, 16. 615.
12. Liu, Y. L., Hsine, G. H., Chiu, Y. S., Jeng, R. J. and Ma. C., J. Appl. Polym. Sci., 1996. 59, 1619.
13. Camino, G., Greassie, N. and Mcneill, I. C , J. Polym. Sci. Polym. (7zero., 1978, 16, 95.
14. Yamadera, R. and Murano, M., J. Polynz. Sci. A. 1967, 1(5), 2259. 15. Hamb, F. L. J., Polym. Sei. Polym. Chem. I-d., 1972. 10, 3217. 16. Gouinlock, E. V., Wolfe, R. A. and Rosenfeld, J. C. J., App/. Polym.
Sci., 1976, 20, 949.
17. Devaux, J., Godard, P., Mercier, J. P., Touillaux, R. and Dereppe. J. M., J. Polym. Sci. Polym. Phys. Ed., 1982, 20, 188 I.
18. Newmark, R. A.. J. Polym. Sci. Polym. Chem. kid., 1980. 18, 559. 19. Khramova, T. S., Urman, Y. G., Avdeveva, G. M., Sedov, I+. N. and
Slonim, I. Y., VvsokomoL Soyed. A. 1973, 15, 148.
20. Urman, Y. G., Alekseyeva, S. G. and Slonim, 1. Y., Vysokomo/. Soyed. A, 1977, 19, 299.
21. Krichedorf, H. R., Makromol. Chem., 1978, 179, 2133.
22. l+enz, R. W. and Schular, A. N., J. Polym. Sci. Polym. Syrup., 1978, 63, 343.
23. Andreis, M., Meic. Z. and Veksli, Z., Polymer, 1983, 24, 611. 24. Andreis, M., Veksli, Z. and Meic, Z., Polymer, 1985, 26, 1099. 25. Chen, M. S., Chang, S. J.. Chang, R. S., Kuo. W. F. and Tsai, H. B.,
J. Appl. Polym. Sei.. 1990, 40, 1053.
26. Huang. J.. Guan, G.. Sun, T. and Chen, H., Gaofezi Xuebao, 1992.5. 538.
27. Cheng, C. C., J. Chin. Inst. Chem. Eng., 1992, 23(2), 139. 28. Higashiyzmz, A.. Yamamoto, Y., Chujo, R. and Wu, M., Polym. J.
(Tokyo). 1992, 24(12), 1345.
29. t-ndo, S., Kashihata, K., Osako, A., Shizuki, T. and Ikegami, 1"., U.S. Pat.. 1978, 4(590), 127.
30. Chang, S. J., Sheen, Y. C., Chang, R. S. and Chang, F. C., Polym Degrad. Stab., 1996, 54, 365.
31. The Sodtler Standard Spectra, Sadder Research Laboratories, No. 2461, 1969.
32. Jurs. P. C., Computer SoJgvare Application in Chemisto', John Wiley and Sons, Inc., New York, 1986.
33. Davaux, J.. Godard, P. and Mercier, J. P.. J. Polym. Sci. Polwn. Phys. Ed., 1982, 20, 1875.