DOI: 10.1002/adfm.200500354
Thiophenol-Modified CdS Nanoparticles Enhance the
Luminescence of Benzoxyl Dendron-Substituted Polyfluorene
Copolymers**
By Chia-Hung Chou, Hsu-Shen Wang, Kung-Hwa Wei,* and Jung Y. Huang
1. Introduction
Conjugated aromatic polymers have attracted a considerable amount of interest over the past few decades because their semiconducting and electroactive properties allow them to be used in a diverse range of applications, such as batteries, elec-tronic devices, and light-emitting diodes. In particular, the de-velopment of blue-light-emitting polymers remains critical to the fabrication of full-color organic displays. Polyfluorene[1–3] layers have emerged as potential sources of blue light for light-emitting diodes because of their relatively high photo-luminescence (PL) efficiencies.[4]Indeed, their photo- and ther-mostabilities are better than those of poly(phenylene vinylene) derivatives.[5–9]Although these polymers exhibit relatively high PL quantum efficiencies and good thermal stabilities, their de-vice applications are hampered by their tendency to form ag-gregates in the solid state. Moreover, most organic chromo-phores, such as those in polymers, quench to different degrees at various concentrations in the solid state, and this phenome-non leads to broad emission bands and losses in efficiency and purity of color. Attempts at improving the luminescence effi-ciency of polymers have followed two approaches: the steric
hindrance approach and the electronic approach. The steric hindrance approach involves altering the interchain distance between polymers by attaching bulky side groups—e.g., den-dritic structures—to the main chain of the polymer; such modifications prevent aggregate formation or concentration quenching. The luminescence efficiencies in these copolymers have been improved in several cases, but this phenomenon oc-curs in conjunction with a decrease in the molecular weight of the polymers, owing to synthetic yield constraints. The electron-ic approach involves incorporating materials possessing higher quantum yields into luminescent polymers.[10a] For example, one method combines conjugated organic polymers with wide-bandgap-semiconductor nanoparticles.[10b]Several reports have described the energy levels and electron-transport properties of these polymer/nanoparticle nanocomposites;[11–15] complex phenomena can appear as a result of the sensitivity of the sur-face ligands and the sizes of the bandgaps in the nanoparticles. For instance, the PL of poly[2-methoxy-5-(ethylhexyloxy)-1,4-phenylene vinylene] (MEH-PPV) can be quenched when nano-particles are present at a higher concentration, or energy can be transferred from the polymer to the nanoparticles.[16–18]To the best of our knowledge, however, no one has reported that poly-mer luminance can be improved by the presence of CdS nano-particles—possibly because the interactions between these nanoparticles and the polymer segments had not been designed properly, or because high concentrations of nanoparticles in a polymer can lead to quenching effects caused by offset band edges between the polymer and the nanoparticles.
Herein, we propose a new approach to improving polymer luminescence by attaching dendritic structures to polyfluorene (dendritic copolyfluorene) and then incorporating a low per-centage of surface-modified semiconductor nanoparticles into the polymer.[19,20] Dendritic copolyfluorene[21] contains multi-ple functional groups that increase both the solubility of the polymer and the number of its interaction sites. By tailoring the interface between the ligands on the nanoparticles and the dendritic structures, a small percentage of the surface-modified
–
[*] Prof. K.-H. Wei, C.-H. Chou, H.-S. Wang Department of Materials Science and Engineering National Chiao Tung University
1001 Ta Hsueh Road, Hsinchu 30050 (Taiwan) E-mail: khwei@cc.nctu.edu.tw
Prof. J. Y. Huang
Department of Electro-Optical Engineering National Chiao Tung University
1001 Ta Hsueh Road, Hsinchu 30050 (Taiwan)
[**] We thank Chunghwa Picture Tubes, Ltd., and the National Science Council, Taiwan, for funding this study (NSC 91-2120-M-009-001). We are grateful to Prof. Ching-Fong Shu, Siao-Wei Yeh, and Mao-Yuan Chiu for their experimental assistance and helpful discussions. Supporting Information is available online from Wiley InterScience or from the author.
Highly luminescent dendron-substituted copolyfluorenes that incorporate surface-modified cadmium sulfide nanoparticles have been prepared. A small percentage of these nanoparticles can be incorporated into the dendritic structures upon tailoring the interfaces between the ligands on the nanoparticles and the dendritic structures in the copolyfluorene. Both the photolumi-nescence and electrolumiphotolumi-nescence efficiencies of the polymer nanocomposites are dramatically enhanced—sometimes more than doubled—relative to the values of the pure polymer.
P
cadmium sulfide nanoparticles can be incorporated into the polymer. We have investigated the effect that the addition of these nanoparticles has on the polymer’s PL and electrolumi-nescence (EL) efficiencies.
2. Results and Discussion
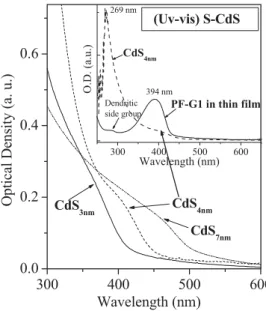
Figure 1 displays the UV-vis absorption spectra of three differently sized thiophenol-modified CdS (S-CdS; the surface ligands on the CdS nanoparticles are thiophenol units) nanopar-ticles in dimethylformamide (DMF). The sharp absorption peak at k = 269 nm is due to the benzene ring in the thiophenol, and
the broad absorption peaks at k = 360, 410, and 460 nm arise from CdS nanoparticles with diameters of 3, 4, and 7 nm, re-spectively. The maximum PL peaks of the S-CdS3 nm, S-CdS4 nm,
and S-CdS7 nmnanoparticles in DMF (Fig. 2b) occurred at 546,
590, and 655 nm, respectively, when these solutions were ex-cited separately with light at kexe= 360, 410, and 460 nm,
respec-tively. The small peaks at k = 480, 519, and 604 nm, for S-CdS3 nm, S-CdS4 nm, and S-CdS7 nm, respectively, originate
from defects on the surfaces of the CdS nanoparticles.
Figure 2a presents the PL spectra of PF (polyfluorene), PF-G0, PF-G1, and PF-G2 (the copolymers are named PF-GX, where X represents the number of generations of the dendron; X = 0,1,2) recorded in tetrahydrofuran (THF). The maximum PL peak of PF-G1, excited at kexe= 394 nm, is located at k = 425 nm; the two additional peaks at k = 454 and 486 nm are due to vibronic progression of C苷C bond stretching. PF, PF-G0, and PF-G1 have nearly equal PL intensities, which indi-cates that their fluorophores are well-separated in solution. In comparison, the signal for PF-G2 has about twice the PL
inten-sity, which reflects the larger transition moment arising from the effect of higher conjugation in this dendritic structure.
To understand the photophysics of PF-G1 more fully, we in-vestigated films of pure PF-G1 and PF-G1 incorporated with the variously sized S-CdS nanoparticles. We excited the sam-ples using a broadband (Dk = 10 nm) xenon lamp with a central wavelength of 394 nm and a narrow-band GaN diode laser. Figure 2b displays the results of this study. We observed clear vibronic features at 425, 445, 472, 508, 544, and 598 nm for all of the PF-G1 films. In particular, the first three of these vibron-ic peaks overlap with the 1se–1shexciton absorption peaks of
S-CdS4 nm and S-CdS7 nm quantum dots. Hence, it appears
that the only energy transfer possible in this case is from PF-G1 to the CdS nanoparticles, but this situation requires further confirmation.[22]In addition, the broad absorption features of
the S-CdS quantum dots that appear below 400 nm may also improve the photon-absorption efficiency of the composite films.
300
400
500
600
0.0
0.2
0.4
0.6
300 400 500 600 CdS4nm PF-G1 in thin film 394 nm 269 nm Dendritic side group O .D . (a.u .) Wavelength (nm) CdS7nm CdS4nm CdS 3nmOp
ti
ca
l Den
si
ty
(
a.
u
.)
Wavelength (nm)
(Uv-vis) S-CdSFigure 1. Normalized UV-vis absorption spectra recorded in DMF for
S-CdS nanoparticles with three different diameters. The inset shows the absorption spectrum of PF-GI (a second-generation polyfluorene dendron) for comparison. 400 450 500 550 600 650 700 750 800 iii ii i ii. by GaN i. iii. by Xenon CdS7nm CdS4nm CdS3nm PF-G1 In ten sity ( a.u .) Wavelength (nm) 400 450 500 550 600 650 0.0 0.2 0.4 0.6 0.8 1.0 iv i iii ii In ten si ty ( a. u .) Wavelength (nm) i PF ii PF-G0 iii PF-G1 iv PF-G2 (a) (b)
Figure 2. a) PL spectra of PF [poly(2,7-substituted-9,9-dioctylfluorene)],
ex-cited by a xenon lamp at kmax= 394 nm, and PF-G0, PF-G1, and PF-G2, all
recorded in THF at the same concentration (5 × 10⁻⁶M). b) PL spectra
re-corded in DMF of i) PF-G1 in the solid state, using a xenon lamp as the ex-citation light source, ii) PF-G1 in the solid state, using a GaN diode laser, and iii) S-CdS nanoparticles with three different diameters.
FULL
P
Figure 3 displays the PL spectra of PF-G1 thin films contain-ing different-sized S-CdS nanoparticles. We controlled the thicknesses of these films to within 53–56 nm, as measured using an a-step instrument. When excited using a xenon lamp at 394 nm, the main PL peaks for these nanocomposites were located at the same wavelength as that of pure PF-G1, but the
intensities of these peaks were dramatically affected by the amount and size of the incorporated S-CdS. For instance, in Figure 3a, we observe that when 4 wt.- % of S-CdS3 nm
nano-particles were added to PF-G1, the intensity of the PL peak at
425 nm increased by more than 2.5 times relative to that of pure PF-G1. This effect becomes more pronounced as the size of the CdS nanoparticles increases, as illustrated in Fig-ures 3b,c. The intensities of the peaks at 425 nm of the PF-G1 thin films incorporating 4 and 7 nm diameter CdS nanoparti-cles increased by 3.1 and 3.4 times, respectively, relative to that of pure PF-G1. We did not observe any peaks between 500 and 700 nm for S-CdS nanoparticles present in PF-G1, presumably owing to the low S-CdS concentration used. The intensity of the PL peak at 425 nm in 4 wt.- % S-CdS7 nm/PF-G2 was more
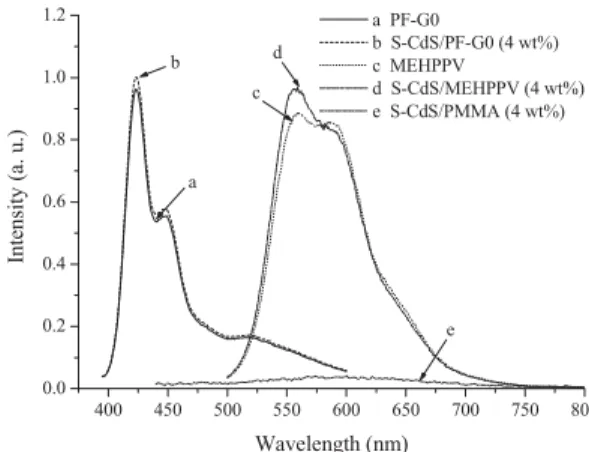
than three times that of pure PF-G2, with no appearance of the CdS PL peak (see the Supporting Information). To understand this behavior fully, we performed two control experiments. The first considered the light emission of the S-CdS nanoparticles; the second was concerned with whether other luminescent polymers lacking dendritic structures behave in a similar man-ner. Figure 4 illustrates that no detectable PL peaks appeared when the same amount (4 wt.- %) of S-CdS was present in opti-cally inactive poly(methylmethacrylate) (PMMA). Moreover, the addition of the same amount of S-CdS nanoparticles into PF-G0 and MEH-PPV did not substantially change the
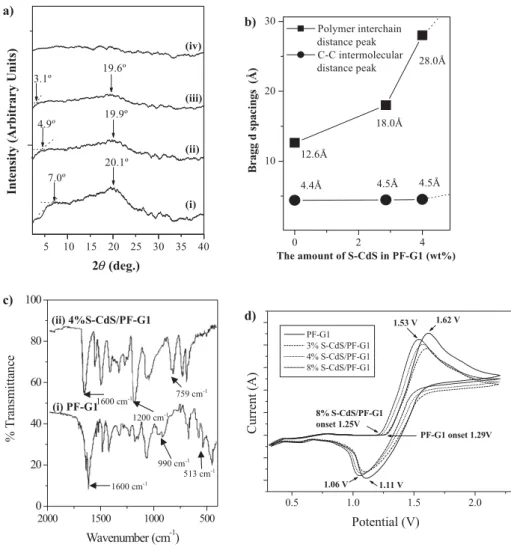
intensi-ties or locations of the PL peaks of these polymers. This finding indicates that the CdS nanoparticles themselves emit relatively weak light in the nanocomposites, if at all. More interesting is the role that CdS plays in the PL enhancement of the dendritic polymers. There are two possible mechanisms through which CdS nanoparticles enhance the PL of copolyfluorene, i.e., through steric hindrance or through electronic phenomena. The first of these mechanisms proposes that an increase in the interpolymer chain distance in the nanocomposites leads to a decrease in dimer formation. In the pure PF-G1 polymer, di-mers form as a result of the close proximity of polymer chains when they are excited. The interpolymer chain distances in the S-CdS/PF-GX (X = 1,2) nanocomposites increase upon incor-poration of the S-CdS nanoparticles into the dendritic poly-mers. Figure 5a shows X-ray diffraction spectra of S-CdS/PF-G1 obtained by subtracting the glass substrate background
350 400 450 500 550 600 650 0.0 0.5 1.0 1.5 2.0 2.5 3.0 3.5 4.0 Inte nsit y ( a.u. ) PF-G1 PF-G1/CdS(3 nm) (3%) PF-G1/CdS(3 nm) (4%) 350 400 450 500 550 600 650 0.0 0.5 1.0 1.5 2.0 2.5 3.0 3.5 4.0 Inte ns it y (a . u. ) PF-G1 PF-G1/CdS(4 nm) (3%) PF-G1/CdS(4 nm) (4%) (b) (a) 350 400 450 500 550 600 650 0.0 0.5 1.0 1.5 2.0 2.5 3.0 3.5 4.0 In te ns it y (a .u.) Wavelength (nm) PFG1 PFG1/CdS(7 nm) (3%) PFG1/CdS(7 nm) (4%) (c)
Figure 3. PL spectra of thin films of a) S-CdS3 nm/PF-G1, b) S-CdS4 nm
/PF-G1, and c) S-CdS7 nm/PF-G1, normalized with respect to the PL intensity
of PF-G1. 400 450 500 550 600 650 700 750 800 0.0 0.2 0.4 0.6 0.8 1.0 1.2 e d c b a In tensity ( a. u.) Wavelength (nm) a PF-G0 b S-CdS/PF-G0 (4 wt%) c MEHPPV d S-CdS/MEHPPV (4 wt%) e S-CdS/PMMA (4 wt%)
Figure 4. PL spectra of thin films of a) pure PF-G0, b) PF-G0 containing
4 wt.- % S-CdS, c) pure MEH-PPV, d) MEH-PPV containing 4 wt.- % S-CdS, and e) PMMA containing 4 wt.- % S-CdS.
P
(i.e., the difference between the polymer on the substrate and the substrate).[23] The packing of PF-G1 chains in the solid state was found to be amorphous by X-ray diffraction experi-ments, with two broad correlation peaks. The peak that re-mains at 2h = 20.1° (d spacing = 4.4 Å), despite the variation in the amount of CdS nanoparticles, is due to the average C–C in-termolecular distance (i.e., the distance between the pendant groups of the polymer chains) of PF-G1, while the other peak at a lower diffraction angle, which changes with the amount CdS nanoparticles, is a measurement of the average interpoly-mer chain distance, as reported in a previous study of dendritic polyfluorene.[24] Figure 5b shows that the average interchain distance in PF-G1 in the nanocomposite increases as the num-ber of CdS nanoparticles increases. For instance, in the pres-ence of 4 wt.- % CdS4 nmnanoparticles, the interchain distance
in PF-G1 increases to 28.5 from 12.6 Å for pure PF-G1. As the CdS in PF-G1 increases to 8 %, the peak shifts to a diffraction angle smaller than the limit of the X-ray instrument, suggesting that the polymer chains are further apart, and indicating that the polymer chains could have become disordered (i.e.,
break-ing of the solid packbreak-ing of the polymer chains). One of the rea-sons that the interchain distance increases in the presence of CdS nanoparticles is possibly the selective distribution of the nanoparticles in the dendritic regions of the structure, which results from the relatively strong interactions between the ben-zyl groups of the dendrons and the phenyl groups of the thio-phenol ligands of CdS (Scheme 1). Figure 5c presents the Fou-rier-transform infrared (FTIR) spectra of G1 and the PF-G1 nanocomposite containing 4 wt.- % CdS4 nm. In comparing
these two spectra, we detect several significant differences that originate from the addition of the S-CdS nanoparticles. The features near 500 cm–1may be due to low-frequency ring bend-ing and deformation modes. The peaks near 990 cm–1are due
to the breathing mode of the benzene ring, and the peaks near 1600 cm–1 originate from C苷C stretching. The inclusion of
S-CdS nanoparticles significantly quenches the deformation and breathing modes of the benzene rings; this observation in-dicates that there is a possibility that p–p stacking occurs to a large extent between the phenyl groups of thiophenol and the dendritic units in PF-G1. The interactions between aromatic 5 10 15 20 25 30 35 40 19.6º 4.9º (iv) (ii) (i) (iii) 7.0º 19.9º 20.1º 3.1º In te nsity (A rbitr ary U n its ) 2θ (deg.) a) 0 2 4 10 20 30 The amount of S-CdS in PF-G1 (wt%) B r agg d s p ac in gs (Å) Polymer interchain distance peak C-C intermolecular distance peak 4.4Å 4.5Å 4.5 Å 12.6Å 28.0Å 18.0Å b) 2000 1500 1000 500 0 20 40 60 80 100 % T ransm itta n ce Wavenumber (cm-1) (i) PF-G1 (ii) 4%S-CdS/PF-G1 513 cm-1 759 cm-1 990 cm-1 1200 cm-1 1600 cm-1 1600 cm-1 c) 0.5 1.0 1.5 2.0 1.06 V 1.53 V 1.11 V 1.62 V 8% S-CdS/PF-G1 onset 1.25V PF-G1 onset 1.29V Curren t (A) Potential (V) PF-G1 3% S-CdS/PF-G1 4% S-CdS/PF-G1 8% S-CdS/PF-G1 d)
Figure 5. a) X-ray diffraction spectra of S-CdS/ PF-G1 nanocomposite: i) PF-G1; ii) PF-G1 containing 3 wt.- % S-CdS; iii) PF-G1 containing 4 wt.- %
S-CdS; and iv) PF-G1 containing 8 wt.- % S-CdS. b) The effect of the amount of S-CdS on the Braggd spacing of PF-G1. c) FTIR spectra of i) PF-G1 and
ii) PF-G1 containing 4 wt.- % S-CdS. d) Cyclic voltammogram of the oxidation of the polymer.
FULL
P
rings via p-stacking (i.e., the van der Waals contact between aromatic rings)[25]are at the origin of many phenomena in
or-ganic materials science[26]and biological chemistry,[27]and can be determined by the oxidation potential of the material during electron detachment. Another piece of supporting evidence for the CdS nanoparticles being bound to the dendrons can there-fore be found in the oxidation potential change, when p-stack-ing of the thiophenol surfactant on CdS with the phenyl groups in the dendron structure occurs. Figure 5d shows that both the onset and the true oxidation potential (Eox1/2) of S-CdS/PF-G1
decreases with increasing CdS content. For example, in the presence of 8 wt.- % CdS4 nm nanoparticles, the Eox1/2 of the
composite decreased to 1.30 V from 1.37 V for pure PF-G1. The cutoff potentials for these materials are all at 2.20 V, and their curves are reversible after three scans at a scanning rate of 50 mV s–1. While the oxidation potential change for PF-G1
by CdS is small—owing to the fact that the actual volume percentage of CdS in PF-G1 is one fourth of its weight percentage (the density of CdS/PF-G1 is close to 4:1)—it is significant in the sense that this different electrochemical behavior indi-cates a weak interaction between PF-G1 and S-CdS, in which one of the possible causes is the p–p interaction between thiophenol and the den-dritic units. This phenomenon is consistent with a report by Cao and Curtis,[28]which reported that p-stacked structures between small molecules may provide higher carrier mobilities and lower oxidation potentials. Hence, our data implies that there is a possibility that some portions of the ligands of CdS nanoparticles and the dendritic structure of copolyfluorene formed a p-stacked structure, resulting in a greater separation be-tween chains.
By combining the FTIR, oxidation potential, and X-ray diffraction results, it can reasonably be concluded that some S-CdS nanoparticles are in-corporated into certain dendritic polyfluorene chains, and that this leads to an increased dis-tance between some parts of the polyfluorene chains. Despite the fact that greater copolyfluor-ene chain separation might somewhat reduce charge transport in a device, the actual charge transport was enhanced, as evidenced in the cur-rent density versus voltage data shown in Fig-ure 6b, where the current density of copolyfluor-ene increased substantially (almost 50 % at 8 V) in the presence of 8 wt.- % S-CdS nanoparticles. This phenomenon might result from an enhance-ment in charge transport by CdS nanoparticles and a p-stacked structure in the device that is far larger than the adverse effect caused by the poly-mer-chain separation. This increase in interchain distance implies that the free volume in the nano-composites is larger than that of the pure poly-mer, because the interpolymer chain distance is a one-dimensional representation of the free vol-ume. The glass-transition temperatures (Tg) of the
S-CdS/copo-lyfluorene nanocomposites at various compositions are sum-marized in the Supporting Information. Our hypothesis is supported by the fact that the value of Tgfor 8 wt.- % S-CdS/
PF-G1 is depressed to 74.3 °C from 90.5 °C for pure PF-G1. We also found that the values of Tgdecreased upon increasing the
diameter of the S-CdS nanoparticles. The depression is also ap-parent in the case of the PF-G2 nanocomposites (from 59.1 °C for pure PF-G2 to 54.3 °C); the low value of Tgof PF-G2,
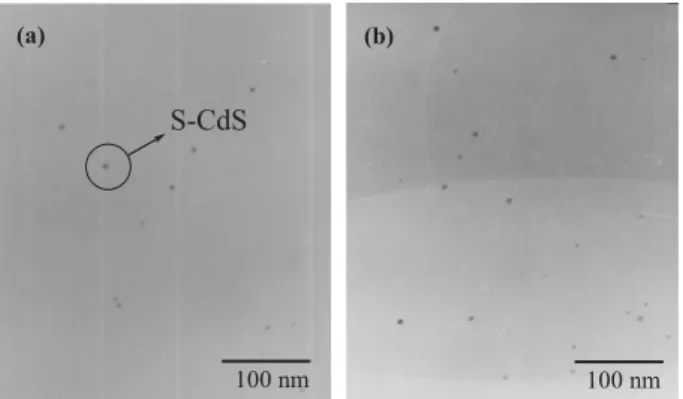
rela-tive to that of PF-G1, is due to the presence of a greater num-ber of chain ends in the second-generation dendron. Figure 7 displays transmission electron microscopy (TEM) images of 4 wt.- % S-CdS/PF-G1; it is clear that the S-CdS nanoparticles did not form large aggregates in the PF-G1 matrix. The other possible mechanism for the increased luminance results from electronic interactions occurring between CdS and PF-G1, but O O GX XG C8H17 C8H17 O O O O O O O O CdS CdS SH (b) n (a) addition of organic ligand Capped CdS nanoparticles PF-GX (X=1, 2) Dendritic structure S-CdS (c) X=1 X=2 Dendritic polyfluorene O O GX XG Br Br C8H17 C8H17 B O O B O O + Pd(PPh3)4 X=0 CH3
Scheme 1. Synthesis of a) S-CdS and b) PF-GX. c) The architecture of S-CdS/PF-GX
(X = 1,2).
P
this type of interaction is difficult to verify because of the low concentration of nanoparticles in PF-G1. Thus, in this study, we found no evidence for energy transfer occurring from PF-G1 to the CdS nanoparticles.
To obtain a quantitative assessment of the luminance en-hancement, we used Beer’s law to determine the normalized luminescence efficiency of these nanocomposites. Table 1 lists the values of the normalized PL with respect to the molecular concentration. Substantial improvements in the PL of the com-posite systems occurred when a small weight percentage of
S-CdS nanoparticles was present in either PF-G1 or PF-G2. For instance, we found a twofold improvement in the PL per fluorene chromophore for 4 wt.- % S-CdS/PF-G1 relative to that of pure PF-G1 (i.e., the quantum yield increased from 0.22 to 0.44). For the second-generation dendritic polymer nano-composite, S-CdS/PF-G2, the PL per fluorene chromophore in-creased by more than 1.7-fold relative to that of pure PF-G2 (i.e., the quantum yield increased from 0.54 to 0.92). This phe-nomenon can be explained quantitatively by Equation 1[29]
gPL=fFL/fA= kr/(kr+ knr) (1)
where gPL is the fluorescence yield, fFL is the number of
photons emitted, andfA is the number of photons absorbed.
The terms krand knrrepresent the rates of decay of the
radia-tive and combined non-radiaradia-tive processes, respecradia-tively. The S-CdS nanoparticles in PF-G1 cause a decrease in knr, which in
turn results in an increase in gPL. The observation that the
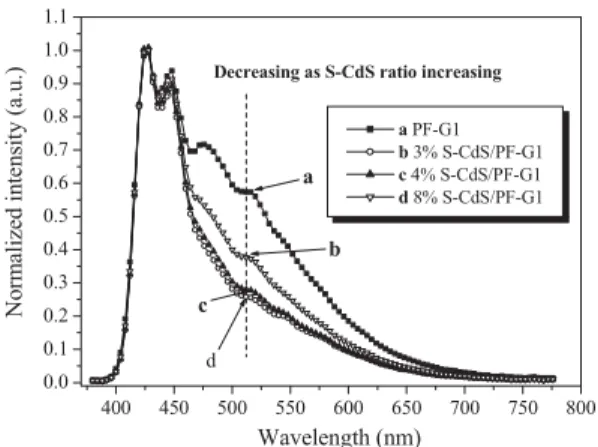
in-corporation of CdS nanoparticles into the dendritic polymer structures reduces the degree of energy transfer from the iso-lated polymer chains to an interchain dimer is also evident in the EL of the S-CdS/PF-G1 device. We fabricated double-layer light-emitting diode (LED) devices having the configuration indium tin oxide (ITO)/PEDOT:PSS/polymer/Ca/Al, where PEDOT:PSS (poly(3,4-ethylenedioxythiophene) doped with poly(styrenesulfonic acid) (Batron-P 4083)) was used as the hole-injection/transporting layer at a thickness of 150 nm. A thin layer of Ca (35 nm) was employed as the cathode, which was coated with a 180 nm thick layer of Al. The thickness of the emissive layer was ca. 80 nm. Figure 8 displays the normal-ized EL of the devices. The similarities between the EL and PL spectra of both the pure PF-G1 and S-CdS/PF-G1 devices indi-cate that the same excitation processes occur in each case. The EL device prepared from pure PF-G1 emits blue light at 426 nm and a weak green light in the range 465–550 nm. In the case where 8 % S-CdS was incorporated into PF-G1, the green
0 1 2 3 4 5 6 7 8 9 10 0 200 400 600 800 1000 1200 Lu m ina n ce (cd /m 2 ) Voltage (V) PF-G1 3% S-CdS/PF-G1 4% S-CdS/PF-G1 8% S-CdS/PF-G1 a) 0 1 2 3 4 5 6 7 8 9 10 11 12 0 200 400 600 800 C u rr ent dens ity (m A /c m 2 ) Voltage (V) PF-G1 3% S-CdS/PF-G1 4% S-CdS/PF-G1 8% S-CdS/PF-G1 b)
Figure 6. a) Luminance–voltage (L–V) and b) Current–voltage (I–V)
curves of devices prepared from S-CdS/PF-G1 in the configuration indium tin oxide (ITO)/[poly(3,4-ethylenedioxythiophene), PEDOT/polymer/Ca/Al.
100 nm
S-CdS
(a)
100 nm
(b)
Figure 7. TEM images of PF-G1 films containing a) 3 wt.-% and b) 4 wt.-%
of S-CdS.
Table 1. Absorption and PL data for S-CdS/polymer nanocomposites in
the solid state.
Sample e[a] OD [b] L [c] M [d] UFL[e]
M–1cm–1 k= 394 nm [nm] [mol–1cm–3] PF-G1 4.486 104 0.326 95 0.771 0.22± 0.03 3 wt.- % S-CdS/PF-G1 4.616 104 0.301 106 0.620 0.38± 0.02 4 wt.- % S-CdS/PF-G1 4.916 104 0.293 88 0.680 0.44± 0.04 8 wt.- % S-CdS/PF-G1 4.926 104 0.290 90 0.655 0.47± 0.03 PF-G2 7.706 104 0.192 76 0.328 0.54± 0.03 3 wt.- % S-CdS/PF-G2 7.626 104 0.203 84 0.317 0.76± 0.02 4 wt.- % S-CdS/PF-G2 7.516 104 0.226 81 0.372 0.92± 0.07 [a] Values of the decadic molar extinction coefficient were determined from UV-vis spectra recorded in THF (e = OD/cl), where c is the
concentra-tion of the compound in soluconcentra-tion, andl is the path length of the sample.
[b] The optical density (absorbance) in the solid state. [c] The thickness of the thin film. [d] The concentration of the fluorescent chromophore in each composite film. [e] PL quantum efficiency was determined by using two standards: poly-2,7-(9,9-dioctylfluorene) (UFL= 0.55) and
9,10-diphe-nylanthracene (UFL= 0.90) [29]. The deviation in the reported values is due
to the different values obtained using two different standards.
FULL
P
emission in the range 465–550 nm decreased sharply, while the peak at 426 nm became a sharper, major emission peak. In ad-dition, the full width at half-maximum (FWHM) of the peak of 8 % S-CdS/PF-G1 decreased to 49 nm from a value of 112 nm for pure PF-G1, indicating that it emits a purer blue light. Compared with its PL spectrum, the change in relative intensi-ties in vibronic structure indicates that aggregate emission is dominant in the EL process.[30,31a]This behavior has also been observed in polyfluorene derivatives, namely for PF-POSS (POSS: ployhedral oligomeric silsequioxane).[31b]Figure 6 dis-plays the variations of the current density and brightness of the EL devices. The turn-on voltage increased to 4.5 V for PF-G1 containing 8 % S-CdS from 4 V for the pure PF-G1 EL device. A more than fourfold increase in the maximum brightness of the 8 % CdS/PF-G1-based device occurred relative to that of the pure-PF-G1 EL device (1196 vs. 298 cd m–2) at a drive
volt-age of 8 V and a current density of 564 mA cm–2. These im-provements are probably due to the lower degree of aggrega-tion that occurred upon incorporating S-CdS into PF-G1.
3. Conclusions
Placing a small amount of surface-tailored CdS nanoparticles into the dendritic structure of copolyfluorene substantially im-proves the efficiency of the polymer’s light emission, as well as the purity of the emitted light. One possible explanation for the enhancements in PL and EL may be the reduction in the concentration of interpolymer excimers through which energy transfer occurs from the excited polymer chains to their neigh-boring ground-state polymer chains, i.e., the CdS nanoparticles caused an increase in the interpolymer chain distance.
4. Experimental
Surface-modified CdS nanoparticles were synthesized by mixing cad-mium acetate dihydrate [Cd(OAc)2·2H2O], sodium sulfide (Na2S), and
thiophenol (HSC6H5) in methanol at room temperature, using a
varia-tion of the kinetic-trapping method [32,33]. The diameter of the synthe-sized CdS was adjusted by changing the ratio of the three ingredients.
After filtration, the S-CdS nanoparticles were collected and then dis-persed in DMF. From the absorption edge (ke) in their UV-vis spectra,
the S-CdS nanoparticles were determined to have diameters of ca. 3, 4, and 7 nm [34,35].
The synthesis of the dendritic polyfluorene was performed using a typical Suzuki coupling reaction protocol. The copolymerization of den-dritic monomers and 2,7-bis(4,4,5,5-tetramethyl-1,3,2-dioxaborolan-2-yl)-9,9-dioctylfluorene was performed using Pd(PPh3)4as a catalyst and
Aliquat 336 as a phase-transfer reagent in a mixture of toluene and aqueous potassium carbonate (2.0 M). A detailed description of the syn-thesis of these dendritic copolyfluorenes is available elsewhere [21,36]. S-CdS/DMF was added to a previously prepared dendritic copolyfluor-ene PF-GX (X = 0,1,2) in DMF solution and stirred overnight. PF-G1, the polyfluorene possessing one dendron generation, had a weight-aver-age molecular weight (Mw) of 65 kDa (1 Da = 1.66 × 10⁻²⁷kg)and a
polydispersity of 1.9; PF-G2, the polyfluorene having two dendron gen-erations, had a Mwof 40 kDa and a polydispersity of 2.2. The mixture of
S-CdS/PF-GX in DMF was dried under vacuum at 313 K for 2 h and then maintained at 383 K for another 24 h to obtain the S-CdS/PF-GX nanocomposite film. Scheme 1 outlines the synthesis of the nanocom-posites formed from the thiophenol-modified CdS nanoparticles and the dendritic copolyfluorenes. Gel permeation chromatographic analyses on samples were performed with a Waters 410 Differential Refract-ometer and a Waters 600 controller (Waters Styragel Column). All GPC analyses of polymers in THF solutions were carried out at a flow rate of 1 mL min–1at 40 °C; the samples were calibrated using polystyrene
stan-dards. The current–voltage characteristics were measured using a Hew-lett–Packard 4155B semiconductor parameter analyzer. The power of the EL emission was measured using a Newport 2835-C multifunction optical meter. The brightness was calculated using the forward output power and the EL spectra of the devices; a Lambertian distribution of the EL emission was assumed. Cyclic voltammetry (CV) measurements were performed with an Autolab ADC 164 electrochemical analyzer in anhydrous acetonitrile with 0.1 M tetrabutylammonium hexafluoro-phosphate (TBAPF6) as the supporting electrolyte at a scanning rate of
50 mV s–1. The working and auxiliary electrodes were platinum. The
po-tentials were measured against an Ag/Ag+(0.01 M AgNO3) reference
electrode with ferrocene as the internal standard. Thin films of the poly-mer were prepared by a solvent-casting method. Blank CV experiments were carried out in fresh buffer solutions, and these were determined to be electrochemically inactive.
Received: June 8, 2005 Final version: September 7, 2005 Published online: March 14, 2006
–
[1] I. Prieto, J. Teetsov, M. A. Fox, D. A. V. Bout, A. J. Bard, J. Phys.
Chem. A 2001, 105, 520.
[2] D. Marsitzky, R. Vestberg, P. Blainey, B. T. Tang, C. J. Hawker, K. R. Carter, J. Am. Chem. Soc. 2001, 123, 6965.
[3] Q. Pei, Y. Yang, J. Am. Chem. Soc. 1996, 118, 7416.
[4] D. Y. Kim, H. N. Cho, C. Y. Kim, Prog. Polym. Sci. 2000, 25, 1089. [5] D. M. Johansson, G. Srdanov, G. Yu, M. Theander, O. Inganäs, M. R.
Andersson, Macromolecules 2000, 33, 2525.
[6] R. M. Gurge, A. M. Sarker, P. M. Lahti, B. Hu, F. E. Karasz,
Macro-molecules 1997, 30, 8286.
[7] G. Padmanaban, S. Ramakrishnan, J. Am. Chem. Soc. 2000, 122, 2244. [8] J. Grimme, K. Martin, F. Uckert, K. Müllen, U. Scherf, Adv. Mater.
1995, 7, 292.
[9] S. H. Jin, M. S. Jang, H. S. Suh, H. N. Cho, J. H. Lee, Y. S. Gal, Chem.
Mater. 2002, 14, 643.
[10] a) H. Yang, P. H. Holloway, J. Phys. Chem. B 2003, 107, 9705. b) Y. H. Kim, D. Kim, S. C. Jeoung, J. Y. Han, M. S. Jang, H. K. Shim,
Chem. Mater. 2001, 14, 643.
[11] J. Cheng, S. Wang, X. Y. Li, Y. J. Yan, S. Yang, C. L. Yang, J. N. Wang, W. K. Ge, Chem. Phys. Lett. 2001, 333, 375.
[12] F. Hide, B. J. Schwartz, M. A. Diaz-Garcia, A. J. Heeger, Chem. Phys.
Lett. 1996, 256, 424. 400 450 500 550 600 650 700 750 800 0.0 0.1 0.2 0.3 0.4 0.5 0.6 0.7 0.8 0.9 1.0 1.1 d c b a PF-G1 b 3% S-CdS/PF-G1 c 4% S-CdS/PF-G1 d 8% S-CdS/PF-G1 Decreasing as S-CdS ratio increasing
a Nor m al ized i n te nsit y (a. u .) Wavelength (nm)
Figure 8. Normalized EL spectra of devices prepared from S-CdS/PF-G1 in
the configuration ITO/PEDOT/polymer/Ca/Al.
P
[13] B. O. Dabbousi, M. G. Bawendi, O. Onitsuka, M. F. Rubner, Appl.
Phys. Lett. 1995, 66, 1316.
[14] W. U. Huynh, J. J. Dittmer, A. P. Alivisatos, Science 2002, 295, 2425. [15] a) D. J. Milliron, A. P. Alivisatos, C. Pitois, C. Edder, J. M. J. Fréchet,
Adv. Mater. 2003, 15, 58. b) J. H. Park, Y. T. Lim, O O. Park, J. K.
Kim, J.-W. Yu, Y. C. Kim, Chem. Mater. 2004, 16, 688.
[16] P. A. Van Hal, M. P. T. Christiaans, M. M. Wienk, J. M. Kroon, R. A. J. Janssen, J. Phys. Chem. B 1999, 103, 4352.
[17] H. Mattoussi, L. H. Radzilowski, B. O. Dabbousi, E. L. Thomas, M. G. Bawendi, M. F. Rubner, J. Appl. Phys. 1998, 83, 7698.
[18] M. C. Schlamp, X. Peng, A. P. Alivisatos, J. Appl. Phys. 1997, 82, 5837.
[19] a) L. Sheeney-Haj-Ichia, Z. Cheglakov, I. Willner, J. Phys. Chem. B
2004, 108, 11. b) T. Trindade, P. O’Brien, N. L. Pickett, Chem. Mater. 2001, 13, 3843.
[20] N. C. Greenham, X. Peng, A. P. Alivisatos, Phys. Rev. B 1996, 54, 17 628.
[21] C. H. Chou, C. F. Shu, Macromolecules 2002, 35, 9673.
[22] J. Hofkens, M. Cotlet, T. Vosch, P. Tinnefeld, K. D. Weston, C. Ego, A. Grimsdale, K. Müllen, D. Beljonne, J.-L. Brédas, S. Jordens, G. Schweitzer, M. Sauer, F. D. Schryver, Proc. Natl. Acad. Sci. USA
2003, 100, 13 146.
[23] Wide-angle X-ray scattering (WAXS) is used for characterizing the
d spacing of polymeric materials. The scattering experiments were
carried out on a Siemens Hi-Star area detector with Cu Ka radiation
k = 1.5406 Å operated at 40 kV and 45 mA. The 2h range was from 1
to 40°, and the sample was a film about 1 lm thickness on a glass sub-strate.
[24] a) S. Setayesh, A. C. Grimsdale, T. Weil, V. Enkelmann, K. Müllen, F. Meghdadi, E. J. W. List, G. Leising, J. Am. Chem. Soc. 2001, 123, 946. b) S. H. Chen, A. C. Su, C. H. Su, S. A. Chen, Macromolecules
2005, 38, 379. c) S. Choi, J. H. Kim, Y. S. Kang, Macromolecules 2001,
34, 9087. d) D. A. Shultz, R. M. Fico, P. D. Boyle, J. W. Kampf, J. Am. Chem. Soc. 2001, 123, 10 403.
[25] R. Rathore, S. H. Abdelwahed, I. A. Guzei, J. Am. Chem. Soc. 2003,
125, 8712.
[26] a) G. Maruta, S. Takeda, K. Yamaguchi, K. Ueda, T. Sugimoto, Synth.
Met. 1999, 103, 2333. b) H. Adams, C. A. Hunter, K. R. Lawson,
J. Perkins, S. E. Spey, C. J. Urch, J. M. Sanderson, Chem. Eur. J. 2001,
7, 4863.
[27] V. López-Ramos, C. A. Vega, M. Cádiz, E. Meléndez, J. Electroanal.
Chem. 2004, 565, 77.
[28] J. Cao, M. D. Curtis, Chem. Mater. 2003, 15, 4424.
[29] a) R. G. Dondon, V. P. Khilya, A. D. Roshal, S. Fery-Forgues, New J.
Chem. 1999, 23, 923. b) A. W. Grice, D. D. C. Bredley, M. T. Bernius,
M. Inbasekaran, W. W. Wu, E. P. Woo, Appl. Phys. Lett. 1998, 75, 629. [30] T. Q. Nguyen, I. B. Martini, J. Liu, B. J. Schwartz, J. Phys. Chem. B
2000, 104, 237.
[31] a) S. H. Chen, A. C. Su, Y. F. Huang, C. H. Su, G. Y. Peng, S. A. Chen, Macromolecules 2002, 35, 4229. b) C. H. Chou, S. L. Hsu, K. Dinakaran, M. Y. Chiu, K. H. Wei, Macromolecules 2005, 38, 745. [32] J. G. C. Veinot, M. Ginzburg, W. J. Pietro, Chem. Mater. 1997, 9, 2117. [33] N. Herron, Y. Wang, H. Eckert, J. Am. Chem. Soc. 1990, 112, 1322. [34] L. Brus, J. Phys. Chem. 1986, 90, 2555.
[35] M. Moffitt, H. Vali, A. Eisenberg, Chem. Mater. 1998, 10, 1021. [36] a) S. Setayesh, A. C. Grimsdale, T. Weil, V. Enkelmann, K. Müllen,
F. Meghdadi, E. J. W. List, G. Leising, J. Am. Chem. Soc. 2001, 123, 946. b) D. Eaton, Pure Appl. Chem. 1998, 60, 1107.