Chiao Da Management Review 均1.31 No. 2, 2011 pp.61-99
台灣共同基金清算決定因素以及合併
基金股東財富移轉效果
The Exit Determinants and Wealth Effects in the Taiwan
Mutual Fund Industry
林美珍 I Mei-Cben Lin 國立台北大學企業管理學系
Department ofBusiness Administration, National Taipei University 莊典朧 Dai-TzungChung
國立中山大學財務管理研究所
Department ofFinance
,
National Sun Yat-sen University摘要:本研究皆在探討台灣共同基金進行合併或清算的決定因素,以及合併 後基金股東的財富影響效果 。 實證結果發現,清算基金的績效表現是最差 的,同家族內的合併基金表現次之,而存活的基金表現是最好的。從基金流 量的角度觀察,前期績效較差且長期資金淨流出的基金會增加被清算的機 率;另一方面,前期績效較差但短期資金淨流出的基金則較容易進行同機構 內基金的合併動作 。透過相互合併的基金樣本發現,主併基金的績效在併購 後呈現明顯的衰退,相反的,併購對於被併基金是最有利的 。 意味著合併過 程可能造成主併基金股東的財富移轉至目標基金的投資人。今併後存續下來 的基金,併購之後的資金仍然呈現淨流出的現象 。 由於併購改善經濟規模效 果,存續基金的費用率可望在今併後的第二年出現下降的情況。 關鍵詞:共同基金;績效;清算;合併
Abstract : This study examines the determinants of mutual fund mergers and liquidations, and discusses the subsequent wealth impacts of mergers on investors in the Taiwan Mutual Fund Industry. Liquidated funds showed the worst performance, funds merged within the same family ranked second, and surviving I Corresponding author: Lin, Department of Business Administrati凹,National Taipei Universi旬,
62 The Exit Determinants and Wealth Effects in the Taiwan Mutual Fund lndustry
funds were the best. Poor prior perfo口nance and long-term fund outf1ows increase the possibility of being liquidated. Similarly, poor prior performance and short-term fund outf1ows lead to higher odds of a within-family merger. Investors in an acquiring fund experienced a significant deterioration in performance subsequent to the merger activity. In contrast, the investors of target funds benefited from these combinations. The net asset f10ws continued to remain negative for the combined fund in the year following the merger. The expense ratio of combined funds declined in the second post-merger year due to improved economies of scale after the merger.
Keywords: Mutual fund; Performance; Flow; Liquidationk; Merger
1. Introduction
Given the rapid growth in the Taiwan mutual fund industry during the 199缸,
the investment trust companies have designed and initiated many new financial products. Meanwhile, a large number of funds have also exited the market over the past few years. Mutual fund closures are not extraordinary events; actually
,
they happen all the time as part of the fund industry's natural business cycle. In particular, due to the decline of the global stock market in late 2008, the numbers of defunct funds reached a record level in 2008.Mutual fund liquidation and fund mergers are normal market exit mechanisms and are considered to be one means of reducing what may be perceived as an excessive supply (Zhao 2005). Fund families are in business to make a profit, with the hope that funds can operate with economies of scale in which bigger is better from a cost-savings perspective. As costs increase and the fund families start to feel that it is becoming unprofitable to operate, the fund will be faced with the choice of being terminated or merged with other funds. In addition to the consideration of costs and profitabili旬,fund families may merge funds because the merger gets rid of bad performers, so that dreary track records disappear from fund literature and databases
,
making the fund families look better than they really are. After thoroughly considering various factors like priorChiaoDaM的α'gemenlReview 均 1.31No. 2, 2011 63
performance and flows, fund families make decisions about whether a mutual fund should be liquidated, merged, or kept in the fund market
The relevant factors guiding fund families' exit choices have attracted some attention, but only a few papers are dedicated exclusively to this topic (Jayaraman,
Khorana and Nelling, 2002; Zhao, 2005). The survivorship bias Iiterature also addresses issues regarding the fund exit process. For example
,
several studieshave shown that poor performance increases the exit probability of a fund, and
that funds are more likely to exit when overall market performance is poor (see
Brown and Goetzmann, 1995; Elton, Gruber and Blake, 1996; Hendricks, Patel,
and Zeckhauser, 1997; Lund巴,Timmermann and Blake, 1999). ln addition, due to the economies of scale
,
the likelihood of a fund exit may be inversely related to the fund size (see Brown and Goetzmann, 1995; Elton, Gruber and Blake, 1996; Jayaraman, Khorana and Nelling, 2002)One purpose of this paper is to investigate the determinants of the decision to terminate funds by fund companies in the Taiwan mutual fund industry. This research is motivated by certain features of Taiwan fund companies. First, by the
current Taiwan Stock Exchange Corporation (TSEC) rules
,
only the surviving fund's record should be repo口ed. This rule motivates fund families to terrninate funds with poor performances. By doing so, they improve the image of the entire family,
because they no longer have to keep track of the poor records of funds liquidated or merged out of existence. Second, ln the United States, a mutual fund is a separate entity, a trust or co叩oration,with its own board of directors, usuallyconsisting of a majority of independent directors. By contrast, Taiwan investment
trusts do not have a corporate form of organization. Mutual fund companies in Taiwan sell trust certificates
,
not shares,
to investors and a mutual fund company can concurrently manage several mutual funds (Lin,
2004). As a result,
it is thefund complex, rather than the fund itself, that decides whether a fund should exit
Therefore, this paper treats exit decisions as a function of the characteristics of
both individual funds and fund families
,
rather than of solely individual fundsThis differs from Jayaraman, Khorana, and Nelling (2002), who treated merge decisions as decisions made by individual 臼nds.
64 The Exit Determinants and Wealth 勾Tects in the Taiwan Mutual Fund /ndustry In addition, though the mutual fund industry in Taiwan has grown rapidly and there are an increasing number of mutual funds leaving the market, to the best of our knowledge no attention has been paid to the topic of fund c10sures For a relatively small scale industry with few professional mutual fund managers,
the Taiwan mutual fund industry has funds that are fairly easy to operate without economics of scales and therefore easy to exit 企omthe market. By studying the determinants that have led to the decision to terminate funds in the Taiwan mutual fund industry
,
we intend to fill in the research gap in this areaOur results show that decisions related to both liquidation and mergers were negatively related to fund size
,
past fund flows and past fund performance. In addition,
as expected,
the fewer the family flows,
the greater the probability that a fund would be liquidated. Finally, a fund family in our studies liquidated both a poorly-performing and a long-term outflow fund, but merged a poorly-performing fund with another one within a family if it had only experienced short-term fund outflows. This phenomenon may be attributed to the fact that the fund family attempted to retain valuable c1ient sources and distribution channels within the family, if a fund with poor performance had only experienced short-term asset outflows.In the context of wealth effects, investors of target funds benefited from the merger activity at the expense of investors in acquiring funds. Specifically
,
target fund investors experienced significant improvements in performance and a reduction in expense ratios after the merger. In contrast, acquiring fund investors experienced a signi日cant deterioration in postrnerger performance. Finally, because a fund family could retain fund assets if it merged other funds,
the combinded fund had an increase in assets under management,
even though the net asset flows remained negative for the combined fund in the year following the merger.The remainder of this paper is divided into six sections
,
beginning with this Introduction. Section 2 describes the related literature regarding determinants of fund exits. Section 3 outlines the data and statistic methodology. Section 4 contains the empirical determinants for Iiquidations and merges,
and Section 5Chiao Da Managemenl Review Vo/. 3 J No. 2. 20 J J 65
addresses the wealth and other effects surrounding the merger. Section 6 concludes the study.
2. Potential Determinants of Fund Exits
When deciding to terrninate a fund
, a
fund family has,
in addition to mergers,
altemative exit forrns (such as liquidation) based on different considerations (Zhao, 2005). Specifically, exits may take the forrn of liquidation or a mergerwith another portfolio either within the same fund family (“within-family
merger") or in other fami\ies (“across-family merger可 (Zhao, 2005). Among
these possibi\ities
, we
found that fund companies in Taiwan seldom merged their defunct funds with a fund in other families.2 As a result,
our sample onlyconsisted oftwo main categories: liquidation and within-family mergers
The exit forrns of liquidation and a within-family merger share some common features, indicating that they may share common deterrninants. However,
liquidation may not serve the purpose of a merger. Specifically, \iquidations involve the sale of all of a fund's assets and the distribution of the proceeds to the fund investors. ln comparison, mutual fund mergers lead to consolidation in the fund industry. Also, assets of portfolios liquidated are eliminated from th巴 fund
companies, while assets of within-family mergers are stiU under management of
the fund complexes. Therefore, there must be reasons why the defunct funds take different exit forrns; motives for fund exits for liquidations and within-family
mergers are examined in detail in the remainder of this paper. Because exit forrns depend on different considerations by fund families and objective-related issues,
the study discusses the deterrninants for liquidations and within-family mergers at
the mutual fund leve\, at the family level and finally at the objective level. To help illustrate the hypotheses
,
Table 1 summarizes the hypothesized signs of the potential deterrninants for each exit forrn2 According to the definition ofan across-family merger, only two samples were c1assified as such: the merger between the UBS Strong Fund and the Cathay Dragon Fund, and the merger between the UBS Genghis Khan Fund and the Cathay Dragon Fund. Hence, we did not consider across-family mergers
The Exit Determinants and Wealth Effects in the Taiwan Mutual Fund Jndustry 66
Table 1
Summary of the Hypothesized Effects of Potential Determinants on Various Exit Forms
This table summarizes the hypothesized signs of the potential determinants for each exit form. A positive sign (+) indicates 出 ata higher value of the corresponding variable is expected to increase the likelihood of the exit foπn, while a negative sign indicates that a higher value of the corresponding variables is e次pectedto decrease the likelihood of the exit form. A question mark (?) indicates that the corresponding variable is not expected to significantly affect the likelihood ofthe exit form
Variables Family Level
Fund number Net asset flow Performance Objective Level
Fund number Net asset flow Performance Fund Level
Size Net asset flow Age Performance Expense ratio b旦旦旦 Within-famil之旦erger + ? .+.+7 . Liquidation
+
+
?+
?2.
1.
Common Determinants for Liquidations and Mergers2.1.1. Fund level: Performance
,
Size,
Asset Flow,
and Expense RatioFunds exit the market for a variety of reasons
,
with poor performance ranked as one ofthe primaηcauses. Poor performance reduces asset flows,
as investors choose not to buy into a fund that isn 't doing well. It also lowers the mutual fund management firm's track record. Ifthe firm has five funds and four of them are doing well,
closing the poor performer gives the firm a track record based on four successful funds. In order to preserve records of superior family performance,
which is critical in light of the positive relationship between performance and subsequent asset flows,
it is rational for the family to eliminate funds with poor performance via a merger or liquidation. Poor performance also results in bad publicity,
whichChiao Da Managemenl Reνiew 的1.31 No. 2. 2011 67
can lead to large redemptions. Thus
,
mergers and liquidations are motivated
,
to a large degree
,
by the need to hide the performance of failing funds
(Jayaraman
, Khorana and l'、Jelling,2002
;
Zhao 2005;
Khorana, Tufano andWedge
,
2007)
,
and funds that disappear tend to do so due to their
叮叮 poorperformance over a period of time
,
or to the fact that their total market
value does not provide sufficient management fees to maintain the fund
(see Brown and Goetzmann,
1995
;
Elton,
Gruber and Blake,
1996;
Hendricks
,Patel and Zeckhauser
,1997
;
Lun缸,Timmermann and Blake
,1999). Along the
s
ame line of reasoning
,
a fund that has a poor economy of
scale
,
which might be discemible in higher expense ratios
,
is more likely to
be liquidated or merged within a family
.
ln addition
,
fund size and fund flows also play an important role as
determinants of survival or exit (Brown and Goetzmann
,
1995
;
Elton
,
Gruber and Blake
,1996
;
Jayaraman
, Khorana and 1、Jelling,2002; Zhao
,2005). If a fund is too small to achieve the economies of scale
,the fund
family is more likely to terminate the portfolio to avoid net losses through
liquidation or a merger with similar investment objectives (see Indro et al.
,1999
;
Perold and Salomon
,
1991). Hence
,
if a fund is small in size or
generates low flows that might lead to small size
,
the fund family is more
likely to terminate the fund to circumvent net losses.
2.1.2. Family Level: Numbers of Funds and Asset Flows
A
s
m
e
ntioned by Audretsch
(1994)
,institutions belonging to a
multi-plant
finn may have a higher likelihood of exit than independent
institutions. Along thi
s
line of reasoning,
in order to preserve or improve
their reputation
,
a large family of funds may choose to liquidate or merge a
poorly-performing fund
,
because they are in a better position to consolidate
their product offerings without adversely affecting the investment choices
available to their investors
(J
ayaraman
, Khorana and Nelling
,2002). Also
,in contrast to smaller fund families
,which may have fewer corresponding
funds available to combine with a poorly performing fund
,large fund
68 The Exil Delerminanls and Wealth 互ffects in the
Taiwan Mutual Fund Industry
mergers. Therefore
,
the large families may show a stronger likelihood to participate in a within-farnily mutual fund merger to clear up funds with poor performance. Finally,臼nd families experiencing low net asset f10ws are more likely to get rid of those funds with poor performance,
low netf10ws or small size
,
either by liquidation or a merger,
in order to stayfocused (Zhao
,
2005).2.1.3. Objective Level: Performance and Asset Flow
The investment objective of a fund is often regarded as an industry. The industrial organization literature suggests that a lack of industry growth tends to result in firm exits (see Ilmakunnas and Topi, 1999; Doi, 1999). As a result,
mutual fund exits are more apt to occur in regard to investment objectives with
poor performance or poor net flows (Zhao, 2005)
2.2. Determioaots with
Di
ffereot Effects 00 the Two Exit Forms 2.2.1. Fund Level: Age and UniquenessIn the industrial organization literature
,
Audretsch (1995) has indicated that a firm's age could have different effects on the exit forms. ln addition, the existing literature based on the US data posits that portfolio age has a significant effect onthe decision whether to liquidate or merge (Jayaraman, Khorana and Nelling,
2002; Zhao, 2005), because mutual fund ratings are generally available for funds
with a minimum history of three years. As a consequence
,
a family might liquidate a portfolio that does not meet expectations in its eariy stage, in order toavoid poor Momingstar ratings. However
,
since it takes time to develop ciientsand distribution channels
,
a fund family may merge the fund with longer histories within the family (Zhao, 2005)In addition
,
fund families may spread their funds across a variety of investment objectives in an a前empt to extend their offerings in a s甘ateglc move (Mamaysky and Spiegel,
2002). Zhao (2005) posits that funds with different investment objectives may invest in different assets,
and fund families may set up new funds with objectives different 企omeXlstlllg ones, to attract more lllvestorsChiao Da Management Reνt飢似的1.31 No. 2, 2011 69
investment objective in the family
,
the fund will be considered truly unique in the family. Although a unique fund can satisfy the requirement of some particular investors by 0仟'eringspecial assets management and trading strategies,
a uniquefund also entails special research costs and marketing efforts. To achieve economies of scale and to remain focused, a family can eliminate the associated
research and marketing costs by liquidating a relatively unique portfolio or selling
it to other families. However
,
to attract more investors and expand their marketshare
,
they may also choose to keep a relatively unique portfolio. Hence,
the uniqueness of a fund relative to other funds in the family may increase ordecrease the likelihood of termination, depending on the trade-off between costs and market shares (Zhao, 2005)
2.2.2. Family Level: Performance
With respect to family performance
,
a family with superior performanceshould be less hesitant to liquidate a fund with poor performance and small size,
because the benefits from a c1ean record for the family outweigh the negligible loss of management fees from the liquidated fund. On the other hand, families with poor performance have a higher propensity to sell re1atively unique
portfolios to other families in order to stay focused by eliminating the special research and marketing costs associated with these relatively unique funds However
,
if the family decides to terminate a fund in the exit form of a within-family merger, assets of the target funds may still be preserved in thefamily after merging, regardless of whether the family has poor or superior
performance. Hence, the relationship between family performance and the probability of a within-family merger can be either positive or negative.
2.2.3. Objective Level: Number ofFunds
If the number of portfolios with a specific objective is small
,
the investment objective may be minor or there may be few c1ients who are fond ofthis objective. Although these rare funds with a particular objective might cater to the requirement of some particular investors by offi巴ring special assets
70 The Exit Determinants and Wealth Effects in the Taiwan Mutual Fund Industry
marketing e釘orts. To achieve economies of scale and reduce cost
,
a family may eliminate a relatively rare portfolio by liquidation. In line with this reasoning, mergers may be more likely to occur in investment 0句 ectiveswith fewer funds,because consolidation can more easily lead to a larger market share and achieve economies of scale in smaller investment objectives. However
,
to attract more investors and expand their market shares, a fund family may keep rare portfolios with a specific objective. Therefore, the relationship between fund numbers in the objective and the probability of liquidation and/or a merger depends on the trade-off between costs and market shares.3. Data and Empirical Methodology
3.
1.
Data
This sample of mutual funds was obtained 台om the Securities Investment Trust and Consulting Association of the R.O.C. (SITCA) and Taiwan Economic Joumal (TEJ). The TEJ database contains data on: fund name, fund family,
inception date, daily net asset value, expense ratio, fund loads, fund category,
daily return, net asset value (NA V), turnover ratio, total assets, and other characteristics of the fund. For funds that exited, the dataset has inforτnatlOn on when they exited, their history until then, whether they were liquidated or merged with other funds, and the identity of the acquiring funds in the latter case. This sample covers 624 open-end equity funds for the period 1997 to 2008. Over the sample period, 211 funds exited the market
,
with 115 mutual funds via liquidation and 96 mutual funds via merger. If a fund's age was less than two years whenexiting the market, it was excluded from the sample because complete
information could not be received. Based on this criterion, we excluded five liquidated funds and four merged funds from the raw sample. Therefore, the total sample considered consists of 110 mutual fund liquidations and 92 mutual fund mergers
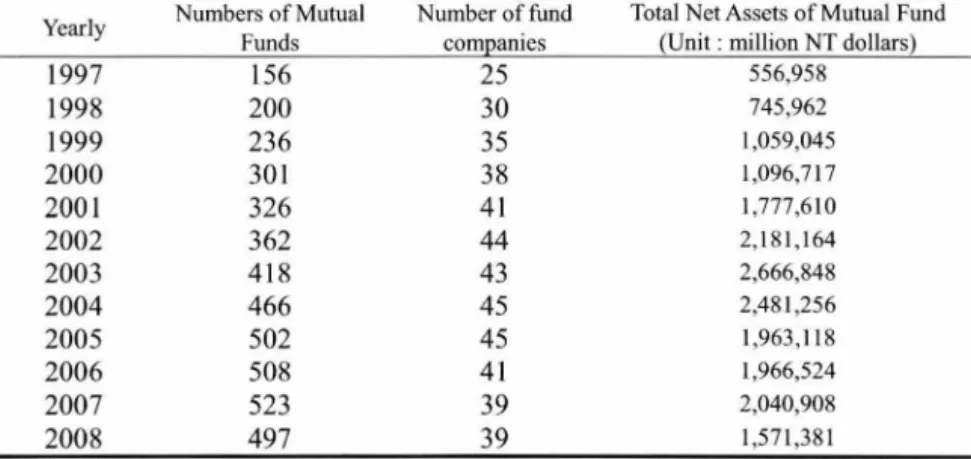
Table 2 shows the number of open-end equity funds increasing steadily from 156 at the end of 1997 to 523 at the end of 2007. There was a steady increase in the number of fund companies before 2005
,
and they decreased afterwards. TheChiao Da Managemenl Review均1.31 No. 2, 2011 71
total net assets (TNA) of open-end equity funds increased from NT$556,958 million in 1997 to the maximum value of NT$2
,
666,
848 million in 2003,
andthen dropped to NT$I,571,381 million in 2008. Given the decrease in the total assets managed by the 臼nd industry since 2003 and the rapid increase in the number of mutual fun血,the liquidations and mergers among mutual funds from
2003 to 2008 can be seen as one means of reducing what may have been
perceived as an excessive supply. The ongoing consolidation of the tinancial services industry provided an incentive for fund families to combine funds, and reduce the number of fund offerings with similar objectives
Summary Statistics for Open-end Equity Funds in the Taiwan Mutual Fund Market
This table reports summalγstatistics of open-end equity funds from 1997 to 2008. The number of
funds, number of fund comp叩 ies,and total net assets managed in the mutual fund industry are presented. During the sample period, there was a steady increase in the numbers of open-end
equity funds before 2007 and the number of fund companies before 2005, and they decrease
afterwards. The ωtal net ass還 ts (TNA) reached the highest le呵 1 during 2003 and then
subsequently decreased
Numbers of Mutual Number offund Total Net Assets of Mutual Fund
Funds 156 200 236 301 326 362 418 466 502 508 523 497 YearJy 1997 1998 1999 2000 2001 2002 2003 2004 2005 2006 2007 2008 Table 2
compames (Unit: million NT dollars)
556,958 ζJnuζJOOEEA 『句 39 、 dp 、 d'inyny 233344444433 745,962 1,059,045 1,096,717 1,777,610 2,181,164 2,666,848 2,481,256 1,963,118 1,966,524 2,040,908 1,571,381
Table 3 shows the numbers and percentage of mutual fund liquidations, fund mergers and surviving funds over the sample period. It can be seen that there is a
steady increase in the liquidations and mergers of mutual funds along with
72 The Exit Determinants and Wealth EjJects in the
Taiwan Mutual Fund Industry
2005
,
2006,
2007,
and 2008,
representing 72.8 percent of all exits. In particular,
because of the financial tsunami in September 20的, total net assets and the numbers of mutual funds plunged from the end of 2007 to the end of 2008. Both the numbers of liquidations and mergers reached the highest levels of 40 and 24,
respectively, in 2008. On average, 4.30% of equity funds exited the market during
the sample period
3.2. Statistic Methodology 3.2.1. Measures of Performance
According to performance measurement \iterature
,
past performance is predictive of future risk-a句ustedreturns in both the short run and longer run (seeBrown and Goetzmann
,
1995; Elton,
Gruber and Blake,
1996). Besides rawreturns, we also employed both Sharpe's (1964) single-factor model (CAPM) and
Carhart's (1997) four-factor model
,
which is based on the Fama and French (1993)three-factor model
,
to evaluate the equity fund's performance. The speci日 cationsof the model are as follows
R;, -R.ft =αi+β'il *(RMt-Rρ)+&it, 、 BB / l (
Rit - R.ft =血,叫 1*(RMt一句)咐i2*SMB t +βi3*HMLt+βi4 *UMDt + 旬, (2) where Rit is the monthly retum of fund i at time t; Rfi (risk-free rate) is the monthly time deposit rate from the Fist Commercial Bank at time t; αt 合om(1) and (2) represents the single-factor return and four-factor retum, respectively; βij is the sensitivity of excess return on fund i to excess return on factor j;
RMrR.ft is the value-weighted market return on all TSEC stocks in excess of the risk-仕ee rate at time t; 5MBt is the difference in returns across small and big
stocks at time
t
;
HMLt is the difference in returns between high and lowbook-to-market stocks at time t; UMDt is the momentum factor at time t, which is
the difference in returns between stocks with high and low prior returns; and &it is the random error in month t. The 5MB and HML factors were calculated
Chiao Da Managemenl Reν間也F均1.31 No. 2, 2011 73
computed following Carhart (1997),3 Table 3
Numbers of Mutual Fund Liquidations and Mergers over the Sample Period This table shows the numbers of mutual fund liquidations and mergers during the sample
period. The numbers of liquidations are larger than those of mergers. On average, 4.30% of
~立“ndsexited the market during the sample period
Exits Funds Numbers
Year Liguidations Mergers Total of
Numbers % Numbers % Numbers % Survivors
1997 0.64
。
0.00 0.64 156 1998。
0.00。
0.00。
0.00 200 1999 。 42。
0.00 0.42 236 2000 9 2.90。
0.00 9 2.90 301 2001 9 2.66 0.89 12 3.55 326 2002 2 0.53 13 3.45 15 3.98 362 2003 4 0.93 6 1.40 10 2.34 418 2004 3 0.63 4 0.85 7 1.48 466 2005 6 1.15 12 2.31 18 3.46 502 2006 21 3.85 16 2.94 37 6.79 508 2007 14 2.54 14 2.54 28 5.08 523 2008 40 7.13 24 4.28 64 11.41 497 Total 110 2.34 92 1.96 202 4.30 4495ln addition, the objective-adjusted annual holding period retums (OARs), as proposed by Khorana (1996, 2001), were also used to measure fund perforrnance OARs are defmed as the annual retum of a fund in excess of the corresponding annual retum of other funds within the same investment 0句 ective. For each fund, OAR is computed as follows
OARiI= [I1(1吋i./) 一 1 ]一[I1 (1 +RoJ 一 1], (3)
where 尺1 is the retum of fund i in month t and Ro.l is the average retum of all
funds in the same investment objective in month t. This OAR measures the perforrnance of funds before and after the merger relative to other funds in their peer group. The same perforrnance measure is also applied in the liquidation
situation except for the years after liquidation
,
since liquidated funds are notsurvival entities
74
3.2.2. Flows
The Exil Delerminanls and Wealth Ej)告cls in the
Taiwan Mutual Fund Jndustry
Because the subscription and redemption amounts are available in the Taiwan mutual fund market
,
this paper measures the magnitude of asset tlows directly using data on subscription amounts, redemption amounts, and 臼ndassets. We compute flows (Flow;./) by subtracting the redemption amounts from the subscription amounts, and then normalizing the result by the asset values:Flow;1 = [Subscripti on;.1 - Re demption u] / Asset ;.1-1 (4) where Assetu is the total assets of fund at the end of month t, and
Subscriptionu and Redemption;.1 are the redemption and subscription amounts
of fund i during month t. The net asset flow is a measure of the difference between additional contributions into the fund and redemptions out of the fund Furthermore, we also calculated the objective叫justed net asset flow (0阿 ective net asset flow), which is defmed as the net asset flow of fund i less the average tlow into all funds in the homologous investment objective
3.2.3. Multinomial Logit Model
To examine the possibility that the underlying motives may differ between mutual fund mergers and liquidation, this paper estimated a three-outcome multinomial logit model to investigate the distinction among different exit forms The fund family can dispose of funds in three ways: (0) keep the fund in the family; (1) liquidate the fund; and (2) merge the fund into another fund within the same family. Of these three choices, we used the choice of keeping the fund as the comparison group to obtain insight into fund exit decisions by means of empirical dichotomies. Based on the values of family, objectives, and fund
attribut凹,the probability of each condition was made as follows
Prob (1'; = j) =
exp(β'jX;)
ì)xp(巧克)
Chiao Da Management Reνlew的 /.3/No. 2, 201/ 75
where j and i stand for each choice and fund
,
respectively; and k,
which also stands for each choice,
takes a value 仕om0
to 2. Prob(1';
= j) represents the probability, conditional on one of three choices, that the fund family may handle fund i. In order to correctly describe the explanatory variables and the importance of each factor,
this paper classified these variables into three-level factors: Family Level, Objective Level, and Fund LevelI.Family Level
a.Fund number in the family is the total number of all other surviving funds in
the family.
b.Family net assetflow is the difference between the sum ofpurchase amounts across funds in the family and the sum of redemption amounts across funds in the family, normalized by the sum of net asset values in the fund family over the past period
c.Family performance is the asset-weighted average of the objective叫üusted
returns of all other funds in the family 2.0bjective Level
a.Fund number in the objective is the total number of all other surviving funds with the same investment objective
b.Objective net asset flow is the di征erence between the sum of purchase
amounts across funds in the objective and the sum of redemption amounts across funds in the objective, normalized by the sum of net asset values in the objective over the past period
c
.o
bjective performance is the asset-weighted average of the holding period returns of all other funds with the same investment objective3.Fund Level
a.Fund size is the naturallog oftotal assets under management.
b.Fund net asset flow is the flow of money into and out of the fund, normalized
by the net asset values over the past period.
c.Fund age is the time period of the fund from its start to its termination
d.Fund pe吃formance is the holding period return in excess of the asset-weighted average retum of all funds with the same investment objective (i.e.
,
objective-吋 ustedperformance)76 The Exit Determinants and Weallh E,仰的 in Ihe Taiwan Mutual Fund lnduslry e.Expense ratio is defined as the value of operating expenses and management
fees given as a percentage of fund assets
f.Uniqueness is defined as the only fund with a certain investment objective in
the family (if the fund is unique, we regard it as 1; if the fund is not unique,
we give it 0).
Since performance and net asset f10ws may play a major role in important and long-term motives offund exit decisions
,
this paper included both one-lagged and two-lagged values ofthese two factors to reach a more precise understanding of their inf1uence. The regression model is described as follows1'; =α。 +β1(fund number in fam砂 )i.t-l + ß2 ( family net asset jlOW)i,I_1 + ß3 ( family net asset jlow)小2+ ß4 ( family performance)i,l_l + ß5 ( family peφrmance)i,I_2 + ß6( fimd number in objective);,I_l + β'7 ( objective net 的set jlow)昕一1+ ßs( objective net asset jlOW)i,I_2 + ß9 ( objective pe彷rmance)丸1-1 +
β10 ( objective performance)i.t_2 + β11 ( fund size)i.1 + β12 (戶nd net asset j!OWS)i,t-1 + β'13 ( fund net asset jlow)小2+ β14( fund age)i,t + β15 (fund
peφrmance);,I_1 + β16 fund pe彷rmance)i.I_2+ β17 (expense
ratio)小1+ ßIS (uniqueness);,1 + E:咐 (6)
where i, j and t stand for each fund, choice, and year, respectively; α。 is the
intercept;βq (q 1
,
2." 18) is the regression coefficient; and &;,1 is theresidual.
To depict the linear re1ations between variables
,
Table 4 provides the simple correlation coefficients, As shown, irrespective of family level, objective level,and fund level, performance and net fund f10ws were highly correlated with their lagged values, with the corresponding simple correlation coefficients ranging from 0.236 to 0.714. To further diagnose whether there is collinearity between variables
,
Table 5 reports the variance inf1ation factor (VIF) and conditional index IfVIF> 10 or the conditional index > 15, multicollinearity exists. Table 5 shows that there is no evidence of multicollinearity. In the following section,
we present the empirical results的 Eh gbb 文 §an E S H 甸 的 主 向毛 h e ~ 凶 ~宅 。 N -M 旬 之 Table 4
The Correlation Coefficient Matrix of Independent Variables in Multinomial Logit Model
Among them, Xl is the number of funds in family; X2 is family net asset flow in year t-I; X3 is family net asset Ilow in ye盯 t-2;X4 is family performance in year 叫;X5 is family performance in year t-2; X6 is the number of funds in objectiv嗨;X7 is obje氾 tivenet asset flow in year 叫;X8 is objective net ass剖 flo叫
in year t-2; X9 is objective performance in year t斗;XIO is obj叫 iveperformance in year 凹;X 11 is fund size; X 12 is fund net asset flow in year t-l; X 13 is fund n剖 assetflow in year 泣;X14 is fund age; X15 is fund performance in year t仆;X 16 is fund performance in year t-2; and X 17 is expense ratio in year
t仆, X18is characteristic ofuniqueness. •• and' indicate significant at the 1 and 5 percent confidence level, respe氾tively
XI X2 X3 X4 XS X6 X7 X8 X9 XIO XII XI2 XI3 XI4 XI X2 0.086'" X3 0.092.. 0.686.. X4 0.100.. 0.084.. 0.103.. X5 0.167" 0.061" 0.057.. 0.601" X6 0.004 0.068" 0.053" -0.019" -0.052.. X7 0.135-. 0.399.. 0.367" 0.011 0.003 0.072" X8 0.070.. 0.209" 0.256.. -0.007 -0.028-. O. \30" 0.659 .... X9 -0.028" -0.035.. -0.014* -0.007 0.009 0.014* -0β73.. -0.036.. X10 -0.014* -0.034.. -0.018.. -0.003 -0.013* 0.044" -0.060" 0.005 0.714" Xll 0.249.. -0.035." 0.002 0.\05" 0.190" -0.034.. -0.027.. -0.008 -0.056" -0.013 XI2 0.043.. 0.340.. 0.299". 0.032" 0.038.. 0.037". 0.266.. 0.170" 0.006 0.0肘。 149"" XI3 0.038" 0.368" 0.333" 0.038" 0.050" 0.034" 0.295'. 0.178" 0.0曲。ρ00 -0.102'" 0.707'" Xl4 0.298'" 0.087" 0.079" 0.010 0.030'" 0.297... 0.162'" 0.083'" 0.028" 0.055'" -0.045'" 0.115'" 0.087 .... X 15 0.017' 0.005 0.029'" 0.0\3 0.026'" -0.001 0.004 0.005 0.065" 0.06' " 0.05'''' 0.102" 0.193". 0.020" X16 0.009 0.063" 0.057'* 0.243.. 0.190'" -0.029. ' -0.04'** -0.031** -0.01 。一 0.008 -0.004 0.118'" 0.15" . -0.048'" 0.236'" X17 0.015 0.109" 0..097'" 0.109.. 0.065" 0.049 0.106 0.007 0.091 0.003 0.309*
.
0.201*' 0.197' 0.094. 0.102.... 0.872* X18 -0.19'*. 0.023" 0.017' -0β26" -0.025" -0.422'. 0.056" 0.041" -0.010 -0.005 -0.035" 0.014* 0.018' -0.117. ' -0.012 0.004 -0.191" ,18 XI7 XI6 XIS 、斗 、、』78 The Exit Determinants and Wea/th Eo伊cts in the
Taiwan Mutua/ Fund Industry Table 5
Collinearity Diaj!ßostics
This table reports the variance inflation factor (VIF) and conditional index to diagnose whether
there are collinear between variables. lf VIF > 10 or conditional index > 15, the multicollinearity
eXlsts
Variables VIF Conditional index
Family level
Fund number(t-l) 1.382 1.258
Net asset flow(t-I) 5.516 1.649
Net asset flow(t-2) 5.321 1.710
Pe由rmance(t-l) 1.916 1.863
Pe巾rmance(t-2) 1.970 2.131
Objective level
Fund number(t-I) 1.506 2.198
Net asset flow(t-1) 2.226 2.551
Net asset flow(t-2) 1.927 2.670
Performance(t-l ) 2.285 3.783
Perform個 ce(t-2 2.280 4.017
Fund level
Size(t) 1.209 4.435
Net asset flow(t-1) 6.362 4.596
Net asset flow(t-2) 6.701 5.813
Age(t) 1.231 7.156
Performance( t-l) 1.146 7.844
PEeXrPhErmise arnacteIO(t(dt-) l) 1.1.201 162 83.3.882 52
Uniqueness(t) 1.436 4.827
4.Empirical Results
4.1.
Fund Characteristics for Surviving,
Li
quidated Funds,
andMerged Funds
This section 自rstsummarizes the fund characteristics for all surviving fun血,
liquidated fun心, and funds merged within a family. Table 6 presents the fund performance
,
net asset tlows and other fund characteristics,
such as size,
age,
expense ratios, turnover ratios, and beneficiary. Panel A reports three fund
performance measures: single-factor alpha
,
Carhart (1997) four-factor alpha andobjective-a句 usted performance. Panel B describes the medians of other fund
Chiao Da Managemenl Review Vol. 31 No. 2. 2011 79
flow is the net flow (如nd inflow minus fund outflow) divided by total net assets;
expense ratio is the value of operating expense and management fees as a
percentage of fund assets; fund age is the period of time of a fund from its start to
its terrnination; fund turnover is the turnover ratio of funds, which are estimated
by adding the accumulative buy-in turnover and accumu\ative sel\-out turnover
together; and fund beneficiary is the number of investors who buy the funds
without redeeming them
In panel A
,
al\ performance measures show the same qua\itative resultsLiquidated funds and funds merged within the same fami\y disp\ayed poorer
performance than did the surviving funds. For instance, the objective-a你Isted
perforrnance of surviving funds was 0.155 percent, which was higher than the
p巴rforrnanceof liquidated funds (-0.22\ percent) and within-family merger funds
(-0.137 percent). The risk-adjusted return of single-factor alpha and multifactor
alpha also presented similar results, namely that poor perforrnance was an
important deterrninant that correlated with the exits of mutual funds
Table 6
Summary Statistics 00 the Exit Forms
This table pr臼凹的 themedians of fund performance, net asset flows and other fimd characteristics for the surviving fun品,liquidated funds and funds merged within a family in one year befo呵 theliquidation or merger date. Panel A reports three fund performance measures: the obje圳、 e-adjustedperfo叫nance, the single-factor alpha, and multifactor alpha. Panel B presents the medians of other fund characteristics. Among them, fund size is the total asscts under management; fund net asset flow is the net flo附(如nd inflo叫 mmus fund outf1ow) divided by total n剖 assets; 如 nd age is the period from the inception of a fund to i 阻
termmatlO啊;expense ratto 的 thevalue of operating expense and management fees as a percentage of fund assets; fund turnover is thc turno叩erratio of funds; and fund beneficiaries are lhe number of investors who b叫ylhe funds withoul redeeming them
Surviving Liquidaled funds funds
Panel A: Fund perfonnance (%)
Single-factor a -0.033 -0.427
0.435
-0.221
Multi-factor a -0.034
objective-adjusted Perfonnance 0.155
Panel B: Other fund characteristics
Size (Million, NT dollars) Net asset tlows (%) Age (Months)
Expense ratio (%)
Turnover (%) Beneficiary (Numbers) 1211.0 -0.075 66 。.136 158.922 6302 340.5 -5.912 44 0.217 139.377 156
Funds merge within a
生型!y -0.250 -0.393 -0.137 403.1 -2.326 51 0.149 146.598 939
80 The Exit Determinants and Wealth 互fJects in the Taiwan Mutual Fund Jndustry Panel B of table 6 shows that the size of all defunct funds
,
especial1y liquidated funds, was much smaller than surviving funds. Because a fund family could retain fund assets if it merged other funds within the family, the size of fund mergers within a family was a little higher than liquidated funds,
and only the smallest funds left the mutual fund market in the exit form of liquidation. Besides,
both Iiquidated funds and funds merged within a family suffered from net redemptions. Although the surviving funds also experienced net outflows
,
their net outflöws were smaller than those of the defunct funds. Compared to survivingfun血, younger funds had a higher propensity to cause liquidation than a merger with a fund within the family. Also, liquidated funds had the highest expense ratios, within-family merged funds ranked second, and survival funds had the lowest expense ratios. This implies that funds without economics of scales are more likely to become candidates for exit funds. Furthermore
,
the liquidated funds had the lowest tumover ratio, and the surviving funds had the highest. This indicates a greater tendency of aggressive trading for surviving funds than for exit funds. Finally,
the units of beneficiary were significantly lower for liquidated funds than for either funds merged within a family or surviving funds. The above results imply that the reasons for a fund being liquidated or merged within a family may differ.4.2. IIA Test
A key property of the multinomial logit framework is the assumption of the independence of irrelevant altematives (IIA)
,
which states that the relative probabilities of two options being chosen are unaffected by the introduction or removal of the other altemative. That is, the exit decisions represent three mutually exc1usive (independent) altematives: keep, Iiquidate, and merge. If the IIA property is violated,
then the multinomial logit model wiU be biased. To testfor the validity of the IIA assumption with respect to the fund exit
decision-making process
,
we apply Hausman's specification test (Hausman and McFadden,
1984). The strategy is to estimate the model with (the unconstrained model) and without (the constrained model) the other variables. If the IIA assumption is true,
the constrained and unconstrained estimated coefficients onChiao Da Managemenl Re叫酬,均1.31No. 2, 2011 81 the remaining categories should not be statistically different. The test statistic is:
(bc - bu)'[ Cov(bc)-Cov(bu)r 1 (bc - bl/), (7)
where bc and bu are the constrained and unconstrained coefficient estimates, and Cov( bc) and Cov( bu ) are their estimated covariance matrices. This statistic has
an approximate chi-square distribution with the number of degrees of freedom equal to the number of coefficients estimated in the constrained model
As the test fails to reject the assumption of the independence of irrelevant altematives (l1A), we consider a multinomial logit model to be an appropriate specification for the exit choice. The estimation results are shown in table 7. As shown, IlA prope前y cannot be rejected at the 1 % significant level when one of the three altematives is dropped. Therefore
,
the multinomial logit model is an appropriate model for the estimation ofthis data.Table 7
T'est of independence of irrelevant alternatives (IlA)
This table reports the results for Hausman and McFadden test with three of the altemative dropped. The result indicates that IIA prope叫y cannot be r句 ected at I % significant level Therefo惚,multinomial Logit model is an appropriate model for estimation ofthis data
AItemative dropped Chi-Square Probability
Keep the fund 0.0000 1.0000
Liquidation Within-family merge
4.3.
Multinomial Logit Results 0.0000 0.49031.0000 0.9988
Table 8 reports the results from the multinomial logit model. We considered two models with different specifications. ln Model (1), we compiled all level variables and considered all of them concu叮ently. To get a solid result, we perforrned a stepwise regression in Model (II) to obtain proper explanatory variables, and then took these variables into account.
The results in Model (1) provide evidence of significant and negative relationships between liquidation probability and prior net asset f10ws into a fund
82 The Exit Determinants and Wealth Effects in the
Taiwan Mutual Fund fndustry
family. For example
,
one additional 1 % of net asset flow into a fund's family in year t-I reduced the 61.9% odds ofbeing in liquidation at year t. These findings were consistent with the prediction that families with lower fund flows are more likely to liquidate a fund for the sake of keeping the economies of scale. However, the decisions on fund exits were not associated with numbers of funds and the performance of a family. Interestingly, when the evaluation was based on resu\ts at the objective leve\, the characteristics of the fund objective did not affect whether a fund exited or remained in the industryAt the fund level, the likelihood of both liquidations and mergers was inversely related to fund size. The odds ratio on fund size was 0.051, which indicated the odds of liquidation were 94.9 percent lower when a fund size increased one billion. Furthermore
,
poor past two year performances increased the probability of a fund exiting the market, either in the form of liquidation or a merger. Specifically,
liquidation was followed by past one-year and two-year fund outflows; however, mergers were followed by past one-year fund outflows. An additional 1 % net inflow in year t-l (t-2) decreased the liquidation probability by 29.6% (9.0%),
and the odds of being within-family merged decreased by 37.4% for a marginal 1% net inflow in year t-1. This indicates that a fund family tended to get rid of a poor performing fund with consequent two-year cash outflows, but merged a poor performing fund into other funds if it had experienced only one year cash outflows. Because the fund families desired to terminate poor performing funds but preserve their original investors and distribution channels,
they chose the exit form of merger to sweep away funds with poor records provided that the poor performing funds had experienced short-term fund outflowsSurprisingly
,
when taking other determinants into consideration,
the decisions on fund exits were not associated with fund age. One possible reason is that, in Taiwan, though funds are rated when they have at least a three-year history,
their performance is reported and ranked based on the investment interval of three-month, six-month, one-year, three-year, and five-year (see SITCA website). As a resu\t, fund age failed to affect the decision to exit. Finally, a fund exit decision did not depend on the expense ratio, or on whether or not the fundChiao Da Managemenl Reνlew的 1.31 No. 2, 2011 83
was unique in a fund family. Although keeping a unique fund can maintain its
market share, it also entails research and marketing costs. Thus, the trade-off between market share and the cost of keeping a unique fund makes uniqueness have no inf1uence on the exit decision.
With respect to the effect of the interaction term of Net asset f1ow(t-2)x
Performance(t-2) on both liquidation and a within也mily merger
,
a larger than one odds ratio implies the following: the worse the performance in year t-2,
the greater was the effect of fund outf1ows in year t-2 on the possibilities of both liquidation and a within-family merger. Similarly, the more the fund outf1ows, the greater was the effect of poor performance on the possibilities of both liquidation and a within-family merger. Similar results were also found in the interactionterm of Net asset f1ow(t-l)xPerformance(t-l) for the merge case
,
with one additional increase in this interaction term being accompanied by an additional1.2% odds ofbeing merged
To avoid the potential effects from the financial crisis, Table 9 reports the results that exclude data with a Iiquidation date or merge date occurring between
September 2008 and December 2008.4 The results remained qualitatively similar when excluding the financial crisis period. Specifically, the larger the fund outf1ows for a family in the previous year
,
the greater the Iikelihood of liquidation.Poor fund performance and smaller fund size increased the exit probability. A
fund with both poor performing and poor long-term f10ws was more Iikely to be
liquidated, but a poorly performing fund having sho品term fund outf1ows was
merged with other funds within a family. The more the fund outf1ows, the greater was tbe effect of poor performance on the possibilities of both liquidation and a within-family merger
Overall
,
in comparison with tbe hypothesized signs of the potential determinants in Table 1, fund size, fund f1ows, and fund performance had theexpected signs for exits in both liquidations and mergers. Family f10ws also, as expected, had negative effects on decisions to Iiquidate. Though family size and performance
,
objective f10ws and performance,
and fund age were expected to 4 There were 9 fund liquidations and 6 within-family fund mergers from September 2008 to84 The Exil Delerminanls and Wealth Effects in Ihe
Taiwan Mutual Fund /ndustry
negatively affect the decision to liquidate or employ within-family mergers
,
theempirical results did not provide significant evidence for this. Similar inconclusive results were found on the effects of fund numbers at the family level and at the objective level for both liquidations and within-family mergers, and on family f10ws for the within-family merger.5
5.
Wealth and Characteristic Effects Surrounding theR宜erger
Mergers can entail substantial consequences for fund investors. They can
accompany a change in objectives and thereby affect fuωre retums. They can accompany changes in fund fees, which in tum affect investor performance since fund fees have been identified as an important determinant of fund performance (for example
,
see Elton,
Gruber and Busse,
2004). By affecting either portfolioretums or fees
,
mergers can affect investors' wealth. The following sections studythe wealth effects for fund investors
,
and examine whether fund characteristics changed after the merger.5.
1. Fund Performance Surrounding the Merger
This section examines the performance e任ectsupon the investors of target and acquiring funds between the pre-merger and post-merger period. Table 10
presents the alpha of a single-factor model and the alpha of a four-factor model
for both target and acquiring funds. Moreover
,
we also repo此 theobjective-adjusted retums computed as the di在erence between the funds' annual retum and the average retum of all funds in the same investrnent objective
As shown in Table 10, acquiring funds performed better than target funds
regardless of whether they were measured on the basis of one-year or two-year
retums before the merger date. These results held regardless of performance
measures. For example, the single-factor alphas of the acquiring funds were
5 Interestingly, Zhao (2005) has also presented some inconclusive results pe巾iningto family
performance and objective performance, and has posited a significantly negative relationship between tbe probability of liquidation and fund numbers in the investment objective even when the relationship is expected to be inconclusive
Chiao Da ManC/gemenl Reνiew Vol. 31 No. 2, 2011 85
-0.101% in year -1 and -0.020% in year -2, both of whichwere significantly larger than the target funds of -0.455% in year -1 and -0.317% in year -2
If the target funds were merged into the acquiring fun血, the fund family shifted to the combined funds (acquiring funds) the rights of clients who had initially invested in the target funds. Thus
,
investors in the target funds had the chance to share the benefits of the acquiring fund investors. Note that because only the surviving funds could be recorded after mergers,
only the post-merge perforrnance of acqumng funds is reported in Table 10. As shown,
the perforrnance of the combined funds in the postmerger period indicates that target fund investors benefited from the merger activi旬, which is consistent with the findings of Jayaraman,
Khorana and Nelling (2002). Specifically,
the single-factor alpha of the target 臼nds increased 0.312 percent and 0.427 percent from the year preceding the merger to years + 1 and +2,
respectively. The multifactor alpha and the objective-adjusted returns also showed a similar perforrnance improvement of target funds from year.1 to year + 1 and year +2 The improvement of the target shareholders' perforrnance might potentially be attributed to the superior assets of acquiring funds and adrninistrative skills of the surviving fund manager.6On the other hand, because of the deterioration in their fund performance, the acquiring fund investors were not as lucky as the target fund investors
,
a result confirrned by Jayaraman, Khorana and Nelling (2002). In comparison, the one-factor alpha of acquiring funds declined about -0.110% from year -1 to year +1 and -0.023% from year -1 to year +2. Similar results were found when the analysis was based on the objective-adjusted retum and Carhart's four-factor retums. The deterioration in performance subsequent to the merger activity may be due to the inability of the manager to dispose of poorly performing assets that were held by the target funds prior to the merger,
and to the inability to find better investment objects after the merger (Jayaraman,
Khorana and Nelling,
2002). The outcome in this study was consistent with the Iiterature on corporate mergers,
which indicates that investors of acquiring firrns suffer a definite wealth loss
6 Additionally, since we estiroated the perfonnance and other fund characteristics for the four years surrounding the fund merge, only the sample before 2007 was analyzed
。。。、
Table 8
Multinomial Logit Model Estimates for Liquidation and Within-Family Merger
A
OThWhnte hed
c
n
咐
m
uem-otbh,uee個tcrs
ofdamoEIMfne olmybd -suel(lerulvv)naeotll simqoWunas ie dl aalarOte le Bso 2Itth6ime,
n3c。3a
l
d7
umedl dew,d (aM2s )ua d sewSd IzzttOeh,EIEnaF阱vfea
,
sIItanIgnly
ad te mumtuhqte uuadel znshetisnns cd tm lomn tehmre ge aonnaTg lhydeSISvmab叫
nreanb戶
t
lees m,Itnafcno
l
du
r
md川e
s
d nTMdhlcead hte nnuSd Imgfnmbmer1sml,y nct eatan t祖dth
l
sse
eptooins
1
eoe,w恤自s珊,das
,nbd ay npd tehtdeern oe mpdemrocleccne ets,at r{e0tsh)pekecehetwzpIne山
l
ly
y
e ,Variables Modell Modelll
~血110n Within-Mer島er LiquidatÎon Wìthin-Merger
Estimates Chi-square Odds Estimates Chi-square Odds Estimates Chi-square Odds ratio Estimates Chi-squar Odds ratio
raUo raUo e Intercept -2.717 。 974 3.303 1.047 1.904 。863 -0.657 0.078
F陶M……
Ma
目
a咽nl耐叫
flow叫{LLI心2B
I) >叫
0.003 0.994 -0.094 l962Family 0L9elvo el -1.767' 3.146 。 171 。 556 0.481 。573 -0.964... 15.955 。 381 。 189 0.352 0.828 1.020 0.498 2.773 1.833 1.049 6.253 -0.176 0.373 。 839 。 266 1.473 。 767 5.144 1.048 0.006 8.609 1.519 2.385FN陶P…
MMU叩叫向nL喇臨
M
阿時llη
12)l))叫
l蝴
2.219 。 972 0.005 O13l ObJecuvo e 9L9e5 vel 4eH 、,.
0.642 。 200 -0.594 0.151 。 552 H H h -4.572 。 337 0.010 7.174 0.834 0.001 -0.044 。 437 0.957 0.057 。301 。941 Ni b
Z
喜
E
-4.606 。 695 0.010 5.575 0.433 。∞4 Fund LevelSNNA…,
EUNMaUUm咽且uhm叩呵a頁
t
mummal)臨)
Mh叫
E
t叫
4ω
叫
I(
t月
21) ) 4 253 • M ? 0.014 。 943 1.209 。 389 -2.918... 13.920 。 051 -1.412 2.072 。244 。 406." 16.381 0.666 -0.547'" 13.622 。 579 -0.350". 20.310 。 704 -0.469". 17.620 。 626 -0.111'" 62.729 0.895 0.006' 3.038 。 994 -0.094".
81.242 。 910 0.004 1.752 。 996 -0.035" 5.841 0.966 -0.006 。 576 0.994 -0.048... 6.965 。 951 -0.011 0.496 0.989 -0.131... 51.574 0.860 -0.042.. 5.441 。 959 -0.117... 77.515 0.890 -0.043." 8.862 。958 。 108 2.094 1.114 0.095 1.998 1.100 。 681 0.546 1.975 1.664" 5.629 5.280注足~ 意
b b哥
N
H
peoe巾wt
a(s1ry-sn1e)at x nce(1-1) 。 0212.363 1.022 0.012." 8.142 1.012 0.004 0.195 1.004 0.012... 17.431 1.012
nPLeoikrwfeb(l
h
2m.2o)a。
x
nd
cerz(ut-o 2) test staOuOsOulc-s--36.747 l ∞ l 0.000" 4.791 1.0∞ o.的 1... 52.754 1.001 0.002.. 6.291 l ∞2
主位諸音
的 PN S N VE 〉 hEbhg 豆、 H N mE 毛主凶 ~ 害怕 "川 口 ~~ Table 9
Multinomial Logit Model Estimates for Liquidation and Within-Family Merger: ExcIuding Financial Crisis
A three-outcome multinomial logit model was used 10 investigate the distinction among different 叫itfomlS. The fund family can dispose funds by three choices: (0) keep
the fund in the family; (1) liquidate出efund: (2) a within-family mutual fund merge. The variables included fund numbers, n叫刮目tfl側5,and performance 剖thefamily,
。阿ective,and fund level. We also included fund size. age,甜d肌肉ueness田 theanalysis. .**, *., and" indicate significant at the one, five, and ten per臼01,respectively The numbers of observations excluding financial crisis are斜,234 ,respectively
Variables M血lell Modelll
5.580 Family Jevel 2.404 0.882 0.011 0.884 0.395 8.704 0.809 0.891 1.142 9.226 Objecllve level 1.490 0.9日2 3.920 0.024 4.473 0.000 0.906 0.901 1.1 63 ∞o Fund level 0.335 0.521 0.993 0.993 0.987 0.962 1.104 8.355 within-Merger
Estimates Chi-square Odds ratio
Liquidation Chi-square Within-Mergcr
ESlimates Chi-square Odds ratio
Liquidation
Chi 呵uarc Estimates
Fund number(t-l)
Net 355et f1ow(t-l) Net asset flow(t-2) Performance(t-l ) Performance(t-2)
1.649 1.179 。 912 -2.822 。500 Od由 ral10 。 391 0.616 14.188... 1.580 。 939 -9.616 ζ JA 吋 laF LU i 2 日刊 刊 出 un ll 2 心 4202 Od由 ral10 。 976 0.159 27.965 0.895 0.000 1.451 0.044 3.414 0.648 0.315 1.468 Estimates -3.300 。 024 -1.840* 3.331 -0.111 -7.720 lntercept 。 018 -3.737.. -8.463** -0.104 -9.486 。 972 0.114 0 叫劫 。 968 43.589 2.131 1.117 0.974 0.249 0.487 8033i 27631 0120 們 A υ弓 , -oaA Ulil ----3 Fund number(I-I)
Net asset flow(t-I) Net assel 00w(I-2) Perfonnance(t一 1) Pe自nnanc呻-2)
Size(t) Net asset Oow(I-I) Net assel 00w(I-2) Age(t) Perfonnanc峙 1) Perfonnance(I-2) Expense mlio(刊) Uniqueness(t) Net assel flow(t-I)x Perfonnance(t-I) Nel assel flow(t-2)x Perfonnance(t-2) Likclihood ratio test stalistics
。 398 0.615 0.994 。 750 16.824 3.437 -0.922 0.487... 0.006 0.048 0.708 0.902 15.307... 18.275... 79.496". 064 349 030 300 。 604 16.114 3.600 0.888 0.566 3.693 2.044 6.265 -1.093 -0.653." 0.007* -0.007 -0.013 -0.039* 0.099 2.123.. 0.011 0.668 日 894 0.965 0.952 0.876 1.126 2.146 21.528 16.299 60.769 6.616 7.651 52.252 2.076 0.691 -4.4日 2... -0.404... -0.111". -0.036.. -0.049... -0.132... 0.119 。 764 。 950 9.387 -0.051... 0.875 77.611... 。 118 1.012 16.531 0.012... 1.004 。 220 0.004 1.014 8.473 0.014.. 1.024 2.962 0.024* 。。 、4 1.002 6.154 0.002.. 1.001 52.382... 1431.85." 0.001 1.000 2.752 0.000* 1.001 38.339 1603.97". 0.001...
88 The Exit Determinants and Wea/th Effects in the Taiwan Mutua/ Fund Jndustry
Table 10
Performance Changes Following Mutual Fund Mergers
This table pr官sentsthe median values of single司 factoralpha, multifactor alpha and objective-adjusted
retums for target and acquiring funds. Objective-adjusted retums are computed as the difference
between the funds' annual retum and the average retum on all funds in the same investment
objective. We estimated performance for the four years following the fund merger. Year -1 is
one-year prior to the m咕咕ermonth, and year -2 is two-year prior to the merger, etc. The changes of year relative to merger represent the difference of performance between po叫-mergerand pre-merger
periods for all acquiring funds. The first two p-values represent the significance of the di 仔erence
acro俗 thetarget and acquiring funds in the years preceding the merger, and the last two p-values
represent the significance of the characteristic variations for acquiring funds following the merger.
Annualized Performance (%)
Y'ear Relative to Merger Chan!!es ofYear
-2 -1 +1 +2 -lto+1 p-values -lto+2 p-values
Panel A: Single-factor Alpha
Target -0.317 -0.455 。 312 0,041 。 427 0.015 funds Acquiring 疇。 020 -0,101 -0.111 0.040 -0.110 0.036 -0.023 0.078 funds p-values 0.011 0.018
Panel B: Multi-factor Alpha
Target -0.463 -0.652 。 219 0.039 0.578 0.004 funds Acquiring -0.249 -0.332 -0.429 -0.003 0,047 0,022 -0.004 0.023 funds p-values 0.011 0.019
Panel C: Objective-a句 ustedretum Target
-0.100 -0.137 0,045 0.089 。 114 0.054
funds
AhcBqdus lring 0.002 。 468 -0.100 -0.016 -0.192 0.003 -0.122 0.031
ι工alues 0.001 0.004
following a merger in a fiv令year empirical period (e.g" Agrawal
,
Jaffe andMandelk前, 1992).
Table 11 repo口sthe results exc1uding the period of the 2008 global financial
cris的,and confirms the results in Table 10. The target funds performed worse than
the acquiring funds during the pre-merge period. The investors of the target funds
benefited from the merge activity since their retums increased from year -1 to
year + 1 and to year +2, regardless of the retum measure; however, the investors of
acqumng funds suffered from deterioration in performance subsequent to the
Chiao Da Management Reνlew均 1.31No. 2, 2011 89
Table 11
Performance Changes Following Mutual Fund Mergers: Excluding the
Period of Global Financial Crisis
This table presents the median values of single-factor alpha, multifactor alpha and
objective-adjusted retums for target and acquiring funds. Objective-a句 ustedretums are computed
as the difference between the funds' annual retum and the average return on all funds in the same
investment objective. We estimated performance for the four 抖的following the 臼ndmerger. Year
-1 is one-year prior to the merger month, and year -2 is two-year prior to the merger, etc. The
changes ofyear relative to merger represent the difference ofperformance between post-merger and
pre-merger periods for all acquiring funds. The first two p-values represent the significance of the
di缸訪問cein median across the target and acquiring funds in the years preceding the merger, and the
last two p-values represent the significance of the characteristic variations for acquiring funds
following the merger.
Annualized Performance (叫
Year Relative to Merger Changes ofYear
-2 +1 +2 -1 to+1 p-values -1 to +2 p-values
Panel A: Single-factor Alpha
Thanrgdes t -0.072 -0.185 。 167 0.029 。 138 0.033
Acquiring -0.025 -0.006 -0.009 -0.042 -0.049
。 074 -0.040 0.045 funds
p-values 0.051 0.019
Panel B: Multi-factor Alpha
Target -0.264 -0.358 0.201 0.035 。 298 0.027 funds Acquiring -0.197 -0.315 -0.147 -0.034 -0.096 0.017 -0.009 0.038 funds p-values 0.048 0.062
Panel C: Objective-adjusted retum
Target -0.063 -0.032 0.006 0.191 0.033 0.087 funds Acquiring -0.061 0.166 -0.031 0.002 -0.293 0.008 -0.012 0.041 funds 主values 。 204 0.009
5
.2.
Net Asset Flows Surrounding the MergerTable 12 presents the values of net asset flows and objective-adjusted net
asset flows for target and acquiring funds before and after the merger. It is found
that in the pre-merger period both acquiring and target funds experienced negative
net asset flows