行政院國家科學委員會專題研究計畫 期末報告
同業競爭對手迎合或擊敗盈餘預期是否重要呢?(第 3 年)
計 畫 類 別 : 個別型 計 畫 編 號 : NSC 99-2410-H-004-059-MY3 執 行 期 間 : 101 年 08 月 01 日至 102 年 10 月 31 日 執 行 單 位 : 國立政治大學會計學系 計 畫 主 持 人 : 金成隆 共 同 主 持 人 : 梁嘉紋 報 告 附 件 : 移地研究心得報告 公 開 資 訊 : 本計畫涉及專利或其他智慧財產權,2 年後可公開查詢中 華 民 國 102 年 10 月 31 日
中 文 摘 要 : 以往研究顯示,MBE 有較高權評價/較低公債利率.本計畫旨在 探討 MBE 對於私債條款(利率與到期日)的影響. 本計畫發現 MBE 會有較優的債務條款(i.e., 低利率與較長到期日). 進 一步研究發現,主要理由歸因於 the prospect theory 而非 transaction cost theory. 此外,當公司財務困頓或是常常 的公司,MBE 的利益是比較明顯的.
中文關鍵詞: 迎合/擊敗分析師預期,聯貸市場,差價,到期日
英 文 摘 要 : Prior studies find that firms meeting or beating analysts' earnings forecasts (MBE) have higher equity valuation and lower bond yield spread. In contract to those studies, this paper explores a firm's MBE effect on its private loan terms, including price and non-price terms. We find that despite the fact that banks possess superior information access and processing abilities that reduce information asymmetry costs for borrowers, they still impose more favorable price (i.e., lower loan spread) and non-price (longer loan maturity) terms for firms meeting expectations than firms missing expectations. Further analyses indicate that the main explanation for our findings is provided by the prospect theory instead of transaction cost theory. In addition, we find that the benefits of meeting expectation (i.e., lower loan spread and longer maturity) are more pronounced for financially distress firms (habitual beaters) than financially sound firms (sporadic beaters)
英文關鍵詞: Meeting/beating analyst forecast, Syndicate Loan, spread, maturity
1
Does Meeting Analyst Forecasts Matter in Private Loan Market?
Abstract: Prior studies find that firms meeting or beating analysts’ earnings forecasts (MBE) have higher equity valuation and lower bond yield spread. In contract to those studies, this paper explores a firm’s MBE effect on its private loan terms, including
price and non-price terms. We find that despite the fact that banks possess superior
information access and processing abilities that reduce information asymmetry costs
for borrowers, they still impose more favorable price (i.e., lower loan spread) and
non-price (longer loan maturity) terms for firms meeting expectations than firms
missing expectations. Further analyses indicate that the main explanation for our
findings is provided by the prospect theory instead of transaction cost theory. In
addition, we find that the benefits of meeting expectation (i.e., lower loan spread and
longer maturity) are more pronounced for financially distress firms (habitual beaters)
than financially sound firms (sporadic beaters).
2
1. INTRODUCTION
It is well-documented that firms meeting or beating analysts’ earnings
expectations (thereafter MBE) have higher equity valuation (Bartov, Givoly, and
Hayn 2002; Kasznik and McNichols 2002) and lower bond yield spread (Jiang 2008).
However, in addition to public financial market (e.g., equity and public debt), private
loan market becomes a significant source of corporate financing (Altunbas, Gadanecz,
and Kara 2006; Ball, Bushman, and Vasvari 2008).1 The extant studies document
significant institutional differences between the two markets. For example, lenders
across private and public debt markets differ with respect to their access to
information, ability to monitor the borrowers and flexibility in resetting contract terms
(Bharath, Sunder, and Sunder 2008). When private lenders possess superior
information access and processing abilities that reduce information asymmetries
between lenders and borrowers, it is an interesting but unsolved question whether the
extant inferences on MBE can generalize to private debt market. To fill the gap, we
examine whether the presence of MBE affects price (i.e., loan spread) and non-price
(i.e., maturity) loan terms of bank contracts.2
Prior studies indicate that firms have incentive to avoid earnings decreases and
losses, and to meet or beat analysts’ earnings forecasts (Bursthalar and Dichiv 1997;
Degeorge, Patel, and Zeckhauser 1999), and market rewards for meeting or beatinf
these earnings benchmarks (Bartov et al. 2002; Barth, Elliott, and Finn 1999; Brown
and Caylor 2005; Kasznik and McNichols 2002; Skinner and Sloan 2002). In the
1
For example, over the past decade, there have been $780 billion in net debt security issuances, bank loans play a significant role (about 54% of total debt since 1980) (Graham, Li, and Qiu 2008).
2
Regina Wittenberg-Moerman (2009) explores the syndicated loan market to investigate the impact of information asymmetry on loan spread and maturity; Gottesman and Roberts (2004) examine the association between loan spread and maturity to test whether lenders are compensated for longer maturity loans or limit their exposure by forcing riskier borrowers to take short-term loans.Following Regina Wittenberg-Moerman (2009) and Gottesman and Roberts (2004), we focus bank loan terms on interest rate and loan maturity.
3
context of public bond market, Jiang (2008) finds that a firm’s MBE leads to lower
bond spread. On the other hand, Bursthalar and Dichiv (1997) and Degeorge et al.
(1999) present two theories to explain why firms have incentives to meet these targets:
transaction cost theory and prospect theory. The former posits that to reduce
information-processing costs, some firm stakeholders, such as stockholders and
creditors, use earnings benchmarks as heuristics or reference points to evaluate firms’
performance and determine terms of transaction with firms. And the latter argues that
decision makers are more sensitive to losses but less sensitive to gains relative to
some natural reference points. However, the extant literature provides no direct
evidence of which accounts primarily for the incentive for firms to meet or beat
earnings benchmarks. In this paper, we further address this issue.
Our motivation for the examination of loan contracting consequences of MBE
stems from a variety of reasons. First, debt financing, in particular bank loans, is a
major source of external financing in the U.S. and most other countries all over the
world (Bharath et al. 2008; Graham et al. 2008). For example, in 2005 the total new
capital raised in the syndicated loan market was $1,500 billion, and firm bond
issuance amounted to about $700 billion (Bharath et al. 2008). As a result, issue of
whether MBE affects loan terms of bank contracts is of economic importance.
Second, multi-faceted features of private debt contracts enable us to assess not
only direct cost of firm’s MBE (e.g., loan spread), but also the related indirect cost
(i.e., tighter non-price terms such as shorter maturity). For example, Bharath et al.
(2008) find that higher risk is entirely reflected in the interest spread in the case of
public debt. However, in the case of private debt, there is substantial variation in loan
4
alone potentially misestimates the total cost borne by borrowers.3
Third, prior research documents significant institutional differences between the
private and public financial markets. relative to investors in public market (equity and
bond), banks possess superior information-processing abilities and have better access
to private information used to both design the loan terms of the contract (Diamond
1991) and monitor the loan ex post. In addition, borrowers are relatively more willing
to share their proprietary information with a small group of lenders than with disperse
bondholders (Bhattacharya and Chisea 1995).4 Prior studies argues in the public
financial markets that firms meeting expectations reduce the costs imposed in
transaction with stakeholders (e.g., lenders), assuming that stakeholders’ decisions are
often based on heuristic cutoffs at earnings thresholds.5 However, in our private debt
context, due to their better access to information from borrowers and ability to
processing information, that reduce adverse selection costs for borrowers, banks
would be no longer or less likely to use earnings benchmarks as heuristic or reference
points to determine the loan terms. Therefore, MBE in loan market, if any, should be
able to be explained by another theory--- prospect theory. Thus, private loan market
provides a unique setting to examine whether prospect theory framework, alone or to
some degree, can account for MBE.
3
Private loans tend to have more concentrated lenders relative to public debt. In addition, as mentioned later, information access and re-contracting flexibility allow private lenders to customize the price and non-price terms of the debt contract.
4
Private debt contracts typically depend on the flow of confidential information between borrowers and lenders For example, the origination and ongoing maintenance of syndicated loans relies crucially on borrowers providing lenders with confidential information. This confidential information tends to include timely financial disclosures (e.g., quarterly or monthly financial disclosures), covenant compliance information, amendment and waiver requests, financial projections, and plans for acquisitions or dispositions (Bushman, Smith, and Wittenberg-Moerman 2010; Regina Wittenberg-Moerman 2008).
5
Transaction cost theory argues that information-processing costs are sufficiently high that stakeholders determine the terms of transaction with the firm based on the heuristic or reference point such as earnings.
5
The first question to be addressed in this paper is to examine whether and how a
borrower’s MBE has an impact on price and non-price terms of bank loan contracts.
To analyze the impact of MBE on price terms, we examine the effect on the loan
spread. In this paper, loan spread is measured as the amount the borrower pays in
basis points over LIBOR or LIBOR equivalent. Second, by investigating non-price
terms of the contracts, we further analyze whether MBE has effects beyond increasing
the price of bank loan. In this paper, we use bank loan maturity as proxy for non-price
terms of loan contracts.
Using a sample of listed loan firms in Dealscan database during 1996-2011, we
find that, as predicted, loan spread is lower for firms meeting analysts’ expectations
than those falling short of expectations. In addition, we also find that a borrower’s
MBE is translated into a longer loan maturity. Stated differently, we find that firms
meeting expectations have significantly longer loan maturity than those missing
expectations. The results are in line with the argument that a longer maturity due to
MBE induces less frequent refinancing of banks loans to firms meeting or beating
expectations, which allows the borrowers to less frequently renegotiate the loan
contract terms. As a result, the economic effect of a borrower’s MBE on the cost of
loan contracts is likely even higher than that implied by the loan spread decrease
alone.
The second question to be addressed in this paper is whether the more favorable
contract terms due to a borrower’s MBE is more pronounced for firms in financial
distress than for financially sound firms. When a firm in financial distress beats its
earnings expectation, this conveys information about its ability to survive, and thus
the premium to MBE of financially distressed firms is larger than the premium to
6
borrower’s downside risk but do not share in the upside growth potential, we thus
hypothesize in the loan context that the more favorable contract terms due to a
borrower’s MBE is more pronounced for firms in financial distress than for
financially sound firms. The empirical results provide evidence supporting our
predictions. Specifically, we find that the decrease in loan spread and increase in loan
maturity due to MBE are more pronounced for firms in financial distress than for
financially sound firms.
Further analyses indicate that the differential loan spread and maturity due to a
borrower’s MBE are more pronounced for “habitual beaters” than “sporadic beaters”.
In addition, we find that reporting positive earnings or earnings increase is positively
associated with more favorable loan terms, and such an association is much more
pronounced when borrowers are in financial distress.
Recall that the extant literature presents two theories, based on the stakeholder
use of information-processing heuristics and prospect theory, about the motivation for
meeting or beating earnings benchmarks. Since banks possess superior information
access and processing abilities that reduce information asymmetry costs (e.g., adverse
selection costs) by borrowers, transaction cost theory is unlikely to explain our main
findings. To provide direct evidence of whether our results are primarily accounted by
prospect theory, we develop several distinctive empirical models of prospect theory.
The results support our predictions that our MBE findings in the case of private
market is accounted mainly for by the framework of prospect theory.
To ensure the robustness of our findings, we perform a battery of sensitivity
analyses. First, allowing for simultaneity between loan spread and loan maturity does
not influence our primary inferences that a borrower’s MBE leads to a lower loan
7
tranches level. According to Sufi’s (2007) argument that treating multiple facilities on
the same syndicated loan deal as independent observations could lead to erroneously
small standard errors, we repeat our analyses at the deal level as an additional test. All
primary inferences remain unchanged qualitatively.
This paper contributes to the literature on MBE in several ways. First, we
contribute to the MBE literature by documenting that, in addition to public financial
market, MBE also has an effect on private loan market. We find that although banks
possess superior access to information about borrowers, whether to meeting or beating
earnings expectations still affects the loan contract terms. To the best of our
knowledge, this is the first to explore the effect of a firm’s MBE on loan contract
terms in the context of private debt market.
Second, a distinctive feature of our research design is the development of an
empirical model of prospect theory. We document direct evidence that the main
explanation for the findings in this paper is provided by the prospect theory, due to
Kahneman and Tversky (1979). In contrast, prior MBE studies cannot disentangle the
effect of prospect theory from that of transaction cost theory. As a result, our paper
enhances our further understanding of whether and why banks use earnings
benchmarks to evaluate performance when designing loan contract terms.
Third, we also contribute to the MBE literature by documenting that the
presence of meeting or beating earnings expectations has a positive effect on multiple
debt contractual terms in loan market, including lower loan spread and longer loan
maturity. In contrast, prior study finds in the context of equity (bond) market that
MBE affects equity valuation (bond yield spread) alone. The results are in line with
prior findings that information about borrowers affects price and non-price contract
8
et al. 2008), while only the price terms are affected in the case of public debt (Bharath
et al. 2008). Fourth, our paper contributes to MBE literature by providing further
evidence that the differential effect of MBE on loan terms, including price and
non-price terms, systematically varies with firms’ financial position and MBE
recurrence.
Finally, our paper contributes to syndicated loan literature as well. First, we
provide direct evidence that MBE is an important determinant of loan terms and its
effect increases with MBE frequency. Second, despite their relative information
advantage and better information-processing ability, private lenders perceive the
greatest utility and hence offer better loan terms when the borrower’s earnings move
from a relative loss to gain.
The rest of this paper is organized as follows. Section 2 presents literature
review and the hypotheses development. Section 3 describes our sample and research
designs. Section 4 presents the empirical results. Section 5 conducts additional and
sensitivity tests. Finally, section 6 summarizes and presents our conclusions.
2. LITERATURE AND HYPOTHESES
Bursthalar and Dichiv (1997) and Bowen, Ducharme, and Shores (1995) argue
that the information about earnings affects terms of transactions between firms and
their stakeholders; due to the sufficiently higher information-processing costs, some
stakeholders determine terms of transactions with firms based on heuristics, such as
earnings benchmarks. Next, prospect theory posits that the decision maker derives
value from gain and loss with respect to some reference points, and also suggests that
value function is steepest around wealth reference points. Degeorge et al. (1999)
further posit that another salience of thresholds arises from the third psychological
9
about positive and no-positive numbers in human thought processes (Barrow 1992).
As a result, the dividing line carries over for the threshold on absolute earnings. They
argue that when looking at the benchmarks of quarterly earnings and the analysts’
consensus forecasts, there is a salient dividing line between meeting and missing the
norm. Saliency makes the norm itself a focal point, which reinforces its psychological
properties.
Consistent with these two theories, prior work indicates that managers have
incentives to meet or beat the three earnings benchmarks---zero earnings, last year’s
earnings, and analyst’s earnings forecasts (e.g., Bursthalar and Dichiv 1997; Degeorge
et al. 1999) and that meeting earnings benchmarks has a higher equity valuation
(Bartov et al. 2002; Brown and Caylor 2005; Kasznik and McNichols 2002; Lopez
and Rees 2002; Skinner and Sloan 2002). In addition, missing analysts’ expectations
also is associated with career penalties in the form of lower compensation (Matsunaga
and Park 2001; Graham, Harvey, and Rajgopal 2005; Mergenthaler, Rajgopal, and
Srinivasan 2009) and the dismissal of CEO and CFO (e.g., Mergenthaler et al. 2009).
Dechow, Richardson, and Tuna (2003) and Brown and Caylor (2005) further
document that, in recent years, managers’ propensity to meet analysts’ expectations
exceeds their propensity to avoid either losses or earnings decreases. Recently, Jiang
(2008) finds in the context of bond market that firms meeting or beating earnings
benchmarks have lower cost of debt.
This paper explores whether firms meeting analysts’ earnings expectations have
more favorable loan contract terms from the perspective of private lenders. There are
two opposing arguments about the effect of a firm’s MBE on loan contract terms.
Recall that banks possess superior information access and processing ability that
10
their better access to information and ability to monitor the borrowers, banks are less
likely to rely on earnings benchmarks as heuristics or reference points when designing
loan contract terms. Stated differently, based on transaction cost theory, borrowers
have no or less incentive to meet or beat earnings expectations in the case of private
loan.
However, an alternative argument posits that although banks are unlikely to rely
on earnings benchmarks as reference points to determine loan terms, the prospect
theory still can explain the pervasive avoidance of missing analysts’ earnings
expectations. Therefore, it is an empirical question whether banks use MBE
information in pricing private loan. To provide empirical evidence, we establish the
following hypothesis:
H1a: Loan spreads are lower for firms meeting or beating earnings expectations than for firms missing earnings expectations.
Regarding non-price terms, we expect that a borrower’s MBE leads to longer
loan maturity. Recall that banks tend to have lower renegotiation costs than public
bondholders because of their better access to information about borrowers and greater
investment in monitoring the borrowers. This enables private lenders to customize the
price and maturity terms in response to borrowers’ accounting quality. As a result, in
the context of private debt, firms with poor accounting quality have more stringent
price (higher spread) and non-price (shorter maturity) contract terms (Bharath et al.
2008).
Extant literature indicates that lenders tend to limit their exposure through
forcing riskier borrowers to take short-term loans (Gottesman and Roberts 2004). The
rationale for this argument is that a shorter loan maturity leads to more frequent loan
11
the loan terms. Recall that borrowers’ missing expectations signal lenders a worse
future performance, which implies an increase in firm default risk and such an
increase in risk is reflected in less favorable loan terms. In the same vein, we thus
argue in the context of loan maturity that banks limit their exposure through forcing
firms missing expectations to take short-term loans.
However, an alternative view is that a borrower issuing short-term debt can face
costly liquidity at maturity, motivating the borrower to choose longer-term debt
(Gottesman and Roberts 2004). If this is the case, this view will bias against our
prediction that a borrower’s MBE leads to longer loan maturity. We therefore advance
the following hypothesis:
H1b: Loan Maturity is longer for firms meeting or beating earnings expectations than for firms missing earnings expectations.
Bartov et al. (2002) posit that a firm’s MBE conveys information about its ability
to survive if it is in financial distress. Therefore, they find that there is a greater stock
premium to MBE for firms in financial distress than for financially sound firms. In the
context of loan market, we argue that, in addition to signaling future earnings
projections, firms’ MBE may alter lenders’ probability assessment regarding the
future survival of a firm. To the extent that lenders bear the borrower’s downside risk
but do not share in the upside growth potential (Fischer and Verrecchia 1997), we thus
predict that differential loan terms of private contracts due to a borrower’s MBE are
more pronounced for firms in financial distress than for financially sound firms.
Accordingly, we propose our second hypotheses:
H2a: Lower loan spreads due to a borrower’s MBE are more pronounced for financially distressed firms than for financially sound firms. H2b: Longer loan maturity due to a borrower’s MBE is more pronounced
12
3. RESEARCH DESIGN
3.1 Data Source and Sample Selection
We use data from DealScan (provided by the Loan Pricing Corporation), which
covers all publicly-traded loan observations in the period 1996~2011. The DealScan
database, starting in 1986, is an online database that consists detailed bank loan data
for U.S. and foreigner commercial loans made to corporations. The syndicated loan
data are primarily gathered from the Security Exchange Commission or directly
research by LPC through contacts with lenders, borrowers, and other sources. A
syndication loan is provided by a group of lenders with each holding a fraction of the
loan. Syndicated loan deals include multiple loan facilities (or tranches) that differ in
price, type, and maturity (such as a line of credit and a term loan). There is no
straightforward way to identify which facilities are parts of a deal in DealScan. We
use loan facility-level data to study the effect of MBE on price and non-price loan
terms in debt contracts. Our Analysts’ forecasts data comes from I/B/E/S database,
and financial accounting data are retrieved from the Compustat database.
The starting sample includes information on 252,990 completed
dollar-denominated syndicated loan facilities issued between 1986 and 2011. Next, we
eliminate loans to non-U.S. firms, not issued in U.S. dollars, and observations with
missing data. We identify 57,941 loan facilities related to 12,815 borrowers. Third, we
merge accounting data available from Compustat with I/B/E/S, and then match them
with the loans using Robert’s Dealscan-Compustat Linking Database (August 2012
vintage), graciously provided by Michael Roberts.6 We exclude regulated utilities
(SIC codes 4900 to 4999) and financial service firms (SIC codes 6000 to 6999),
6
We thank Michael Roberts for sharing the Compustat-Dealscan link, which is made publicly available through website: http://finance.wharton.upenn.edu/~mrrobert/data_code.htm.
13
because these firms tend to have different capital structures and financing activities
due to regulation. Keeping loans with facility active date from 1996 to 2011 and
deleting observations with missing Compustat/IBES data, our final sample contains
8,494 facilities made to 2,064 borrowing firms.7
[INSERT TABLE 1 HERE]
3.2 Measurement of Earnings Surprises
The timeline that underlies the measurement of our analyst forecast variables is
shown in Figure 1. The firm’s earnings surprise (EarSurp) for quarter t is defined as
the “unadjusted actual” EPS from I/B/E/S minus the last I/B/E/S median EPS forecast,
scaled by the closing price at the beginning of the fiscal quarter.8 We require that
there are at least two analysts providing earnings forecasts for each quarter. As
pointed out in Bartov et al. (2002), the release date of the latest forecast must precede
the current quarter’s earnings announcement by at least 3 trading days. The median of
analyts’ quarterly earnings forecast is used as the consensus analyst forecast to proxy
for quarterly earnings expectations.9 To capture whether a firm meet or beat quarterly
earnings expectations, we construct an indicator variable, MBE, which takes on the
value of one if EarSurp is zero or positive in the closest quarter ahead of loan
initiation date, and zero otherwise.
[INSERT FIGURE 1 HERE]
7
In this paper, we cannot clearly make sure the time lag between deal-active dates and their 10-Q filing dates with the SEC. As a result, to ensure that we only use quarterly accounting information that is publicly available at the time of a loan, we impose the following matching criteria: For a loan initiated on date t, its matching fiscal quarter is assumed to be the most recent quarter before date t minus six months.
8
In order to make the forecast and actual earnings comparable, the individual forecasts within a forecast period are adjusted for stock splits using the CRSP cumulative adjustment split factor retrieved from the CRSP daily files.
9
The results are similar and the inferences are robust to using the mean earnings forecast as the consensus analyst forecast to proxy for earnings expectations.
14 3.3 Measurement of Financial Distress
The Z-score model, created by Altman (1968) is a multiple-variable approach to
the prediction of financial distress, and has been proved to be a powerful diagnostic
tool.10 Following Altman (1968), we use the threshold of 1.81 to distinguish
distressed and financially sound firms.11 We create a binary indicator variable,
DISTRESS, that takes on the value of one if Altman’s Z-score is less than 1.81, and
zero otherwise.
3.4 Empirical Model
Our analysis begins by investigating whether firms meeting earnings
expectations experience more favorable loan terms of the loan contracts than those
that fail to meet expectations. To do so, we estimate the following OLS regression:
u Ind Year Economy Specific Lender Specific Borrower Specific Loan MBE TERM LOAN n n m m l l k k j j i i _ _ _ _ 0 1 (1)
Our second research question is whether the favorable loan terms due to a
borrower’s MBE is more pronounced for firms in financial distress than financially
sound firms. To do so, we augment equation (1) to (2) by adding dummy variable
DISTRESS and interaction term MBE*DISTRESS as follows:
u Ind Year Economy Specific Lender Specific Borrower Specific Loan DISTRESS MBE DISTRESS MBE TERM LOAN n n m m l l k k j j i i _ _ _ _ 0 1 2 3 (2)
In the above regressions, each observation represents a single loan facility. The
dependent variable (LOAN_TERM) refers to one of the following features of a loan
10
The Altman Z-score is defined as Z= 1.2*Working capital / total assets +1.4*Retained earnings / total assets + 3.3*earnings before interest and taxes / total assets + + 0.6*market value of equity / total liabilities + 0.999* net Sales / total assets.
11
Alternatively, we also use the threshold value of 2.0, as adopted by Bartov et al. (2002), to classify firms into distressed and non-distressed firms. The results remain unchanged qualitatively.
15
contract: (1) Loan Spread: defined as the all-in-drawn spread (plus the upfront fee and
annual fee, if any) in basis points over the LIBOR and (2) Maturity: the natural log of
one plus the number of months from the loan issue date to the maturity date. The test
variable MBE in eq. (1) is as previously defined. To be consistent with our predictions,
1 is expected to be negative (positive) when the dependent variable is Loan Spread (Maturity). According to H2a and H2b, we expect the coefficient on MBEDISTRESS in eq. (2), 3, to be negative (positive) for Loan Spread (Maturity).
Following the literature on bank loan contracting (Bae and Goyal 2009; Costello
and Witternberg-Moerman 2011; Graham et al. 2008; Kim, Tsui, and Yi 2011), we
incorporate various loan-specific and borrower-specific control variables and
country-level macroeconomic conditions into our models. The loan-specific control
variables include: (1) Loan Size, the natural log of facility amount; (2) Lenders
Number, the number of lenders; (3) Performance Pricing, an indicator variable that
equals one for loans with performance pricing provisions, and zero otherwise; (4)
Collateral, an indicator variable that equals if the loan is secured with collateral and
zero otherwise; (5) Financial Covenants, the number of financial covenants imposed
by the loan agreement. Borrower-specific control variables include the following: (1)
SIZE, the natural log of total assets in millions of dollars; (2) LEV, defined as the
long-term debt divided by total assets; (3) MB, growth or investment opportunities,
which is measured as the market value of equity plus the book value of debt divided
by total assets; (4) EBITDA, firm profitability, measured by the earnings before
interest, taxes, depreciation, and amortization to total assets; (5) PPE, the ratio of
property, plant, and equipment to total assets; (6) STD_CF, uncertainty of firms’ future
growth, measured as the standard deviation of quarterly cash flows from operations
16
volatility); (7) Z-SCORE, measured by Zmijewski's (1984) probability of bankruptcy
score; (8) AbsDA, borrowers’ informational asymmetry, measured by abnormal
discretionary accruals;12 (9) BIG4, an indicator variable, which equals one if the
borrower is audited by Big4 CPA firm, and zero otherwise; (10) EarSurp, the
magnitude of quarterly earnings surprises which has been previously defined: and (11)
loan types (Term loan, Revolver > 1 yr., Revolver < 1 yr., and 364-day facility) and
Purposes of loan (Corporate purposes, Debt repayment, Working capital, Takeover,
CP backup, and Acquisition).
Country-level microeconomic factors include the following: (1) Term Spread,
the difference in the yield between 10-year and 2-year U.S. Treasury bonds; (2) Credit
Spread, measured by the yield spread between BAA- and AAA-rated corporate bonds.
To control for differences in loan features over year and across industries, we include
Year and Industry dummies in our regressions.
4. FINDINGS
4.1 Univariate Analysis
Table 2 reports the means and univariate results for the tests and the variables on
which our analyses are based, tabulated by firms with MBE=1 and firms with MBE=0,
cross-tabulated by firms with DISTRESS=1 and firms with DISTRESS=0, respectively.
As shown in Table 2, we find that firms meeting earnings expectations have lower
loan spread, longer maturities, larger loan size, a larger number of lenders, higher
probability of performance provisions requirement and lower probability of
collateral’s being pledged than those missing earnings expectations, as predicted.
12
To estimate discretionary accruals, we adopt the Modified Jones Model (Dechow, Sloan, and Sweeney 1995; DeFond and Subramanyam 1998; Kasznik 1999). We use a cross-sectional model to calculate discretionary accruals, where for each quarter we estimate the model for each 2-digit SIC grouping. We require each 2-digit SIC grouping has at least 8 observations per quarter.
17
Regarding loan purposes, the proportions of loans for debt repayment and CP backup
are significantly larger for firms with MBE=0 than those for firms with MBE=1. On
the contrary, the proportions of loans for corporate purposes, working capital,
takeover, and acquisition are significantly larger for firms with MBE=1 than those for
firms with MBE=0. With respect to terms of loan types, banks offer more revolving
loans with maturities exceeding one year, but offer fewer revolving loan with
maturities less than one year and 364-day facility when firms meet earnings
expectations.
The last column of Table 2 reports the differences in means of the variables
between firms with DISTRESS =1 and with DISTRESS =0. It can be seen that firms in
financial distress have higher loan spread, longer loan maturity, greater number of
lenders, the lower probability of performance provisions requirement, the higher
probability of collateral's being pledged, and a larger number of financial covenants
than those of financial soundness. In terms of loan purposes, banks offer more loans
for corporate purposes and debt repayment but fewer loans with the purposes of
working capital, takeover, CP backup and acquisition for firms with DISTRSS=1 than
for firms with DISTRSS=0. With respect to terms of loan types, banks are likely to
offer more term loan, but less revolver loans with maturity exceeding one year and
364-day facility when firms suffer financial distress.
Regarding loan spread and maturity, Table 2 documents the following results: (1)
firms with MBE=1 have lower spread (longer maturity) than firms with MBE=0 by
20.05 bps (3.234 months); firms with DISTRESS=1 have higher spread (longer
maturity) than firms with DISTRESS=0 by 63.36 bps (2.304 months); (2) firms with
MBE=1 have lower spread and longer maturity; (3) firms with MBE=1/DISTRESS=1
18
MBE=0/DISTRESS=1. The results provide preliminary evidence on H1 and H2.13
[INSERT TABLE 2 HERE]
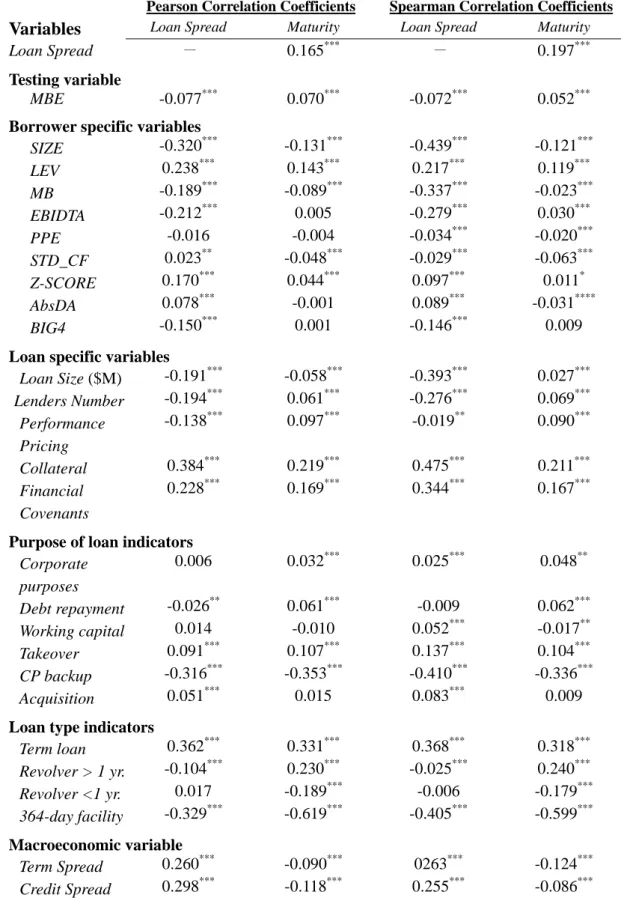
Table 3 reports the Pearson and Spearman correlations between dependent
variables and other related variables in our empirical model. As shown in the table,
MBE is negatively related to Loan Spread but positively related to Maturity, as
predicted. We also find that higher loan spreads are often bundled with smaller loans,
a smaller number of lenders, lower likelihood of performance pricing provisions,
higher probability of collateral requirement, and more financial covenants.
In examining the association of Loan Spread with borrowers’ characteristics, we
find that the loan spread is lower for firms with larger size, lower leverage, higher
growth opportunity, higher EBIDTA, lower cash flows volatility, lower distress
probability, lower AbsDA, and better audit quality, as predicted.
Now, we turn to analyze the correlations of Maturity with loan specific variables.
As predicted, the results are very similar to those of Loan Spread except for the
performance pricing provisions and number of lenders. Next, we find that the maturity
is longer for firms with smaller size, higher leverage, lower growth opportunity, lower
cash flows volatility, and higher distress probability, consistent with our predictions.
Finally, Table 3 reveals that spread is positively associated with Term Spread,
and Credit Spread; Maturity is negatively related to Term Spread and Credit Spread.
[INSERT TABLE 3 HERE]
5.2 Regression Results
The effects of MBE on loan spread and maturity
13
Recall that Gottesman and Roberts (2004) propose the tradeoff hypothesis to explain why there are negative relation between loan spread and loan maturity.
19
Table 4 presents the regression results of testing H1a and H1b after controlling
for all related factors known to be associated with loan spread and maturity,
respectively. Consistent with our predictions, the MBE has a statistically and
economically significant negative effect on the loan spreads (1=-0.077, p-value < 0.01, one-tailed test) and positive effect on the loan maturity (1=0.029, p-value < 0.01, one-tailed test), respectively. The results indicate that firms meeting or beating
analysts’ earnings expectations have more favorable loan terms than firms missing
analysts’ earnings expectations. Accordingly, the empirical results lend support to our
first hypotheses.
With regard to loan characteristics, as expected, the results report that the loan
spread is lower for loan contracts involving larger loan size, a large number of lenders,
higher probability of performance pricing provisions requirement, lower collateral
requirements, and less restrictions of financial covenants. Also, consistent with our
predictions, the maturity is longer for loan contracts involving larger loan size, a large
number of lenders, higher collateral requirements, and a small number of financial
covenants. In terms of borrower characteristics, as expected, lenders will charge a
lower loan spread to borrowers with larger firms, lower leverage, higher growth
opportunity, higher EBIDTA, higher proportion of tangibility assets, lower cash flows
volatility, lower distress probability, and higher audit quality. Moreover, the maturity
is longer for borrowers with higher EBIDTA, lower cash flows volatility, and higher
audit quality. The significantly negative coefficient of the variable SIZE is inconsistent
with our prediction, which reveals that larger firms issue short-term loans to signal
their better credit risk. It also can be seen that there is a positive relation between LEV
and maturity; the plausible reason for this is that firms may adopt low leverage and
20 2003; Billett, King, and Mauer 2007).
In sum, the results, as evidenced in Table 4, loan spreads are lower and debt
maturity is longer for firms meeting or beating earnings expectations than for firms
missing earnings expectations, consistent with our hypotheses H1.
[INSERT TABLE 4 HERE]
The effect of MBE and financial distress on loan spreads and maturity
Our second hypotheses posit that the benefits of MBE in terms of lower loan
spread and longer maturity are greater for firms in financial distress than for
financially sound firms. Table 5 reports the empirical results of testing H2a and H2b.
Panels A and B of Table 5 present the results of a two-by-two analysis of Loan
Spread and Maturity conditional on whether firms meet or beat earnings
expectations and whether their financial position is sound, respectively. An
examination of the two columns in Panel A shows that firms with MBE=1 have
significantly lower loan spread than firms with MBE=0 among firms in financial
distress, but not significantly low among financially sound firms. More importantly,
the benefit of MBE in terms of lower loan spread for financially distressed firms
(-0.117) is significantly greater than that for financially sound firms (-0.034),
consistent with H2a. In the same vein, irrespective of whether firms meet or beat
earnings expectations, financially sound firms have lower spread than financially
distressed firms. In addition, the benefit of financial health in terms of lower loan
spread for firms meeting earnings expectations (0.274) is significantly smaller than
that for firms missing earnings expectations (0.357), as predicted.
Regarding loan maturity, Panel B reveals that the primary inferences are the
21
financial distress, firms meeting or beating earnings expectations have significantly
longer maturity than firms missing earnings expectations. More importantly, the
benefit of MBE in terms of longer maturity for financially distressed firms (0.043) is
significantly greater than that for financially sound firms (0.016).
Panel C presents the results form estimating equation (2). As shown in Column
1 of Panel C, the coefficient of MBE*DISTRESS is statistically and economically
significantly negative (3=-0.084, p-value < 0.05, one-tailed test) in the sense that the benefits of MBE in terms of lower loan spread are more pronounced for financially
distressed firms than financially sound firms. Similarly, Column (2) of Panel C
indicates that, as predicted, the coefficient of MBE*DISTRESS is statistically and
economically significantly positive (3=0.027, p-value < 0.10, one-tailed test), suggesting that the benefits of MBE in terms of longer loan maturity are greater for
financially distressed firms than for financially sound firms. These results provide
supporting evidence on H2a and H2b.
In summary, Table 5 provides strong evidence that the benefits of MBE are
stronger for financially distress firms in private debt market, in line with that in public
financial markets (Bartov et al 2002; Jiang 2008).
[INSERT TABLE 5 HERE]
5.3 Further Analysis
The Effect of firms’ MBE recurrence on loan spread and maturity
Another stream of empirical research finds that firms with patterns of increasing
earnings have higher price-earnings multipliers than others (Barth et al. 1999). Others
further demonstrate that the market premium is more pronounced for firms that
22
do so (“sporadic beaters”) (Bartov et al. 2002; Kasznik and McNichols 2002). These
findings are in line with the “momentum story”.
In this section, we further shed light on the effect of MBE recurrence on loan
terms in the case of private debt market. In doing so, we construct one proxy for MBE
recurrence (FMBE4), measured as the frequency of achieving MBE during the
consecutive four quarters immediately before the matching fiscal quarter for a loan
initiation on date t. To examine this prediction, we restrict our sample to firms
meeting earnings expectations.14 The results are reported in Table 6.
As shown in column (1) of Table 6, the coefficient of FMBE4 is significantly
negative, suggesting that loan spread decreases with frequency of MBE. Similarly, as
shown in column (3) of Table 6, the coefficient of FMBE4 is significantly positive in
the sense that loan maturity increases with frequency of MBE. Overall, the benefits of
MBE in terms of loan spread and maturity increase with MBE frequency.
Next, we examine whether the benefits of habitual MBE are relatively greater
for firms in financial distress. As evidenced by column (2) of Table 6, the coefficient
of FMBE4*DISTRESS is significantly negative, as predicted. In addition, column (4)
of Table 6 shows that the coefficient of FMBE4*DISTRESS is positive but
insignificant. Alternatively, we follow Bartov et al. (2002) and construct a
dichotomous indicator variable HMB4 to identify firms as being ‘‘sporadic beaters’’,
based on the criterion that firms meeting or beating earnings expectations in at least
75% of the previous four quarters. Untabulated results are the same as those in Table
6.
Overall, these results lend support to the argument that the benefits of habitual
14
23
or sporadic MBE in terms of loan spread are relatively greater for financially distress
firms than for financially sound firms. However, this inference is slightly weaker in
the case of loan maturity.
[INSERT TABLE 6 HERE]
Can Prospect Theory account for our findings?
As mentioned earlier, two theories are proposed to account for the MBE:
transaction cost theory and prospect theory. Due to their superior access to the
information from the borrowers, private lenders such as banks are unlikely to rely on
earnings information heuristics or reference points to evaluate borrowers’ credit
worthiness’ credit worthiness when designing loan contract terms. Consequently, we
conjecture that the results in this paper should be primarily accounted for by the
prospect theory, rather than transaction cost theory. In this section, we will take direct
examination of the association between loan contract terms and MBE from the
perspective of prospect theory.
Prospect theory postulates that decision-maker derives value from gain and loss
with respect to some reference points, and also suggests that value function is steepest
around the wealth reference points. Thus, the value function is S-shaped with the
curve concave for gains (implying risk-averse) and convex for losses (implying
risk-seeking), and the corresponding losses is steeper than that for gains. As indicated
by Degeorge et al. (1999), meeting analysts’ earnings forecasts is an important
reference point. We might be able to anticipate that lenders’ risk premium depends on
the loan spread they are willing to pay.
In this setting, the lender derives value from gain and loss with respect to
24
between actual earnings and analysts’ forecast earnings) is a natural reference point
for lenders who estimate wealth as a multiple of loan spread which is negatively
related to earnings. Assuming that firms manipulate wealth measures (changes in
earnings and in turn changes in spreads) to affect the value perceived by lenders, we
expect to observe earnings-increasing management around wealth reference points-
in our setting, in the vicinity of zero changes of unexpected earnings. The above
arguments can be summarized in Panel (a) of Figure 2.
Due to the negative relation between loan spread and actual earnings, we thus
multiply Loan Spread by negative one to convert it into S-shaped value function as
postulated in prospect theory (See Panel (b) of Figure 2).
[INSERT FIGURE 2 HERE]
On the other hand, as noted in Gottesman and Roberts (2004), lenders may be
willing to offer long-term or short-term loans to riskier borrowers at higher spreads at
the same time. Therefore, the association between earnings and the length of loan
maturity is not clear. In our context, we examine the benefits of MBE (i.e., lower loan
spread) and spread-earnings association under the prospect theory framework;
specifically, we examine whether the MBE benefits are greater for losses than for
gains when earnings move from losses to gains relative to analysts’ earnings forecasts.
To test our conjecture, we use the negative of loan spread, denoted Loan
Spread*(-1), as dependent variable and run the following proposed quadratic
regressions for firms meeting or beating earnings expectations and those missing
25 MBE, of group j if _ _ _ ) 1 ( * 0 1 2 2 ij MBE MBE o ijn MBE n ijm MBE m ijl MBE ijk MBE ij MBE ij MBE MBE ij u Ind Year Economy Specific Lender Specific Borrower Specific Loan Earnibgs Earnings Spread Loan p l k (3a) MBE, of group j if _ _ _ ) 1 ( * 0 1 2 2 ij MISS MISS o ijn MISS n ijm MISS m ijl MISS ijk MISS ij MISS ij MISS MISS ij u Ind Year Economy Specific Lender Specific Borrower Specific Loan Earnibgs Earnings Spread Loan p l k (3b)
where Earnings is defined as the Compustat actual earnings; all other variables are as
previously defined. We use 1MBE 22MBEEarnings (1MISS 22MISS Earnings) to measure the extent to which earnings affect loan terms for firms with MBE=1
(firms with MBE=0).15 As such, if prospect theory can explain our findings in Tables
4 and 5, we predict that the MBE benefits functions are steepest around zero
unexpected earnings benchmarks, and are concave in gains and convex in losses
relative to earnings. Stated differently, we expect (1) that 2MBE(2MISS) is negative (positive), and (2) that 1MBE 22MBE Earnings <1MISS 22MISS Earnings. Table 7 summaries the results for models (3a) and (3b).
The left side of Table 7 describes the results of the full sample firms. For our
spread analyses, Panel A indicates that the coefficient of Earnings2, 2MBE(2MISS), is negative (positive) among firms meeting (missing) expectations, as predicted. To
test our second prediction, we first calculate the estimated value of
15
26 Earnings MBE MBE 2 1 2
for every observation with MBE=1 from equation (3a). Similarly, we calculate the estimated value of 1MISS 22MISSEarningsfor every observation with MBE=0 from equation (3b). Next, we compare the mean (median)
of estimated values of 1MBE 22MBEEarnings and that of
Earnings
MISS
MISS
2
1 2
. As revealed in Panel B, the means (medians) of
Earnings
MBE
MBE
2
1 2
are significantly larger than those of
Earnings
MISS
MISS
2
1 2
, contrary to our predictions.
As mentioned above, the slope of the value function in prospect theory is
steepest near the reference point. Therefore, the inconsistent results above may be
driven by the inclusion of firms reporting earnings by large amounts. As such, we
restrict our sample into firm-quarters with earnings surprises that do not exceed the
absolute value of 0.005 (Burgstahler and Dichev 1997).16
The right-hand side of Table 7 shows the results of this subsample. It can be
seen that the coefficient of Earnings2, 2MBE(2MISS ), is significantly negative (positive) among firms meeting (missing) expectations, as predicted. In addition, the
mean (median) of 1MBE 22MBEEarnings are significantly smaller than that of
Earnings
MISS
MISS
2
1 2
, in line with our predictions. More specifically, untabulated results show that about 99% of the estimated values of
Earnings
MBE
MBE
2
1 2
and 1MISS 22MISS Earningsare positive.
Overall, our empirical results provide direct evidence that even though banks
are unlikely to use earnings as a heuristic or reference point to determine loan spread
16
We also use the scaled earnings surprise with internal widths of 0.0025, and the results remain qualitatively unchanged.
27
due to superior access to information about borrowers, the prospect theory framework
still can explain their loan behaviors. The findings in this section are in line with the
argument by Degeorge et al. (1999) that there is a salient dividing line between
meeting and missing the norm and saliency makes the norm itself a focal point, which
reinforces lenders’ psychological properties.
[INSERT Table 7 HERE]
The effects of other earnings thresholds on loan terms
Brown and Caylor (2005) show that, in recent years, managers’ propensity to
meet analysts’ earnings expectations exceeds their propensity to avoid either earnings
losses or earnings decreases. Thus, to shed light on whether the findings on MBE in
public financial markets can generalize to private loan market, we focus our analyses
on the analysts’ earnings forecasts benchmark. In this section, we further explore the
effects of other two earnings thresholds on loan terms--- avoidance of losses and
earnings decreases.
To test for the effect of avoidance of earnings losses on loan terms, we replace
MBE with AvoidLossess in equations (1) and (2). AvoidLossess is an indicator variable
taking the value of one if a firm’s basic earnings per share before extraordinary items
is greater than or equal to 0 at quarter q in year t, and zero otherwise. In addition, for
the set of Borrower_Specific control variables in equations (1) and (2), we replace
EarSurp with EPS to control for the effect of earnings on loan terms. EPS is defined
to be a firm’s basic earnings per share before extraordinary items at quarter q in year t
divided by its stock price at the beginning of quarter q. All other variables are as
previously defined in equations (1) and (2).
28
MBE with AvoidDecreases in equations (1) and (2). AvoidDecreases is an indicator
variable taking the value of one if a firm’s earnings per share before extraordinary
items at quarter q in year t is greater than or equal to the same in year t-1, and zero
otherwise. Further, we replace EarSurp with EarChanges to control for the effect of
earnings on loan terms, where EarChanges is defined to the change in a firm’s basic
earnings per share before extraordinary items between quarter q in year t and quarter q
in year t-1, divided by its stock price at the beginning of quarter q in year t-1. All
other variables are as previously defined.
The results are presented in Table 8. For brevity, we do not report the empirical
results of control variables. Panels A indicates that irrespective of avoidance of
earnings losses or earnings decreases, meeting or beating earnings thresholds has a
lower spread and longer maturity. Panel B shows that all results are broadly
comparable to those in Table 5, indicating that regardless of reporting profits or
reporting earnings increases, the benefits of meeting thresholds are more pronounced
for firms in financial distress than for financially sound firms.
Overall, the findings in Table 8 indicate that although reporting profits and
reporting earnings increases are associated with favorable loan terms, their effects are
stronger when firms are in financial distress.
[INSERT TABLE 8 HERE]
5.4 Additional Robustness Tests
Endogeneity issue
Recall that it is possible that loan spread and loan maturity are determined
jointly. For example, on one hand, borrowers with poor accounting quality tend to
29
other hand, lenders limit their exposure through forcing riskier borrowers taking
short-term loans (Gottesman and Roberts 2004). To address this question, we estimate
the simultaneous equations, in which the loan spread and maturity are jointly
determined.
First, we rely on asset maturity as affecting loan maturity but exogenous to loan
spread. Following Stohs and Mauer (1996), they find that firms with longer-term
asset maturities tend to use longer-term debt. Therefore, for our spread analyses, we
use asset maturity as our instrument for loan maturity.17 Next, we find that MB, PPE,
Z-SCORE and Performance Pricing are insignificant when incorporated into the
maturity model, but significant when incorporated into the loan model. The results
indicate that MB, PPE, Z-SCORE and Performance Pricing are exogenous for
maturity. As a result, for our maturity analyses, we use MB, PPE, Z-SCORE and
Performance Pricing as the instrument variables for loan spread. In sum, asset
maturity is used as the instrument variable for spread analyses, and MB, PPE,
Z-SCORE and PR are used as the instrument variables for maturity model.
The empirical results, as evidenced in Table 9, confirm that allowing for the
joint determination of the loan spread and maturity does not affect our primary
inferences.
[INSERT TABLE 9 HERE]
Analysis unit of loans
The analyses presented here so far are based on the facility or tranches level, as
opposed to deal level. In this section, we repeat analyses of Hypotheses 1 and 2 at the
17
Following Johnson (2003), asset maturity is (gross property, plant, and equipment, PPE)/total assets) × (gross PPE/depreciation expense) + (current assets/total assets) × (current assets/ cost of goods sold).
30
deal level.18 The untabulated results indicate that all results remain unchanged
qualitatively in the deal-level analyses. Therefore, our conclusions are robust to
different analysis unit of loans.
6. Conclusions
Prior studies on MBE document in the context of public financial market that
firms meeting or beating earnings expectations have higher equity valuation and lower
bond yield spread. In this paper, we examine whether the extant findings on MBE
can generalize to private loan market. Specifically, we investigate in the context of
private loan market whether firms meeting or beating analysts’ expectations have
favorable contractual loan terms than firms missing expectations.
Using a sample of listed loan firms in Dealscan database during 1996-2011, we
first find that firms meeting or beating earnings expectations have lower loan spread
and longer loan maturity than those falling to meeting earnings expectations,
consistent with our predictions. Second, we find that the benefits of MBE, in terms of
lower loan spread and longer maturity, are more pronounced for firms in financial
distress than financially sound firms. Third, the results indicate that the benefits of
MBE increase with the frequency of a borrower’ MBE.
In private loan market, due to superior access to borrowers’ information and
ability to process information, banks are unlikely to use earnings as a heuristic or
reference point to determine loan terms. However, further analyses do find that private
lenders’ loan behaviors can be explained by prospect theory framework. Specifically,
in our analyses of MBE benefits, as proxied by lower loan spread, and earnings
18
The spread and maturity of a deal are computed using the average of each facility. The respective qualitative loan features we observe for each loan deal are binary variables by identifying if any facility belonging to the same deal contains specific loan feature. As to the respective quantitative loan features, we also take the average of each facility to be our research variables at deal level.
31
association, we find that MBE benefits functions are concave in gains and convex in
losses relative to earnings, in line with prospect theory.
Finally, we explore the effects of other two earnings thresholds, avoiding
earnings losses and avoiding earnings decreases, on loan terms, and find that the
effect of avoiding earnings losses is stronger than that of avoiding earnings decreases,
and the effects of these two thresholds are more pronounced for firms in financial
distress than for financially sound firms.
32 APPENDIX Variable Definitions Test variables
MBE An indicator variable taking a value of one if a firm meeting or beating earnings expectations, and zero otherwise.
Firm-specific variables
SIZE Defined as the natural log of total assets in millions of dollars (data mnemonic ATQ).
LEV Defined as the long-term debt (data mnemonic LTQ) / total assets (data mnemonic ATQ).
MB Measured as the market value of equity plus the book value of debt (data mnemonic CSHOQ * data mnemonic PRCCQ + data mnemonic ATQ - data mnemonic CEQQ) / total assets (data mnemonic ATQ).
EBIDTA Earnings before interest, taxes, depreciation, and amortization (data mnemonic OIBDPQ) / total assets (data mnemonic ATQ).
PPE Net property, plant, equipment (data mnemonic PPENTQ) / total assets (data mnemonic ATQ).
STD_CF Cash-flow volatility, defined as the standard deviation of quarterly cash flows from operations ( quarterly data item OANCFY) / total assets (data mnemonic ATQ) over the past four fiscal years before the loan initiation year.
Z-SCORE The probability of the bankruptcy score based on Zmijewski (1984), with higher values indicating a higher probability of distress. The distress score is calculated as follow:
Z-SCORE=
where z*=-4.336-4.513*(Net Income/Total Assets)+5.679*(Total Liabilities/Total Assets)+0.04*(Current Assets/Current Liabilities).
AbsDA To measure the accrual-based earnings management, we adopt the Modified Jones Model (Jones, 1991) and use a cross-sectional model to calculate discretionary accruals, where for each year we estimate the model for each 2-digit SIC grouping. We require each 2-digit SIC grouping has at least 8 observations per year. The accrual-based earnings management is measured as the residuals obtained by estimating the following regression:
ACCjt ASSETjt1
0t
1ASSETjt1
1t
SALESjt ASSETjt1
2t
PPEjt ASSETjt1
jtBIG4 Indicator variable equal to 1 if the auditor is one of the Big 4 auditors, and 0 otherwise.
Loan-specific variables
Loan Spread Measured by all-in spread drawn, which is calculated as the amount the firm (borrower) pays in basis points over LIBOR (or LIBOR equivalent) for each dollar drawn down. This measure adds the borrowing spread of the loan over LIBOR with any annual fee paid to the bank group (data are obtained from the LPC Dealscan database).
Maturity The natural log of one plus maturity; maturity is defined as the maturity period of the bank loan measured with the number of months (data are obtained from the LPC Dealscan database).
Loan Size The natural log of the dollar amount of loan facility (data are obtained from the LPC Dealscan database).
Lenders Number
The natural log of one plus the number of lenders; the number of lenders is defined as the number of lending banks for each loan facility.
Performance Pricing
Indicator variable equal to 1 if loan contract includes performance pricing options, and 0 otherwise.
Collateral Indicator variable equal to 1 if the loan facility is secured with collateral, and 0 otherwise.
33
APPENDIX (continued) Financial
Covenants
Financial Covenant Index constructed by counting the number of financial covenants contained in the loan contract, including: (1) Max. capital expenditure (2) Min. fixed charge coverage, (3) Min. debt service coverage, (4) Min. interest coverage, (5) Min. cash interest coverage, (6) Max. leverage ratio, (7) Max. debt to cash flow, (8) Max. senior debt to cash flow, (9) Max. debt to tangible net worth, (10) Max. debt to equity, (11) Min. current ratio, (12) Min. quick ratio, (13) Min. tangible net worth, (14) Min. net worth, (15) Max. loan to value, (16) Min. EBITDA, (17) Max. debt to EBITDA, (18). Max. senior debt to EBITDA.
Loan purpose Corporate purposes
An indicator variable taking the value of 1 if the loan is issued for corporate purposes and 0 otherwise.
Debt repayment
An indicator variable taking the value of 1 if the loan is issued for debt repayment and 0 otherwise.
Working capital
An indicator variable taking the value of 1 if the loan is issued for working capital and 0 otherwise.
Takeover An indicator variable taking the value of 1 if the loan is issued for takeover and 0 otherwise.
CP backup An indicator variable taking the value of 1 if the loan is issued for CP backup and 0 otherwise.
Acquisition An indicator variable taking the value of 1 if the loan is issued for acquisition and 0 otherwise.
Loan type
Term loan An indicator variable taking the value of 1 if the loan’s type is term loan and 0 otherwise.
Revolver >1 yr.
An indicator variable taking the value of 1 if the loan’s type is revolver greater than one year and 0 otherwise.
Revolver <1 yr.
An indicator variable taking the value of 1 if the loan’s type is revolver less than one year and 0 otherwise.
364-day facility
An indicator variable taking the value of 1 if the loan’s type is 364-day facility and 0 otherwise.
Macroeconomic variable
Term Spread The difference in the yield between 10-year and 2-year U.S. Treasury bonds measured one month before the loan becomes active (data are obtained from the Federal Reserve Board of Governors).
Credit Spread The difference in the yield between BAA- and AAA-rated corporate bonds measured one month before the loan becomes active ( data are obtained from the Federal Reserve Board of Governors).