Regional Variation of Industrial Development in Taiwan:
An Overview
Ts’ui-jung Liu
* 本文原刊於劉翠溶、石守謙(主編),《經濟史、都市文化與物質文化:第三屆國際學會議論文集》, (臺北:中央研究院歷史語言研究所,2002 年 6 月)。頁 225-264。 AbstractTaiwan is a small island with different topography that undoubtedly helps in shaping human settlements and production activities ever since the Han Chinese people migrated to open up the island. Motive power machines were introduced into Taiwan during the Japanese colonial period and symbolized the beginning of industrial development on the island. However, it was only in the late 1970s that the share of heavy industry overrode that of light industry. The speed and the structural change of industrial development in Taiwan have already been well documented and studied. This paper only attempts to investigate into regional variations of industrial development with a focus on manufacturing industry.
摘 要 臺灣是一個具有多樣地形條件的島嶼,自從漢人渡海來臺拓墾以後,這些地形條 件無疑的對聚落及生產活動之型態有所影響。動力機器在日本殖民統治時期引進 臺灣,象徵近代工業之起始。然而,直到 1970 年代末期,臺灣重工業的比重才 真正超過輕工業,確定了工業結構的轉型。有關臺灣工業發展的史料相當豐富, 既有之研究成果亦多。本文之目的僅在於以製造業為焦點,來探討臺灣工業發展 在區域間之差異。 * 中央研究院臺灣史研究所籌備處研究員兼主任。
Introduction
This paper aims at giving an overview of Taiwan’s industrial development with a focus on regional variation of the manufacturing industry. By 1860 the rice and sugar processing industries were two major components of Taiwan’s manufacturing. This state of industrial structure changed slightly up until 1895 when Taiwan was ceded to Japan as a result of China’s defeat in the first Sino-Japanese War. Modern industry was introduced into Taiwan in the Japanese colonial period (1895-1945). The industrial structure, however, did not change very much throughout the colonial period despite that the colonial government began to emphasize the heavy industry’s development in 1933. After recovering from World War II, the share of heavy industry eventually exceeded that of light industry in 1978, indicating a transformation of the industrial structure in Taiwan. In this paper I will first present a general view with time series data to show the changing structure of the manufacturing industry before and after World War II. I will then discuss regional variations of manufacturing industries since the 1950s by using census data.
1. A Brief Overview
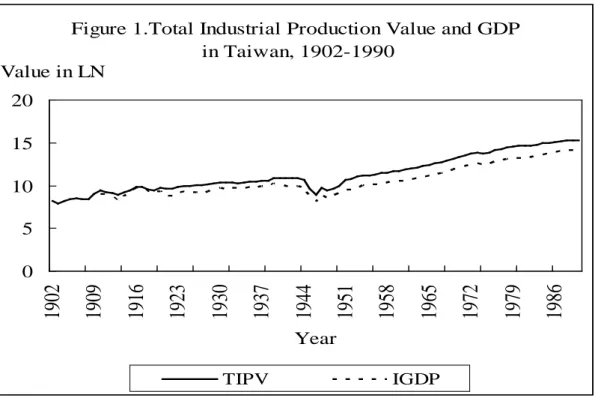
Scholars have done many studies on Taiwan’s industrial development with focuses on different aspects and periods. Among them, Yeh Shu-jen, a professor of economic history at National Taiwan University, has done a succinct yet comprehensive study on Taiwan’s industrial development in a historical perspective.1 It is convenient to summary her findings here to provide a background. Yeh Shu-jen took manufacturing industry as a representative because it had the largest share in the industrial sector and its structure was closely related to Taiwan’s income distribution. With the time series data provided by Yeh, the total industrial production value (TIPV) and industrial gross domestic products (IGDP) during 1902-1990 were calculated in natural log and depicted in Figure 1; their growth rates are illustrated in Figure 2. The annual growth rate of TIPV was 6.73 per cent during 1902-1942 and 12.71 per cent during 1953-1990. Except during the First and Second World War periods, both TIPV and IGDP grew faster and the growth rates appear to be more stable after the 1950s than before.
1
Yeh Shu-cheng 葉淑貞, “Ts’ung li-shih chiao-tu p’o-hsi Taiwan chan-hou kung-yeh fa-chan te t’e-cheng 從歷史角度剖析臺灣戰後工業發展的特徵 (An analysis on features of Taiwan’s post-war industrial development from a historical perspective)”, in Chung-kuo hsien-tai-shih chuan-t’i-yen-chiu pao-kao 中國現代史專題研究報告第 17 輯 (Topics on history of contemporary China, Vol. 17), ed. by The Historical Material Center of the Republic of China (Taipei: The Historical Material Center, 1995), 508-610.
Figure 1.Total Industrial Production Value and GDP in Taiwan, 1902-1990 0 5 10 15 20
1902
1909
1916
1923
1930
1937
1944
1951
1958
1965
1972
1979
1986
Year Value in LN TIPV IGDPSource: Yeh Shu-jen, “Ts’ung li-shih chiao-tu p’o-hsi Taiwan chan-hou kung-yeh fa-chan te t’e-cheng 從歷史角度剖析臺灣戰後工業發展的特徵”, pp. 590-595.
Figure 2. Growth rate of TIPV and IGDP in Taiwan 1903-1990 -1.5 -1 -0.5 0 0.5 1 1903 1908 1913 1918 1923 1928 1933 1938 1943 1948 1953 1958 1963 1968 1973 1978 1983 1988 Year Growth Rate TIPV IGDP
Source: See Figure 1.
During the Japanese colonial period, motive power machines were gradually introduced into Taiwanese factories. Available statistics showed that the number of these factories increased from 642 in 1915 to 6,150 in 1936, an increase of nearly 10 times. These factories used 17,078 horsepower in 1918 and 234,574 horsepower in
1940, an increase of more than 13 times. The production value of the industrial sector grew 6.73 percent annually during 1902-1942, although fluctuated quite drastically in short terms by 1924. The production value of the industrial sector in 1939 was 633 million-yen, while that of agricultural sector was only 522 million-yen. This indicated that the economic structure for the first time changed towards favoring the industrial sector in the late 1930s.
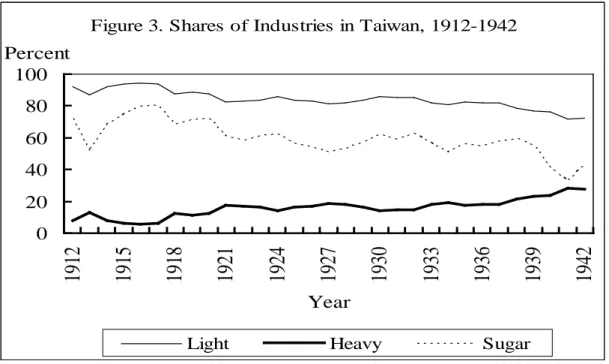
As for the structure of the industrial sector per se, light industry shared 92 percent in 1912 and until 1942 it still counted for 72 percent. Furthermore, among light industries, the share of food and beverages manufacturing was as high as 81 percent until 1942; and sugar manufacturing was the leading one throughout the colonial period (see Figure 3). Due to a demand for Taiwanese sugar in Japan and the colonial government’s promotion, sugar production increased rapidly and enormously. In terms of average annual production quantity, it was 50 million-catty in 1902-1905 and 830 million-catty in 1931-1935. The share of sugar production value in 1939 still counted for more than 50 percent of Taiwan’s total industrial production value.
Figure 3. Shares of Industries in Taiwan, 1912-1942
0 20 40 60 80 100
1912
1915
1918
1921
1924
1927
1930
1933
1936
1939
1942
Year PercentLight Heavy Sugar
Source: See Figure 1.
After Taiwan’s restoration in 1945 and after a short period of political turmoil and hyperinflation in 1946-1949, production activities gradually resumed. Calculated in 1986 prices, the total industrial production value in 1953 was NT$63,721 million which surpassed the highest amount ever reached in the colonial period, NT$52,850 million in 1942. It was in 1953 that the government began to undertake the first four-year economic planning project, which was consequently succeeded by later projects.
From 1953 onward, the government’s industrial policy could be traced in three phases: (1) the import-substitution phase from 1953 to 1960, (2) the export-expansion phase from 1961 to 1972, and (3) the phase of industrial structure adjustment from 1973 and onwards. The third phase could be sub-divided with 1978 as a landmark; the first sub-phase emphasized a general development of chemical and heavy industries while the second one pursued development of strategic industries.
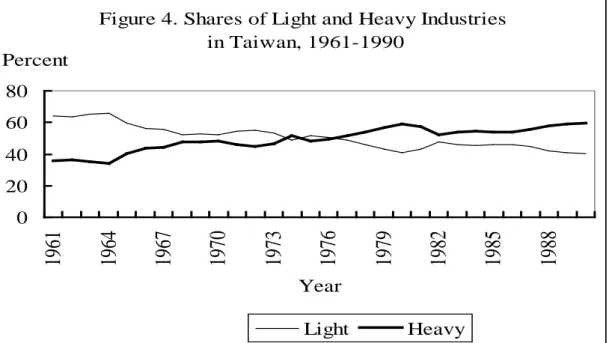
In the 1950s the government encouraged labor-intensive industries to substitute for imports. During 1961-1972, with the Regulation for Promoting Investment announced in 1960, the industries promoted by the government were mainly for exports. The third phase began with ten major construction projects initiated in 1973 and further reinforced with an announcement in 1979 to undertake a ten-year planning project from 1980 to 1989. Figure 4 shows the shares of light and heavy industries in 1961-1990. Although the gap between shares of light and heavy industries had been narrowing down by the end of the Japanese colonial period, it was closing up by the late 1960s. After a lingering period due to the oil crisis in 1974-1976, the two industry groups finally switched their positions after 1978. This demonstrates that the industrial structure underwent more substantial change since then.
Figure 4. Shares of Light and Heavy Industries in Taiwan, 1961-1990 0 20 40 60 80
1961
1964
1967
1970
1973
1976
1979
1982
1985
1988
Year Percent Light HeavySource: See Figure 1.
Both before and after World War II, the government industrial policies emphatically influenced the course of Taiwan’s industrial development. However, there were also negative impacts of these policies. Under the Japanese colonial rule, the predominance of sugar manufacturing encouraged by the government prevented other light industries, which could have beneficially utilized local raw materials, from
being developed. Since the 1950s, negative impacts of the government industrial policies could be reviewed from two aspects. First, too much government interference sometime caused distortions in resource allocation; and second, too little attention was paid to some areas and thus could not satisfy the need of industrial development. The first aspect was well argued in regard to high tariffs, regulation and protection in trade as well as net benefits of the regulation for promoting investments. As for the second aspect, criticisms were focused mostly on insufficient government investments in construction of infrastructure, technological innovation research, pollution prevention and environmental protection.
2. Regional Variations of Industrial Development
With an overview with aggregate data as shown above, this section will present the regional variation of Taiwan’s industrial development with census data. Taiwan’s first census on industry and commerce was taken for the year 1954 and the second one for the year 1961. Since then, a census of industry and commerce was taken every five years and thus there are already nine censuses of this genre by the end of the twentieth century. Because the scope of coverage was slightly different in 1954 and 1961, the data of these two censuses are not fully utilized in this paper. The census data have an advantage in providing details that can be reorganized according to the need of a specific study. Statistics available in these census reports are arranged mostly by detailed items of industries and some have breakdowns by counties and cities. For a study of regional variation, it is necessary to reorganize these data by region. Before doing that, let us first get a general view of the composition of Taiwan’s industrial sector.
2.1 The Composition of the Industrial Sector
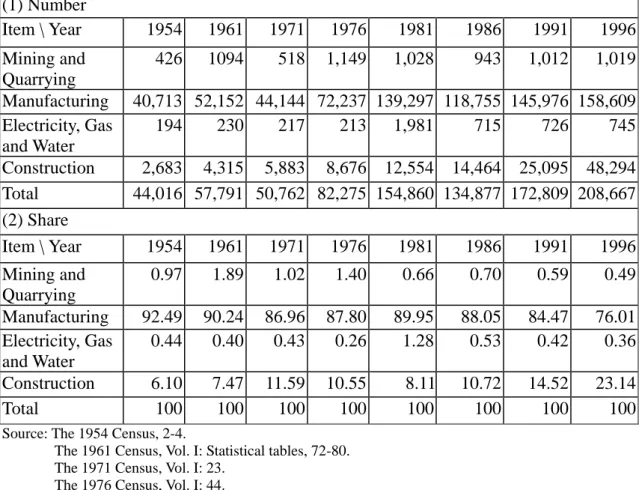
The census data show that Taiwan’s industrial sector consists of four main industries: (1) mining and quarrying, (2) manufacturing, (3) electricity, gas and water supply, and (4) construction. The number and share of establishment units of these industries during 1954-1996 are listed in Table 1.
Thus we see that the manufacturing industry has the lion’s share; the percentage of this industry accounted for 92 percent in 1954 and remained around 85-89 percent until 1991; however, it declined to 76 percent by 1996. It is notable that the number of establishment units in construction increased remarkably between 1991 and 1996; there was an increase of nearly 92 percent, compared to only 9 percent in manufacturing. Moreover, in terms of value added, which indicates the efficiency of industrial management, there was an increase of 2.5 percent between 1991 and 1996
for construction, compared to a decrease of 1.2 percent for manufacturing.2 Apparently, the structure of the industrial sector per se was changing in recent years and the construction industry requires further study. However, this paper will limit the discussion only to the manufacturing industry with regional variation.
Table 1: Number and Share of Establishment Units in Taiwan’s Industrial Sector (1) Number Item \ Year 1954 1961 1971 1976 1981 1986 1991 1996 Mining and Quarrying 426 1094 518 1,149 1,028 943 1,012 1,019 Manufacturing 40,713 52,152 44,144 72,237 139,297 118,755 145,976 158,609 Electricity, Gas and Water 194 230 217 213 1,981 715 726 745 Construction 2,683 4,315 5,883 8,676 12,554 14,464 25,095 48,294 Total 44,016 57,791 50,762 82,275 154,860 134,877 172,809 208,667 (2) Share Item \ Year 1954 1961 1971 1976 1981 1986 1991 1996 Mining and Quarrying 0.97 1.89 1.02 1.40 0.66 0.70 0.59 0.49 Manufacturing 92.49 90.24 86.96 87.80 89.95 88.05 84.47 76.01 Electricity, Gas and Water 0.44 0.40 0.43 0.26 1.28 0.53 0.42 0.36 Construction 6.10 7.47 11.59 10.55 8.11 10.72 14.52 23.14 Total 100 100 100 100 100 100 100 100
Source: The 1954 Census, 2-4.
The 1961 Census, Vol. I: Statistical tables, 72-80. The 1971 Census, Vol. I: 23.
The 1976 Census, Vol. I: 44.
The 1981 Census, Vol. I: Statistical tables, 108-115. The 1986 Census, Vol. I: Statistical tables, 226-227. The 1991 Census, Vol. I: Statistical tables, 328. The 1996 Census, Vol. I: Statistical tables, 318. 2.2 Classification by Regions
In order to reorganize the data by region, this paper adopts the four-region divisions set by the Executive Yuan in 1979 with groupings of cities and counties as follows:3
The North region: Taipei City, Keelung City, Taipei County, Ilan County, Taoyuan County and Hsinchu County (with Hsinchu City upgraded to a provincial
2
The 1996 Census, Vol. 1: 29-31.
3
Liu Ts’ui-jung 劉翠溶, “Pa-shih-nien-lai Taiwan te tu-shih fa-chan 八十年來臺灣的都市發展 (Urban development in Taiwan in the past eighty years)”, in Proceedings of Conference on Eighty Years History of the Republic of China, 1912-1991 ed. by the Conference Symposium Editorial Committee (Taipei: Modern China Publisher, 1991), Vol. 4: 530-572.
city in 1982).
The Central region: Taichung City, Miaoli County, Taichung County, Changhua County, Nantou County, and Yunlin County.
The South region: includes Kaoshiung City, Tainan City, Chiayi County (with Chiayi City upgraded to a provincial city in 1982), Tainan County, Kaohsiung County, Pingtung County, and Penghu County.
The East region: Taitung County and Hualien County.
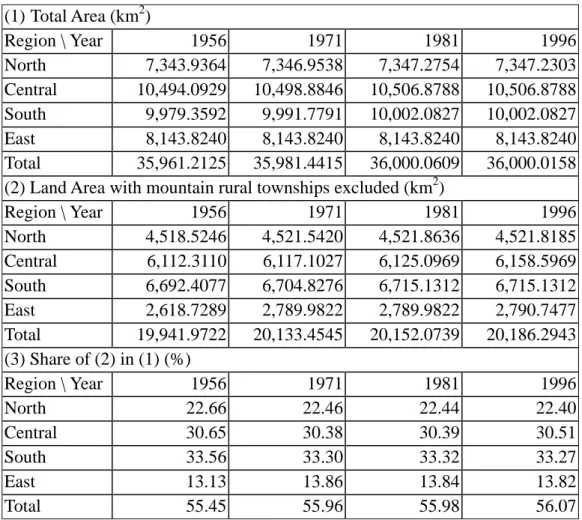
The cities and counties included in the four regions have a total land area of around 36,000 square kilometers. Because Taiwan is an island with mountainous terrain, it is better to make an adjustment of the land area figure by deducting the mountainous areas which are not all suitable for building manufacturing factories. With available land areas of the mountain rural townships, it is possible to subtract at least these mountain areas to get an adjusted land area for each region and the result is listed in Table 2.
Table 2: The Land Area in Taiwan (1) Total Area (km2) Region \ Year 1956 1971 1981 1996 North 7,343.9364 7,346.9538 7,347.2754 7,347.2303 Central 10,494.0929 10,498.8846 10,506.8788 10,506.8788 South 9,979.3592 9,991.7791 10,002.0827 10,002.0827 East 8,143.8240 8,143.8240 8,143.8240 8,143.8240 Total 35,961.2125 35,981.4415 36,000.0609 36,000.0158 (2) Land Area with mountain rural townships excluded (km2)
Region \ Year 1956 1971 1981 1996 North 4,518.5246 4,521.5420 4,521.8636 4,521.8185 Central 6,112.3110 6,117.1027 6,125.0969 6,158.5969 South 6,692.4077 6,704.8276 6,715.1312 6,715.1312 East 2,618.7289 2,789.9822 2,789.9822 2,790.7477 Total 19,941.9722 20,133.4545 20,152.0739 20,186.2943 (3) Share of (2) in (1) (%) Region \ Year 1956 1971 1981 1996 North 22.66 22.46 22.44 22.40 Central 30.65 30.38 30.39 30.51 South 33.56 33.30 33.32 33.27 East 13.13 13.86 13.84 13.82 Total 55.45 55.96 55.98 56.07
Source: For 1956, 1971 and 1981, see Liu Ts’ui-jung, “Pa-shih-nien-lai Taiwan te tu-shih fa-chan 八十年來臺灣的都市發展”, p. 533. For 1996, see The Population Statistics of Taiwan and Fukien Area,The Republic of China, 1996, pp. 250-253.
The adjusted land area shown in Table 2 reveals that with the exclusion of mountain rural townships, only 56 percent of Taiwan’s land area are left for consideration. As shown in Table 3, the land area used by Taiwan’s manufacturing industries increased from 58.66 km2 in 1966 to 242.61 km2 in 1996, an increase of four-fold in 30 years. In 1996, all manufacturing establishment units used 1.2 percent of the land area, excluding mountain rural townships, and most of these were distributed along the western part of Taiwan from north to south. In terms of density, there were 15 manufacturing establishment units per square kilometer in the North region in 1996; this number was almost double of the average. Compared with the number in 1966, the density had increased seven-fold in the North; while on the average, the increase was 5.5 times.
Table 3: Land Area Used by Manufacturing Establishments and the Density (1) Land Area Used by Manufacturing Establishments (km2)
Region 1966 1971 1976 1981 1986 1991 1996 North 38.1737 44.2369 65.3592 72.9623 69.9591 76.9559 84.9443 Central 8.3606 24.7656 35.6575 44.5912 41.4499 54.3357 56.6198 South 11.5459 36.8850 59.7376 73.0357 65.8516 87.0200 95.2465 East 0.5772 3.1724 4.6985 6.3038 5.1662 6.8108 5.7997 Total 58.6574 109.0599 165.4527 196.8929 182.4268 225.1224 242.6103 (2) Percentage of Land Area Used by Manufacturing Establishments
Region 1966 1971 1976 1981 1986 1991 1996 North 0.84 0.98 1.45 1.61 1.55 1.70 1.88 Central 0.14 0.40 0.58 0.73 0.68 0.89 0.92 South 0.17 0.55 0.89 1.09 0.98 1.30 1.42 East 0.02 0.11 0.17 0.23 0.19 0.24 0.21 Total 0.29 0.54 0.82 0.98 0.91 1.12 1.20
(3) Density of Manufacturing Establishments in Taiwan (number per km2)
Region 1966 1971 1976 1981 1986 1991 1996 North 2.18 3.46 5.99 8.07 11.04 13.81 15.27 Central 1.55 2.39 4.16 5.62 6.80 4.53 9.09 South 1.28 1.88 2.77 3.31 3.84 4.53 4.81 East 0.34 0.45 0.42 0.51 0.49 0.48 0.45 Total 1.44 2.19 3.59 4.69 5.89 7.24 7.86
Source: The 1966 Census, Vol. 3: 19-20; The 1971 Census, Vol. 3: 34-61; The 1976 Census, Vol. 3: 740-741; The 1981 Census, Vol. 3: 294-297; The 1986 Census, Vol. 3: 392-393; The 1991 Census, Vol. 3: 382-383; The 1996 Census, Vol. 3: 318-319.
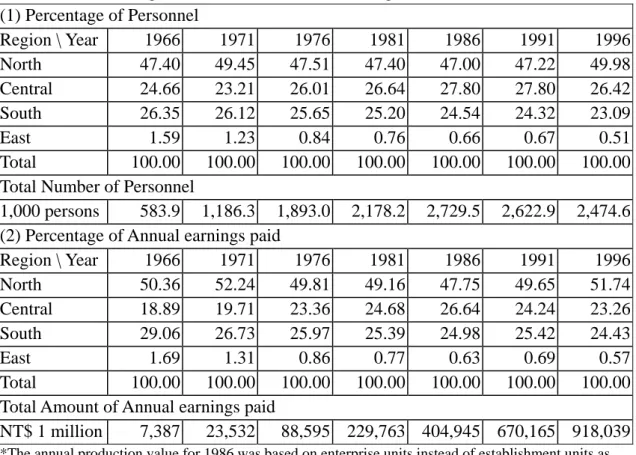
In addition to land area used by manufacturing establishments in four regions, comparisons can also be made with the number of people engaged and annual earnings paid. Table 4 lists the data in two parts: Part (1) shows the percentage of personnel employed in manufacturing and part (2) that of annual earnings paid. It is clear that the North region had a share of around 50 percent in these two aspects throughout the entire study period. This further demonstrates the concentration of manufacturing in northern Taiwan.
Table 4: Regional Variation of Manufacturing in Taiwan, 1966-1996 (1) Percentage of Personnel Region \ Year 1966 1971 1976 1981 1986 1991 1996 North 47.40 49.45 47.51 47.40 47.00 47.22 49.98 Central 24.66 23.21 26.01 26.64 27.80 27.80 26.42 South 26.35 26.12 25.65 25.20 24.54 24.32 23.09 East 1.59 1.23 0.84 0.76 0.66 0.67 0.51 Total 100.00 100.00 100.00 100.00 100.00 100.00 100.00 Total Number of Personnel
1,000 persons 583.9 1,186.3 1,893.0 2,178.2 2,729.5 2,622.9 2,474.6 (2) Percentage of Annual earnings paid
Region \ Year 1966 1971 1976 1981 1986 1991 1996 North 50.36 52.24 49.81 49.16 47.75 49.65 51.74 Central 18.89 19.71 23.36 24.68 26.64 24.24 23.26 South 29.06 26.73 25.97 25.39 24.98 25.42 24.43 East 1.69 1.31 0.86 0.77 0.63 0.69 0.57 Total 100.00 100.00 100.00 100.00 100.00 100.00 100.00 Total Amount of Annual earnings paid
NT$ 1 million 7,387 23,532 88,595 229,763 404,945 670,165 918,039
*The annual production value for 1986 was based on enterprise units instead of establishment units as the data for the latter are not available, see The 1986 Census, Vol. 3: 15.
Sources: See Table 3.
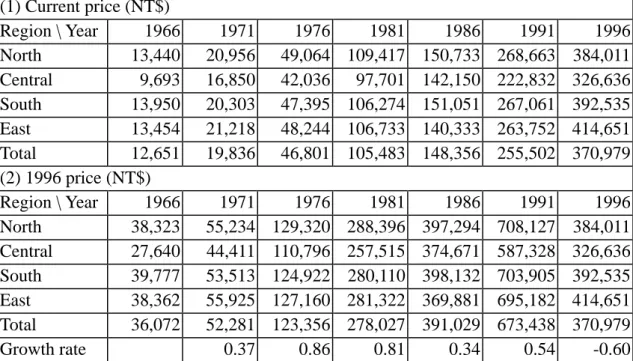
Comparison can be further made with per capita earnings. The data are listed in Table 5 in two parts: (1) in terms of current price and (2) in terms of 1996 prices and the growth rate calculated with the total. Figure 5 shows the earnings per person in 1996 prices. It is clear that earnings per person in the Central region fell below the average throughout the entire period and ranked at the bottom except in 1986. This may imply that the Central region had more small-sized, labor-intensive manufacturing than other regions. It is notable that earnings per person in the North and South regions were above the average throughout, but neither region occupied the top rank throughout. It is remarkable that earnings per person in the East region jumped to become the highest in 1996. If we look into the original data, we can see
that this leap came from Hualien County, which had on the average, earnings of NT$ 421,378 per person in that year.4 Why was this so?
Table 5: Per capita annual earnings of manufacturing, 1966-1996 (1) Current price (NT$) Region \ Year 1966 1971 1976 1981 1986 1991 1996 North 13,440 20,956 49,064 109,417 150,733 268,663 384,011 Central 9,693 16,850 42,036 97,701 142,150 222,832 326,636 South 13,950 20,303 47,395 106,274 151,051 267,061 392,535 East 13,454 21,218 48,244 106,733 140,333 263,752 414,651 Total 12,651 19,836 46,801 105,483 148,356 255,502 370,979 (2) 1996 price (NT$) Region \ Year 1966 1971 1976 1981 1986 1991 1996 North 38,323 55,234 129,320 288,396 397,294 708,127 384,011 Central 27,640 44,411 110,796 257,515 374,671 587,328 326,636 South 39,777 53,513 124,922 280,110 398,132 703,905 392,535 East 38,362 55,925 127,160 281,322 369,881 695,182 414,651 Total 36,072 52,281 123,356 278,027 391,029 673,438 370,979 Growth rate 0.37 0.86 0.81 0.34 0.54 -0.60
Figure 5. Earning per person in Taiwan's Mnufacturing by Region, 1966-1996 (in 1996 price)
0
200000
400000
600000
800000
1966
1971
1976
1981
1986
1991
1996
Year
1996 NT$North Central South East Total
Source: See Table 3; for price index, see The 1999 Statistical Almanac, p. 360.
With statistics from the census of 1991 and 1996, we see that five industries in Hualien increased in the number of establishment units.5 These industries were
4
The 1996 Census, Vol. 3: 318.
5
petroleum and coal products (from 7 to 11), plastic products (from 6 to 8), basic metal products (from 11 to 14), fabricated metal products (from 172 to 206), and machinery and equipment (from 43 to 49). Although data of earnings in each industry is not available with breakdowns by county level, earnings per person in petroleum and coal products was NT$ 892,317 and in basic metal products was NT$ 440,583, both were much higher than the average.6 Thus, we may guess that the jump in the earnings per person in Hualien came mainly from the increase in petroleum and basic metal manufacturing.
As for the growth rate of earnings per person in terms of 1996 prices, it grew in general until 1991 and the rate was faster in 1976 and 1981, but there was a 60 percent decline between 1991 and 1996. The regional difference in growth rate was rather negligible.
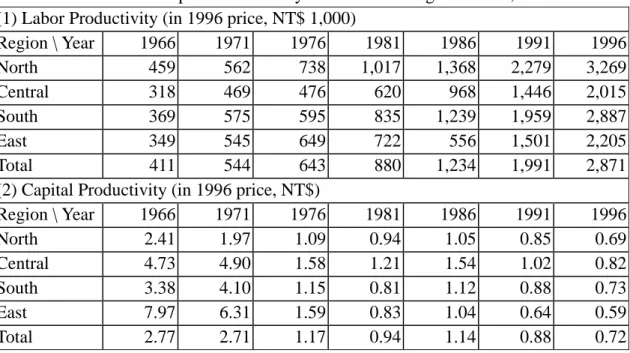
A comparison of labor productivity and capital productivity can also be made with the available data based on enterprise units, instead of establishment units. Labor productivity is calculated as annual production value per person (total production value divided by total number of personnel). Capital productivity is calculated as the average production value produced per NT dollar value of assets operating at the end of the year (total production value divided by total value of assets). The data are adjusted with the whole sale price index by taking 1996 as a base year. The results are listed in Table 6 and depicted in Figures 6.1 and 6.2.
Table 6: Labor and Capital Productivity of Manufacturing in Taiwan, 1966-1996 (1) Labor Productivity (in 1996 price, NT$ 1,000)
Region \ Year 1966 1971 1976 1981 1986 1991 1996 North 459 562 738 1,017 1,368 2,279 3,269 Central 318 469 476 620 968 1,446 2,015 South 369 575 595 835 1,239 1,959 2,887 East 349 545 649 722 556 1,501 2,205 Total 411 544 643 880 1,234 1,991 2,871 (2) Capital Productivity (in 1996 price, NT$)
Region \ Year 1966 1971 1976 1981 1986 1991 1996 North 2.41 1.97 1.09 0.94 1.05 0.85 0.69 Central 4.73 4.90 1.58 1.21 1.54 1.02 0.82 South 3.38 4.10 1.15 0.81 1.12 0.88 0.73 East 7.97 6.31 1.59 0.83 1.04 0.64 0.59 Total 2.77 2.71 1.17 0.94 1.14 0.88 0.72 6
Figure 6.1. Labor Productivity of Taiwan's Manufacturing by Region, 1966-1996 (in 1996 price)
0
1000
2000
3000
4000
1966
1971
1976
1981
1986
1991
1996
Year
NT$ 1,000North Central South East Total
Figure 6.2. Capital Productivity of Taiwan's Manufacturing by Region, 1966-1996 (in 1996 Price)
0 2 4 6 8 10 1966 1971 1976 1981 1986 1991 1996 Year NT$
North Central South East Total
Source: The 1966 Census, Statistical Tables, Vol. 3: 19-20;
The 1971 Census, Vol. 3: 34-41, 224; The 1976 Census, Vol. 3: 16-17; The 1981 Census, Vol. 3: 12-13, 56; The 1986 Census, Vol. 3: 14-15; The 1991 Census, Vol. 3: 14-15; The 1996 Census, Vol. 3: 14-15. For price index, see The 1999 Statistical Almanac, 360.
The North region had the highest labor productivity, except in 1971 when the South was higher than the North by a small margin. The Central region had the lowest labor productivity, as was the case of earnings per capita. On the whole, labor productivity increased almost 600 percent between 1966 and 1996.
As for capital productivity, the East region ranked at the top in 1966 and 1971 and was about the same with the Central region in 1976, but since then the East fell to the bottom until 1996. The Central region took the lead in capital productivity from 1981 to 1996. The North region ranked at the bottom from 1966 to 1976 and next to
the bottom from 1986 to 1996, while in 1981 it ranked the second, next only to the Central region. On the average, capital productivity decreased 74 percent, with the East decreasing more drastically by 93 percent.
The increasing labor productivity may imply an improvement in the living standard of manufacturing employees. However, the declining capital productivity may not be so desirable for investors. A summary quoted at current price reveals that comparing 1996 with 1991, only four among the 22 categories of manufacturing had an increase in capital productivity. These four categories were wood and bamboo products (4.48%), wearing apparel (2.88%), machinery (2.41%), and printing processing (1.64%). The decreases in capital productivity were mostly more than 10 percent, and the most serious cases were found in petroleum and coal (-30.12%), food and beverages (-29.49%), transport equipment (-16.50), non-metallic mineral (-15.87%), plastic (-15.38%), chemical matter (-15.15%), precision instruments (-14.78%) and electric and electronic machinery (-12.77%). Nevertheless, the profit rate remained around 7 percent for manufacturing as a whole.7
2.3 Regrouping of Manufacturing Industries
Individual industries may be grouped into broader categories in order to analyze the manufacturing sector further. There are different ways of regrouping. For instance, one study regrouped the 22 manufacturing industries classified by the 1996 census into four types: the urban technical-intensive type, the urban labor-intensive type, the local resources-relying type, and the basic materials-providing type.8 The advantage of this re-grouping highlights characteristics of urban vs. rural as well as labor vs. technical intensive. However, the industries grouped under the local resources-relying type are not so appropriate as raw materials for textile mills, such as cotton and wool, are not locally produced.
To make it easy, this paper simply adopts a classification according to the nature of manufacturing into four types in the following way:9
Type I: Industries directly related to livelihood. This type includes (1) food processing, (2) beverages and tobacco, (3) textile, (4) wearing apparel and accessories, (5) wood and bamboo products, (6) furniture and fixtures, (7)
7
The 1996 Census, Vol. 3: 1-22.
8
Lin Chien-yuan 林建元, 《Taiwan-sheng kung-yeh fa-chan ts’e-lueh chi kung-yeh-chu she-chih chu-wei fen-pu chih yen-chiu 台灣省工業發展策略及工業區設置區位分佈之研究 (A study on the policy of industrial development and location distribution of the industrial zones in Taiwan province)》 (Nantou: Taiwan Provincial Government, 1999), 24-25.
9
non-metallic mineral products, and (8) miscellaneous items.
Type II: Metal and machinery industries. This type includes (9) basic metal, (10) fabricated metal products, (11) machinery and equipment and (12) transport equipment.
Type III: Chemical industries. This type includes (13) leather and fur products, (14) pulp and paper products, (15) printing processing, (16) chemical matter, (17) chemical products, (18) petroleum and coal products, (19) rubber products, and (20) plastic products.
Type IV: Electric and electronic industries. This type includes (21) electrical and electronic machinery, and (22) precision instruments.
With this classification, the data are reorganized and summarized in Table 7 and further cross-classified into two parts: (1) the shares of four types calculated by region (Table 7.1 and Figure 7.1) and (2) the shares of four regions calculated by type (Table 7.2 and Figure 7.2). On the whole, Table 7 shows that the number of manufacturing establishment units increased from 28,771 in 1966 to 158,609 in 1996; there was an increase of 5.5 folds in 30 years. Apparently, these manufacturing establishment units were not evenly distributed by region and by type.
Table 7: Distribution of Taiwan’s Manufacturing Establishment Units, 1966-1996 Total: by Region
Year North Central South East Total N
1966 34.30 32.91 29.66 3.13 28,771 1976 37.48 35.22 25.42 1.88 72,237 1981 38.62 36.37 23.50 1.50 94,542 1986 42.04 35.07 21.73 1.16 118,755 1991 42.80 35.44 20.85 0.91 145,976 1996 43.52 35.31 20.37 0.79 158,609 Total: by Type
Year Type I Type II Type III Type IV Total N
1966 65.86 17.72 14.22 2.20 28,771 1976 44.20 31.20 19.98 4.62 72,237 1981 37.59 35.64 20.67 6.11 94,542 1986 33.17 36.18 22.55 8.10 118,755 1991 28.25 39.27 22.60 9.89 145,976 1996 23.80 43.88 21.88 10.44 158,609
Source: The 1966 Census, Vol. 3:159-168; The 1976 Census, Vol. 3.1: 742-757; The 1981 Census, Vol. 3: 456-457;
The 1986 census, Vol. 3:466-489; The 1991 Census, Vol. 3: 414-437;
These cross tabulations help to discern some facts. Table 7.1 shows that in 1966, Type I industries predominated in every region: 58 percent in the North, 70 percent in the Central, 68 percent in the South, and 92 percent in the East. However, the share of Type I declined steadily through time in every region. On the whole, it declined from 66 percent in 1966 to 44 percent in 1976 and further down to 24 percent by 1996. It is also notable that in the East region, Type I remained predominant with a share of 55 percent in 1996.
Type II ranked next to Type I in 1966 in every region. However, the share of Type II increased to become the largest from 1981 in the Central region and from 1986 in the North and the South regions. On the average, the share of Type II increased from 17.7 percent in 1966 to 43.9 percent in 1996, an increase of nearly 2.5-fold.
In every region, the share of Type III was also increasing, but not as rapidly as Type II. Except that in the East region where the share of Type III was only 3.8 percent in 1966 and 9.3 in 1996, the shares in other regions were mostly around 20 percent from 1976 to 1996. On the whole, the share of Type III increased from 14.2 percent in 1966 to 21.9 percent in 1996, an increase of 1.5-fold.
In every region the share of Type IV was the smallest. The North was the only region where the share of Type IV was above 10 percent since 1981. On the whole, the share of Type IV was only 2.2 percent in 1966 and 10.4 percent in 1996, an increase of 5-fold.
Table 7 also shows that the North region apparently had the largest share of manufacturing establishment units and its share increased from 34 percent in 1966 to 44 percent in 1996. The leading position of the North region was particularly remarkable in Type IV, as the share of the North region in this type was around 65 percent throughout (Table 7.2d and Figure 7.2d). The Central region competed with the North in leading Type II; the difference in their shares accounted merely 1.4 percentage points (39.9% and 38.5%) in 1996. (Table 7.2b and Figure 7.2b)
Moreover, the North, the Central, and the South regions each shared about one-third of Type I in 1966, but the share of the South region reduced to 22 percent in 1996. Thus, in 1996, the North region took the lead in Type I with a difference of 3 percentage points higher than the Central (39.7% and 36.7%). The East region’s shares in the four types of manufacturing were all very small, only about 2 percent in Type I and below 1 percent in the other types. On the whole, the shares of the North and the Central regions were increasing while those of the South and the East regions were decreasing. (Table 7.2a and Figure 7.2a)
As mentioned above, there was an increase in the number of establishment units in five industries in Hualien County in 1996, however, the total number of manufacturing establishment units in the East region declined from 1,326 to 1,260
between 1991 and 1996 (Table 7.1d) This indicates that the policy proposed recently to move industries to the East coast has not been successfully carried out so far. Perhaps from the viewpoint of environmental conservation, it is better not to develop industry too fast there.
Table 7.1: Classified by Region 7.1a The North Region
Year Type I Type II Type III Type IV Total N
1966 58.18 19.48 18.30 4.04 9,868 1976 39.81 31.00 21.40 7.78 27,078 1981 35.07 32.33 22.19 10.41 36,512 1986 31.33 32.42 23.58 12.67 49,924 1991 25.91 35.39 23.50 15.20 62,485 1996 21.69 38.81 23.40 16.10 69,032
7.1b The Central Region
Year Type I Type II Type III Type IV Total N
1966 69.80 17.38 11.58 1.24 9,468 1976 43.76 34.13 20.21 1.90 25,440 1981 37.76 39.17 20.39 2.69 34,389 1986 33.09 40.28 23.16 3.47 41,651 1991 28.98 43.84 22.75 4.44 51,727 1996 24.75 49.64 20.84 4.77 56,003
7.1c The South Region
Year Type I Type II Type III Type IV Total N
1966 67.65 17.47 13.53 1.35 8,534 1976 47.99 29.21 18.74 4.06 18,361 1981 39.10 36.62 19.58 4.69 22,220 1986 35.02 37.43 20.42 7.12 25,805 1991 30.39 39.95 21.06 8.61 30,438 1996 25.46 45.09 20.93 8.52 32,314
7.1d The East Region
Year Type I Type II Type III Type IV Total N
1966 91.68 4.44 3.77 0.11 901 1976 88.06 7.07 3.98 0.29 1,358 1981 74.52 19.77 5.28 0.42 1,421 1986 67.85 24.80 6.55 0.80 1,375 1991 61.46 27.98 9.20 1.36 1,326 1996 54.60 35.08 9.29 1.03 1,260
Figure 7.1a: The North Region 0 20 40 60 80 1966 1976 1981 1986 1991 1996 Year %
Type I Type II Type III Type IV
Figure 7.1b: The Central Region
0 20 40 60 80 1966 1976 1981 1986 1991 1996 Year %
Type I Type II Type III Type IV
Figure 7.1c: The South Region
0 20 40 60 80 1966 1976 1981 1986 1991 1996 Year %
Figure 7.1d: The East Region 0 20 40 60 80 100 1966 1976 1981 1986 1991 1996 Year %
Type I Type II Type III Type IV
Table 7.2: Classified by Type 7.2a Type I: livelihood Industries
Year North Central South East Total N
1966 30.30 34.88 30.47 4.36 19,849 1976 33.77 34.87 27.60 3.77 31,929 1981 36.03 36.54 24.45 2.98 35,538 1986 39.70 34.99 22.94 2.37 39,393 1991 39.25 36.34 22.43 1.98 41,240 1996 39.67 36.71 21.80 1.82 37,746
7.2b Type II: Metal and Machinery Industries
Year North Central South East Total N
1966 37.69 32.28 29.24 0.78 5,099 1976 37.25 38.52 23.80 0.43 22,537 1981 35.04 39.98 24.15 0.83 33,691 1986 37.67 39.05 22.48 0.79 42,967 1991 38.58 39.56 21.21 0.65 57,321 1996 38.49 39.94 20.93 0.64 69,604
7.2c Type III: Chemical Industries
Year North Central South East Total N
1966 44.15 26.79 28.23 0.83 4,091 1976 40.16 35.63 23.84 0.37 14,431 1981 41.47 35.88 22.27 0.38 19,540 1986 43.97 36.02 19.68 0.34 26,778 1991 44.53 35.67 19.43 0.37 32,984 1996 46.55 33.63 19.49 0.34 34,701
7.2d Type IV: Electric and Electronic Industries
Year North Central South East Total N
1966 63.13 18.51 18.20 0.16 632 1976 63.08 14.46 22.34 0.12 3,340 1981 65.82 16.01 18.07 0.10 5,773 1986 65.77 15.02 19.10 0.11 9,617 1991 68.80 15.92 19.16 0.12 14,431 1996 67.14 16.15 16.63 0.08 16,558
Figure 7.2a Type I: Livelihood Industries
0 10 20 30 40 1966 1976 1981 1986 1991 1996 Year %
North Central South East
Figure 7.2b Type II: Metal and Machinery Industries
0 10 20 30 40 1966 1976 1981 1986 1991 1996 Year %
Figure 7.2c Type III: Chemical Industries 0 10 20 30 40 50 1966 1976 1981 1986 1991 1996 Year %
North Central South East
Figure 7.2d Type IV: Electric and Electronic Industries
0 20 40 60 80 1966 1976 1981 1986 1991 1996 Year %
North Central South East
3. Regional Variation in the Development of Industrial Zones
Regional variations can also be seen in the development of industrial zones. The industrial zones were established to provide industrial land for investors and to use the land efficiently. In Taiwan, there are four categories of industrial zones. The first category is established in the urban planning areas according to the Urban Planning Act. The second category is established at the non-urban, fourth-grade land classified for construction use according to the Regulation of Non-urban Land Use. The third category is established according to the Regulation for Promoting Investment issued in 1960 and furthermore according to the Regulation for Upgrading the Industry issued in 1991; this category is also known as a designated (pien-ting 編
定) industrial zone. These three categories of industrial zones are distributed all over cities and counties. The fourth category is established particularly for processing industry especially for export near Kaohsiung and Taichung harbors.10
Taiwan’s first designated industrial zone was developed at Liutu 六堵 in Keelung City. It took five years from 1960 to 1965 to complete the development of this industrial zone. By 1997, there were 95 designated industrial zones that had been developed with 13,421 hectares of land in Taiwan. In 1998, seven of the 95 designated industrial zones were dissolved and re-registered under the category of urban industrial zone. Table 8 shows land areas used for the first three categories of industrial zones in 1998.
Table 8 shows that the total land area of industrial zones is 52,348 hectares, of which the North region shares 35 percent, the Central region 33 percent, the South region 29.5 percent, and the East region 2.5 percent. The urban industrial zones have 23,323 hectares and share 44.6 percent of the total area; the non-urban industrial zones have 17,602 hectares and share 33.6 percent; and the designated industrial zones have 11,422 hectares and share 21.8 percent. Furthermore, of the urban industrial zones, the North region shares 36 percent, the Central region 26 percent, the South region 35 percent and the East region 3 percent. Of the industrial zones located at non-urban, fourth-grade construction land, 46 percent are in the Central region, 37 percent in the North region, 15 percent in the South region and 2 percent in the East region. Of the designated industrial zones, 40 percent are in the South region, 31 percent in the North region, 26 percent in the Central region and 2 percent in the East region.
Looking into the details of individual cities and counties, we see that the urban industrial zones are mostly located in five counties in the order of magnitude as follows: Taichung (13.3 %), Taoyuan (12.1 %), Taipei (11.8 %), Tainan (10.4 %) and Kaohsiung (10.2 %). The non-urban industrial zones are mostly located in three counties: Changhua (24.1 %), Taoyuan (19.7 %), and Yunlin (10.7 %). The designated industrial zones are mostly located in Taoyuan County (19.4 %), Kaoshiung City (10.3 %) and Kaohsiung County (9.2 %). In short, industrial zones are concentrated in the North region in Taipei and Taoyuan Counties, in the Central region in Taichung and Changhua Counties and in the South region in Kaohsiung City and Kaohsiung County.
10
Ch’en Sheng-ch’ang 陳慎昌, “Kung-yeh-ch’u te k’ai-fa yu kung-yeh fa-chan 工業區的開發與工業 發展 (The development of industrial zones and the industrial development)”, T’u-ti kai-ke 土地改 革 (Land Reform Monthly), 23.5-6 (1973): 28-31. Kung-yeh-ch’u k’asi-fa kuan-li nien-pao, pa-shih-pa nien-tu 工業區開發管理年報,八十八年度 (The annual report of the industrial zone’s management, 1999), Ch. 5.
Table 8: Land Area of Industrial Zones (area in hectare)
Region, City and County
Total Land Area of Industrial Zones Urban Industrial Zones Designated Industrial Zones Non-urban 4th Grade Construction Land
Area % Area % Area % Area %
North Region 18,325.58 35.00 8,300.57 35.59 3,578.00 31.32 6,447.01 36.62 Taipei City 514.53 0.98 514.53 2.21 - - - - Keelung City 670.99 1.28 625.42 2.68 30 0.26 15.57 0.09 Taipei County 3,897.29 7.44 2,761.11 11.84 486 4.25 650.18 3.69 Ilan County 2,134.99 4.08 613.97 2.63 236 2.07 1,285.02 7.30 Taoyuan County 8,503.59 16.24 2,822.00 12.1 2,221.00 19.44 3,460.59 19.66 Hsinchu County 1,987.57 3.80 429.18 1.84 593 5.19 965.39 5.48 Hsinchu City 616.62 1.18 534.36 2.29 12 0.11 70.26 0.40 Central Region 17,295.46 33.05 6,095.54 26.14 3,019.00 26.46 8,177.92 46.46 Taichung City 1,375.34 2.63 794.34 3.41 581 5.09 - - Miaoli County 2,421.65 4.63 685.04 2.94 749 6.56 987.61 5.61 Taichung County 4,232.81 8.09 3,112.34 13.34 452 3.96 668.47 3.80 Changhua County 5,458.81 10.43 683.63 2.93 523 4.60 4,249.18 24.14 Nantou County 1,172.86 2.24 349.34 1.50 435 3.81 388.52 2.21 Yunlin County 2,633.99 5.03 470.85 2.02 279 2.44 1,884.14 10.70 South Region 15,434.52 29.48 8,155.22 34.97 4,601.00 40.26 2,678.30 15.22 Kaohsiung City 2,055.07 3.93 878.07 3.76 1,177.00 10.3 - - Chiayi County 1,616.07 3.09 545.21 2.34 615 5.38 455.86 2.59 Chiayi City 232.39 0.44 232.39 1.00 - - - - Tainan County 4,271.97 8.16 2,420.44 10.38 928 8.12 923.53 5.25 Tainan City 1,400.96 2.68 1,202.96 5.16 198 1.73 - - Kaoshiung County 4,017.69 7.67 2,370.26 10.16 1,052.00 9.21 595.43 3.38 Pingtung County 1,840.37 3.52 505.89 2.17 631 5.52 703.48 4.00 East Region 1,292.66 2.46 771.51 3.31 222 1.94 299.15 1.70 Taitung County 201.33 0.38 148.48 0.64 22 0.19 30.85 0.18 Hualien County 1,091.33 2.08 623.03 2.67 200 1.75 268.3 1.52 Total 52,348.22 100 23,322.84 100 11,422 100 17,602.38 100
Source: 1.The data of urban industrial zones from the Ministry of Interior.
2.The data of designated industrial zones from the Ministry of Economic Affairs. 3.The data of the fourth-grade construction land from investigation of 1997.
The Industrial Development Bureau (IDB) of the Ministry of Economic Affairs has carried out an investigation over 79 designated industrial zones and thus some details are now available. In terms of the number of factories, the top five industrial zones are Wuku 五股 (1,153) in the North, Taichung 台中 (846) in the Central, Tafa 大發 (549) and Anping 安平 (531) in the South, and Nankang 南崗 (463) in the Central. These five industrial zones are all characterized as a synthetic zone.
The distribution of major industries at designated industrial zones is also available to some extent. Table 9 lists available statistics in 1999 and Table 10
summarizes the shares of the top five industries in each region.
Table 9: Regional Shares of Firms located at the Designated Industrial Zones in Taiwan in 1998
Industry \ Region North Central South East Total
N % N % N % N % N % Food 167 4.55 212 5.64 208 6.39 6 2.20 593 5.41 Tobacco 0 0.00 9 0.24 1 0.03 0 0.00 10 0.09 Textile 313 8.53 168 4.47 90 2.76 0 0.00 571 5.21 Apparel 73 1.99 23 0.61 50 1.54 3 1.10 149 1.36 Leather 23 0.63 40 1.06 25 0.77 0 0.00 88 0.80 Wood & Bamboo 37 1.01 89 2.37 45 1.38 3 1.10 174 1.59 Furniture 59 1.61 90 2.40 69 2.12 0 0.00 218 1.99 Pulp 98 2.67 112 2.98 67 2.06 0 0.00 277 2.53 Printing 51 1.39 33 0.88 65 2.00 1 0.37 150 1.37 Chemical Matter 101 2.75 147 3.91 152 4.67 0 0.00 400 3.65 Chemical Product 203 5.53 195 5.19 141 4.33 1 0.37 540 4.93 Petroleum & Coal 8 0.22 5 0.13 5 0.15 1 0.37 19 0.17 Rubber 41 1.12 66 1.76 27 0.83 2 0.73 136 1.24 Plastic 256 6.98 311 8.28 277 8.51 0 0.00 844 7.71 Non-metallic 86 2.34 124 3.30 114 3.50 136 49.82 460 4.20 Basic Metal 157 4.28 185 4.93 470 14.44 12 4.40 824 7.52 Fabricated Metal 417 11.37 481 12.81 364 11.18 25 9.16 1287 11.75 Machinery 399 10.88 479 12.75 260 7.99 22 8.06 1160 10.59 Electronic 764 20.83 468 12.46 281 8.63 7 2.56 1520 13.88 Transport equipment 172 4.69 221 5.88 313 9.62 41 15.02 747 6.82 Precision Instrument 54 1.47 71 1.89 49 1.51 0 0.00 174 1.59 Miscellaneous 162 4.42 185 4.93 167 5.13 13 4.76 527 4.81 Non-manufacturing 27 0.74 42 1.12 15 0.46 0 0.00 84 0.77 Total 3,668 100 3,756 100 3,255 100 273 100 10,952 100
Source: The Annual Report of Development and Management of Industrial Zones, 1999.
Table 10: The Shares of the Top Five Industries
Rank Total North Central South East
1 EL 13.88 EL 20.83 FM 12.81 BM 14.44 NM 49.82 2 FM 11.75 FM 11.37 MA 12.75 FM 11.18 TR 15.02 3 MA 10.59 MA 10.88 EL 12.46 TR 9.62 FM 9.16 4 PL 7.71 TX 8.53 PL 8.28 EL 8.63 MA 8.06 5 BM 7.52 PL 6.98 TR 5.88 PL 8.51 -- Sub-Total 51.45 58.59 52.18 52.38 82.06
Indications: EL: electronic, FM: fabricated metal, MA: machinery, PL: plastic, BM: basic metal, TX: textile, TR: transport equipment.
On the whole, the top five industries are electronic, fabricated metal, machinery, plastic, and basic metal and they together share 51.45 percent of the total 10,952 factories. Among the top five industries, electronic, fabricated metal, machinery and plastic industries commonly appear in the North, Central and South regions. However, the North has textile ranked fourth, the Central has transport equipment ranked fifth, and the South has transport equipment ranked third.
Regional concentration and variation can also be seen. In the North region, textile manufacturing accounts for 55 percent of the total 571 factories, while electronic manufacturing is 50 percent of the total 1,520 factories. It seems that the Central region does not predominate in any branch of manufacturing. However, its machinery manufacturing accounts for 41 percent of the total 1,160 factories, its fabricated metal manufacturing shares 37 percent of the total 1,287, and its plastic manufacturing makes up 37 percent of the total 844 factories. In the South region, basic metal manufacturing accounts for 57 percent of the total 824 factories and the transport equipment manufacturing shares 42 percent of the total 747 factories. Finally, it is notable that in the East region, nearly half (49.82%) of the 273 factories engage in non-metallic mineral products based on local natural resources, such as marble and granite quarries. In short, concentration and polarization phenomena appear in textile, electronic, and non-metallic manufacturing industries due to development policy, location, and special resources.
Concluding remarks
This paper has presented numerical facts related to regional variation of Taiwan’s industrial development and these make up only a preliminary study of the topic. Briefly speaking, the situation in 1996 showed that the North region had 43.5 percent of Taiwan’s manufacturing establishment units, the Central region had 35.3 percent, the South region had 20.4 percent, and the East region had 0.8 percent. Moreover, the tendency is that the shares of the North and the Central regions are increasing, while those of the South and the East are decreasing. Details related to types of manufacturing industries and the industrial zones also reveal regional variation and concentration. It is hard to say, however, that the picture now we have for regional variation in Taiwan’s industrial development is entirely an outcome of rational planning. Further studies are required to investigate into crucial factors and process of changes leading to this result.
References
DBGAS (Directorate-General of Budget, Accounting and Statistics), The 1999
Statistical Almanac of the Republic of China, Taipei: Directorate-General of Budget,
Accounting and Statistics, Executive Yuan, 1999. IDB, http://www.moeaidb.gov.tw/.
Kung-yeh-ch’u k’asi-fa kuan-li nien-pao, pa-shih-pa nien-tu 工業區開發管理年報,
八十八年度 (The annual report of the industrial zone’s management, 1999).
The 1954 Census: General Report on Industrial and Commerce Census of Taiwan,
1954. Published by the Executive Group of ICCT, May 1956.
The 1961 Census: General Report 1961, Industry and Commerce Census of Taiwan. Published by the Executive Group of ICCT, December 1962.
The 1966 Census: General Report on the Third Industrial and Commercial Census of
Taiwan. Published by the Commission of ICCT, June 1968.
The 1971 Census: The 1971 Industrial and Commercial Censuses of Taiwan and
Fukien Area. Published by The Committee on Industrial and Commercial Censuses of
Taiwan and Fukien Area, Executive Yuan, June 1973.
The 1976 Census: The Report of 1976 Industrial and Commercial Censuses of
Taiwan-Fukien District of the Republic of China. Published by the Committee on
Industrial and Commercial Censuses of Taiwan-Fukien district of the Republic of China, Executive Yuan, December 1978.
The 1981 Census: The Report on 1981 Industrial and Commercial Census,
Taiwan-Fukien Area, The Republic of China. Published by Directorate-General of
Budget, Accounting and Statistics, Executive Yuan, June 1983.
The 1986 Census: The Report on 1986 Industrial and Commercial Census,
Taiwan-Fukien Area, The Republic of China. Published by Directorate-General of
Budget, Accounting and Statistics, Executive Yuan, October 1988.
The 1991 Census: The Report on 1991 Industrial and Commercial Census,
Taiwan-Fukien Area, The Republic of China. Published by Directorate-General of
Budget, Accounting and Statistics, Executive Yuan, December 1993.
The 1996 Census: The Report on 1996 Industry, Commerce and Service Census,
Taiwan-Fukien Area, The Republic of China. Published by Directorate-General of
Budget, Accounting and Statistics, Executive Yuan, December 1998.
The Ministry of Interior, The Population Statistics of Taiwan and Fukien Area, the
Republic of China, 1996. Taipei: The Ministry of Interior, 1997.
的 開 發 與 工 業 發 展 (The development of industrial zones and the industrial development)”, T’u-ti kai-ke 土地改革 (Land Reform Monthly), 23.5-6 (1973): 28-31.
Lin Chien-yuan 林建元, Taiwan-sheng kung-yeh fa-chan ts’e-lueh chi kung-yeh-chu
she-chih chu-wei fen-pu chih yen-chiu 台灣省工業發展策略及工業區設置區位分
佈之研究 (A study on the policy of industrial development and location distribution of the industrial zones in Taiwan province), Nantou: Taiwan Provincial Government, 1999.
Liu Ts’ui-jung 劉翠溶, “Pa-shih-nien-lai Taiwan te tu-shih fa-chan 八十年來臺灣的 都市發展 (Urban development in Taiwan in the past eighty years)”, in Proceedings
of Conference on Eighty Years History of the Republic of China, 1912-1991 ed. by the
Conference Symposium Editorial Committee, Vol. 4: 530-572, Taipei: Modern China Publisher, 1991.
Yeh, Shu-jen 葉淑貞, “Ts’ung li-shih chiao-tu p’o-hsi Taiwan chan-hou kung-yeh fa-chan te t’e-cheng 從歷史角度剖析臺灣戰後工業發展的特徵 (An analysis on features of Taiwan’s post-war industrial development from a historical perspective)”, in Chung-kuo hsien-tai-shih chuan-t’i-yen-chiu pao-kao 中國現代史專題研究報告 (Topics on history of contemporary China), edited by the Historical Material Center of the Republic of China, Vol. 17: 508-610. Taipei: The Historical Material Center, 1995.