行政院國家科學委員會補助專題研究計畫成果報告
※※※※※※※※※※※※※※※※※※※※※※※※※※※※※
※
毛細管電泳對環境污染物及藥物分離之研究 III
※
※※※※※※※※※※※※※※※※※※※※※※※※※※※※※
計畫類別:
þ
個別型計畫 □整合型計畫
計畫編號:NSC-89-2113-M-002-055
NSC-90-2113-M-002-059
NSC-91-2113-M-002-054
執行期間: 89 年 8 月 1 日至 92 年 7 月 31 日
計畫主持人:林 敬 二
共同主持人:
本成果報告包括以下應繳交之附件:
□赴國外出差或研習心得報告一份
□赴大陸地區出差或研習心得報告一份
þ
出席國際學術會議心得報告及發表之論文各一份
□國際合作研究計畫國外研究報告書一份
執行單位:國立台灣大學化學系
中 華 民 國 93 年 2 月 20 日
國科會專題研究計畫成果報告
計畫名稱:毛細管電泳對環境污染物及藥物分離之研究 III
計畫編號:NSC-89-2113-M-002-055
NSC-90-2113-M-002-059
NSC-91-2113-M-002-054
執行期限:89 年 8 月 1 日至 91 年 7 月 31 日
計劃主持人:林敬二
執行單位:國立台灣大學化學系
第一部份
毛細管電泳對環境污染物之
分離研究
1 A、計劃緣由與目的
Chloropyridines, chlorophenols
及
triazines 皆為常見之環境污染物。對環境
造成之污染實在不可忽視 ,必須加以監
測。因此對此類污染物之之分離及分析方
法的探討是個相當重要的課題。
此研究計劃擬以毛細管區帶電泳法
(CZE)及微胞電動法(MEKC)分別對此類污
染物分離做最佳化條件及電泳遷移行為之
探討,並且對分析物與界面活性劑微胞之
結合常數,遷移順序,以及分離機制做更
進一步的測定與瞭解。分離參數對偵測極
限至及解析度之影響以及應用新近發展的
sample stacking 技巧亦將加以探討,期能在
UV
偵 測 法 上 降 低 偵 測 極 限 ( 至
10
-8~10
-9M)。由於分析物與界面活性劑之
間有相當程度的交互作用力,因此可利用
電泳法加以測定並探討界面活性劑以及添
加
β
-環糊精時在電泳緩衝液中臨界微胞濃
度(CMC)之變化情形,以便能進一步瞭解
在微胞化過程中及 CD-CZE 及 CD-MEKC
之分離機制差異之奧秘。
1 B、結果與討論
第一年之研究工作著重於以 MEKC 法
探討 chloropyridines 之分離及分離機制,並
對 SDS 微胞與分析物之結合常數、遷移順
序加以測定與瞭解。此部份之研究工作已
順 利 完 成 , 研 究 結 果 已 發 表 於 J.
Chromatogr. A 910 (2000) 165 (詳見附件
1)。
第二年之研究工作著重於以 CZE 法探
討 s-triazine 中 性 物 種 之 分 離 機 制 及 以
sweeping 法探討 s-triazine 之線上濃縮及濃
縮機制。此部份之研究工作已順利完成,
研究結果已發表於 J. Chromatogr. A 878
(2000) 137 及 916 (2000) 239 (詳見附件 3,
4)。
第三年之研究工作著重於利用毛細管
電泳法探討 Chlorophenols 與 SDS 界面活
性劑之間的相互作用力與分離並探討界面
活性劑在添加 ß-環糊精時界面活性劑的臨
界微胞濃度之變化,並期望對 CD-CZE 及
CD-MEKC 分離機制上的差異有所了解。
此部分之研究工作已完成, 並發表於 J.
Chromatogr. A, 917 (2001) 297 (詳見附件
6)。
第二部份
毛細管電泳對藥物分離之研
究
2 A、計劃緣由與目的
抗 生 素 如
cephalosporins
及
tetracyclines 為臨床上常用的藥物,因此,
發展快速而有效的檢驗方法在藥物分析化
學上是個重要的研究課題。此研究計劃在
於 發 展 以 CZE 及 MEKC 方 法 分 離
cephalosporins 及 tetracyclines 並探討其電
泳遷移行為;瞭解分離機制及遷移順序之
源由。
2 B、結果與討論
第一年之研究工作著重於以 citrate 及
MES 與 phosphate buffer 做比較 ,利用
CZE 方法研究 cephalosporins 的分離及電
泳遷移行為。此部份之研究工作已順利完
成,部分研究結果已發表於 J. Chromatogr.
A, 879 (2000) 197 (詳見附件 2)。
第二年之研究工作著重於以 acetate
buffer 在 pH 5.0-9.0 下 添 加 SDS 或
SDS+Brij 35 為界面活性劑,利用 MEKC
方法研究 tetracycline 的分離及電泳遷移行
為同時,也以 TTAB, CTAB 等陽離子界面
活性劑利用 MEKC 方法研究 cephalosporins
的分離及電泳遷移行為。此部分之研究工
作已順利完成,部分研究結果已發表於 J.
Chromatogr. A, 802 (1998) 95 (詳見附件 5)。
附件 1:研究論文六篇
1. C. E. Lin*, C. C. Chen, H. W. Chen, C. H.
Lin, (2001), "Optimization of Separation and
Migration Behavior of Chloropyridines in
Micellar Electrokinetic Chromatography", J.
Chromatogr. A, 910, 165.
2. C. E. Lin*, H. W. Chen, E. C. Lin and K. S.
Lin, (2000), "Optimization of Separation and
Migration Behavior of Cephalosporins in
Capillary Zone Electrophoresis",
J.
Chromatogr. A, 879, 197.
3. C. E. Lin*, T. Z. Wang, C. C. Hsueh and T.
C.
Chiu, (2000), "Capillary Zone
Electrophoretic Separation and Migration
Behavior of Neutral Species of
Chloro-s-triazines in the Presence of Cationic
Surfactant Monomers", J. Chromatogr. A,
878, 137.
4. C. E. Lin*, Y. C. Liu, T. Y. Yang, T. Z.
Wang and C. C. Yang, (2000), "On-Line
Concentration of s-Triazine Herbicides by
Micellar Electrokinetic Chromatography
Using Cationic Surfactants", J. Chromatogr.
A, 916, 239.
5. C. E. Lin*, Y. C. Chen and C. C. Hsueh,
(1998), "Migration Behavior and Separation
of Te tracycline antibiotics by Micellar
Electrokinetic Capillary Chromatography", J.
Chromatogr. A, 802, 95.
6. C. E. Lin*, H. C. Huang and H. W. Chen,
(2001), "Influence of
β
-Cyclodextrins on the
Critical Micelle Concentration of Sodium
Dodecyl Sulfate: A Capillary Electrophoresis
Study", J. Chroamtogr. A, 917, 297.
www.elsevier.com / locate / chroma
Optimization of separation and migration behavior of
chloropyridines in micellar electrokinetic chromatography
a ,
*
a a aChing-Erh Lin
, Chia-Chong Chen , Hung-Wen Chen , Hui-Chun Huang ,
b a
Chen-Hsing Lin , Yu-Chih Liu
aDepartment of Chemistry, National Taiwan University, 1 Roosevelt Road, Section 4, Taipei, Taiwan
b
Department of Applied Chemistry, Foo-Ying Institute of Technology, Ta-Liao, Kao-Hsiung County, Taiwan Received 31 July 2000; received in revised form 8 November 2000; accepted 17 November 2000
Abstract
The separation and migration behavior of pyridine and eight chloropyridines, including three monochloropyridines, four dichloropyridines, and 2,3,5-trichloropyridine were investigated by micellar electrokinetic chromatography using either sodium dodecyl sulfate (SDS) as an anionic surfactant or SDS–Brij 35 mixed micelles. Various parameters such as buffer pH, SDS concentration, Brij 35 concentration and methanol content that affect the separation were optimized. Complete separation of these chloropyridines was optimally achieved with a phosphate buffer containing SDS (30 mM ) and methanol (10%, v / v) at pH 7.0. The resolution and selectivity of analytes could be considerably affected by the addition of methanol and / or Brij 35 to the background electrolyte. The migration order of these chloropyridines depends primarily on their hydrophobicity. However, electrostatic interactions may also play a significant role in the determination of the migration order of the positional isomers of chloropyridines. 2001 Elsevier Science B.V. All rights reserved.
Keywords: Buffer composition; Micelles, mixed; Chloropyridines; Pyridines
1. Introduction vironmental concern. Thus, the development of an efficient method for separating these pyridine com-Pyridine and chloropyridines are widely used as pounds is desirable.
intermediates or insecticides in some chemical and Although various chromatographic methods and agricultural industries [1–5]. For example, chlor- hyphenated techniques, including GC [6–8], GC– pyrifos used as an insecticide is derived from MS [9] and HPLC [7,10] have been applied to chloropyridines [1]. In the production process of separate some mixtures of chlorinated pyridine, chloropyrifos, pyridine is first chlorinated to penta- complete separation of chloropyridine isomers is still chloropyridine. During the chlorination reaction of not achieved by aforementioned methods.
pyridine, other lower chlorinated pyridine isomers in Capillary electrophoresis (CE) has become a addition to pentachloropyridine are also present as popular and powerful technique to separate diverse by-products. Moreover, chloropyridines are of en- analytical samples [11–14]. This technique provides high resolution, great efficiency, rapid analysis and small consumption of solvent in comparison with
*Corresponding author. Tel.: 223-635-357; fax:
1886-223-636-359. HPLC. In recent years, the application of this
0021-9673 / 01 / $ – see front matter 2001 Elsevier Science B.V. All rights reserved. P I I : S 0 0 2 1 - 9 6 7 3 ( 0 0 ) 0 1 1 7 8 - X
166 C.-E. Lin et al. / J. Chromatogr. A 910 (2001) 165 –171
technique to the analysis of environmental pollutants absorption at 214 nm or 200 nm as specified. The CE has gained considerable attention. However, to our systems were interfaced with a microcomputer and a knowledge, a systematic study on the separation of laser printer using MDQ software for data acquisi-chloropyridines is still lacking. In this study, micellar tion. All CE experiments were performed at 258C, electrokinetic chromatography (MEKC) using so- unless otherwise specified. For pH measurements, a dium dodecyl sulfate (SDS) as an anionic surfactant pH meter (Suntex model SP-701, Taipei, Taiwan) was employed to obtain baseline separation of a with an accuracy of 0.01 pH unit was used. mixture of pyridine and eight chloropyridines,
in-cluding three monochloropyridines, four dich- 2.3. Procedures loropyridines and 2,3,5-trichloropyridine. The
op-timization of various parameters that may affect the When using a new capillary column, the capillary separation is taken into consideration. Moreover, was washed for 60 min with NaOH solution (1.0 M ) factors that influence the migration order of these at 608C, followed by washing for 10 min with water chloropyridines are examined. at the same temperature and for 10 min with water at 258C. Before each injection, the capillary was flushed with the buffer solution for 5 min. The
2. Experimental capillary was washed with NaOH solution (0.1 M ) and water to keep the electroosmotic flow (EOF) to
2.1. Chemicals normal when needed.
The buffer solutions were prepared by mixing Pyridine, three monochloropyridines and Brij 35 stock solutions of NaH PO2 4 (100 mM ), SDS and were obtained from Tokyo Kasei Kogyo (TCI, methanol at varied ratios and then adjusted to the Tokyo, Japan); four dichloropyrines were purchased desired pH value with KOH solution (0.1 M ). from Sigma-Aldrich (St. Louis, MO, USA); 2,3,5- All solutions were degassed by sonication and trichloropyridine and sodium dodecyl sulfate were passed through a membrane filter (0.22 mm) before supplied from Merck (Darmstadt, Germany). All use. The electroosmotic mobility ( m ) was deter-eo other chemicals were of analytical grade obtained mined with methanol as a neutral marker and the from various suppliers. Deionized water was pre- electrophoretic mobility of the micelles was deter-pared with a Milli-Q system (Millipore, Bedford, mined with Sudan III as a micelle marker. Samples
MA, USA). were injected in a hydrodynamic mode during 2 s.
A stock solution containing 1000 mg / ml of each Analytes were identified by the spiking technique. analyte dissolved in methanol was prepared.
Stan-dard sample solutions were prepared by mixing the 2.4. Calculations stock solution with methanolic solutions to obtain a
desired concentration. The electrophoretic mobility of analytes were calculated from the observed migration times with
2.2. Apparatus the equation:
L Ld t 1 1
]] ] ]
Capillary electrophoretic experiments were carried m 5 m 2 m 5ep eo V ?
S
t 2tD
(1) m eoout on a Beckman Coulter P/ACE System Model
5500 (Fullerton, CA, USA) equipped with a photo- in which mep is the electrophoretic mobility of the diode array detector for absorbance measurements. analyte tested, m is the apparent mobility, meo is the Uncoated fused-silica capillaries purchased from electroosmotic mobility, tmis the migration time of a Polymicro Technologies (Phoenix, AZ, USA) were solute peak measured directly from the elec-used. The dimensions of the capillary were 67 cm3 tropherogram, teo is the migration time for an 50 mm I.D. The effective length of the capillary is 60 uncharged solute, L is the total length of capillary,t cm from the injection end of the capillary. Analytes L is the length of capillary between injection andd were detected by on-column measurements of UV detection, and V is the applied voltage.
3. Results and discussion pKa values determined for pyridine, 4-chloro-pyridine, and 3-chloropyridine are 4.95, 3.65, and 2.70 respectively, and the pK values of 2-chloro-a 3.1. Effect of buffer pH
pyridine and dichloropyridines are estimated to be less than 1.0. Therefore, all analytes are practically The effects of buffer pH on the migration behavior
in the neutral form at pH 7.0 and complete sepa-and separation of pyridine sepa-and eight chloropyridines
ration of these analytes is experimentally impossible in the absence and presence of SDS micelles was
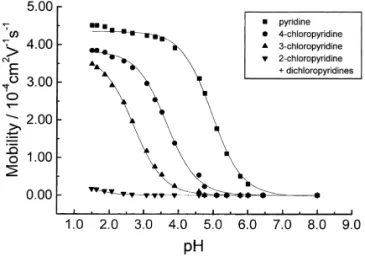
without the addition of surfactant molecules or investigated. Fig. 1 shows the variations of the
electrolyte modifiers to the background electrolyte at electrophoretic mobility of pyridine and
chloro-pH 7.0. pyridines as a function of buffer pH in the range
The effect of buffer pH in MEKC was then 1.5–8.0 without the addition of SDS surfactant to the
examined in the range 5.6–10.0 for these analytes in buffer solution. The pKa values of pyridine and
a phosphate buffer containing 30 mM SDS. In this chloropyridines can be determined from the variation
pH range, the EOF increases almost linearly with of the effective electrophoretic mobility of each
increasing pH at pH,7, but in a lesser extent at analyte as a function of buffer pH, according to the
pH.7, whereas the electrophoretic mobility of ana-following equation [15–17]:
lytes, except pyridine and 4-chloropyridine, does not 1
show significant change with increasing buffer pH, [H O ]3
]]]]
meff5aBH1mBH15 1 ?mBH1 (2) especially at pH.7. The electrophoretic mobility of
[H O ] 1 K3 a 25
4-chloropyridine decreases slightly from 26.6?10
25 2 21 21
where meffis the effective electrophoretic mobility of to 24.0?10 cm V s , whereas that of pyridine 1
a protonated basic analyte (BH ), mBH1 and aBH1 decreases appreciably with increasing buffer pH in are the limiting electrophoretic mobility and mole the range 5.6–7.0. This is probably resulted from the fraction of the protonated form of a basic analyte, micelle-shifted pK values of pyridine and 4-chloro-a
1
and K is the acid dissociation constant of BH . Thea pyridine. It is found that pyridine and 2-chloro-pyridine are barely separated at pH 5.6, but they are well resolved at pH in range 6.0–7.0. Hence, effec-tive separation of these analytes is optimally achieved in MEKC at pH 7.0.
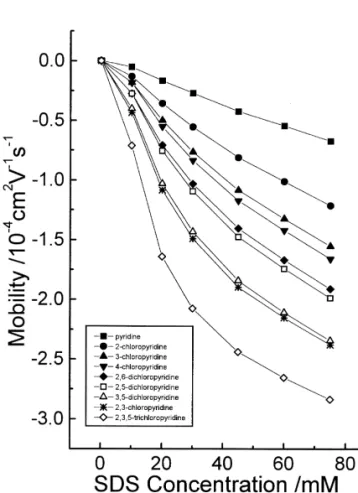
3.2. Effect of SDS concentration
Fig. 2 shows the variations of the electrophoretic mobility of pyridine and chloropyridines obtained in a phosphate buffer containing varied concentration of SDS and 10% (v / v) methanol at pH 7.0. The SDS concentration was varied in the range 0–75 mM. As expected, the partition of a solute into SDS micelles is favored with increasing SDS concentration as the electrophoretic mobility of each analyte increases with increasing SDS concentration. On the other
Fig. 1. Variations of the electrophoretic mobility of pyridine and
hand, the EOF decreases comparatively to a lesser
chloropyridines as a function of buffer pH without the addition of
SDS micelles to the background electrolyte. Experimental results extent with increasing SDS concentration.
Conse-are represented by data points; predicted mobility curves Conse-are quently, the separation with an increase in SDS shown by solid lines. Background electrolyte: 10 mM phosphate concentration results in a longer analysis time. As buffer containing 10% (v / v) methanol at varied buffer pH.
shown in Fig. 3, a baseline separation of a mixture of
Capillary: 67 cm350 mm, I.D. Other operating conditions: 30 kV,
pyridine and eight chloropyridines was optimally
258C. Sample concentration, 50 mg / ml. Detection wavelength,
168 C.-E. Lin et al. / J. Chromatogr. A 910 (2001) 165 –171
Fig. 3. A typical electropherogram of pyridine and eight chloro-pyridines obtained with a phosphate buffer (10 mM ) containing 30 mM SDS and 10% (v / v) methanol at pH 7.0. Other operating conditions as for Fig. 2. Peak identification, 1, pyridine; 2, 2-chloropyridine; 3, 3-chloropyridine; 4, 4-chloropyridine; 5, 2,6-dichloropyridine; 6, 2,5-2,6-dichloropyridine; 7, 3,5-2,6-dichloropyridine; 8, 2,3-dichloropyridine; 9, 2,3,5-trichloropyridine.
resulting in the lowering of the zeta potential of the silica surface. Furthermore, the dielectric constant of the BGE decreases linearly and the viscosity of the
Fig. 2. Variations of the electrophoretic mobility of pyridine and BGE also increases in the presence of methanol, thus chloropyridines as a function of SDS concentration in MEKC. causing the decrease in the EOF [18]. The migration Background electrolyte: 10 mM phosphate buffer containing 10%
time of analytes separated in a BGE without the
(v / v) methanol at pH 7.0. Other operating conditions as for Fig. 1.
addition of methanol is shorter than that separated in a BGE containing methanol. Unfortunately, 2,3-dich-mM ) containing 30 2,3-dich-mM SDS and 10% (v / v) metha- loropyridine and 3,5-dichloropyridine elute together nol at pH 7.0 with an applied voltage of 30 kV. With in a BGE without the addition of methanol. this buffer electrolyte, the electrophoretic mobility of As shown in Fig. 4, the resolution of the peaks of SDS micelles using Sudan III as a micelle marker 2,3- and 3,5-dichloropyridine can be improved with
24 2 21 21
was determined to be 23.46?10 cm V s . addition of methanol. In fact, the peaks of these two analytes are effectively separated with addition of 3.3. Effect of methanol content 10% (v / v) methanol, and the peaks are well sepa-rated with addition of 20% (v / v) methanol. On the A background electrolyte (BGE) solution com- contrary, the separations for the peaks between 2,5-posed of NaH PO2 4 (10 mM ) and SDS (30 mM ) and 2,6-dichloropyridine and for the peaks between containing various proportions of methanol (0–20%, 3- and 4-dichloropyridine become worse as methanol v / v) at pH 7.0 was used to examine the effect of content in the buffer electrolyte increases from 10 to methanol content on the EOF and electrophoretic 20% (v / v).
mobility of each solute. The EOF declines almost
linearly and the electrophoretic mobility of each 3.4. Effect of Brij 35 concentration analyte also decreases, but to a lesser extent, with
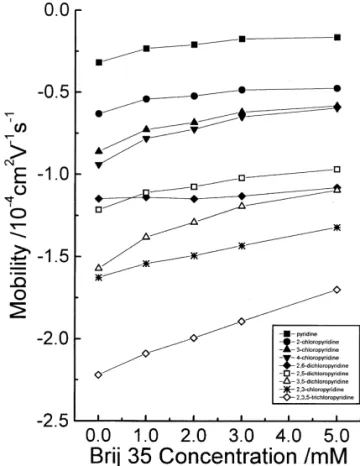
increasing methanol content. The decrease in the A mixed micelle composed of SDS and Brij 35 EOF is attributed to the interaction between metha- has been reported to improve separation selectivity nol and the silanol groups on the capillary wall, [19–23] and to increase the elution range in MEKC
Fig. 5. Variations of the electrophoretic mobility of pyridine and Fig. 4. Variations of the electrophoretic mobility of pyridine and
chloropyridines as a function of Brij 35 concentration using SDS chloropyridines as a function of methanol content using SDS (30
(30 mM )–phosphate (10 mM ) buffer system at pH 7.0. Other mM )–phosphate (10 mM ) buffer system at pH 7.0. Other
oper-operating conditions as for Fig. 2. ating conditions as for Fig. 2.
[24]. Fig. 5 shows the variations of the electro- is optimally achieved with addition of 2–3 mM Brij phoretic mobility of pyridine and chloropyridines as 35 in the SDS–Brij 35 mixed micellar buffer system. a function of Brij 35 concentration in a phosphate Fig. 6 shows the electropherogram of a mixture of buffer (10 mM ) containing 30 mM SDS 10% (v / v) chloropyridines obtained with addition of 3 mM Brij methanol, and varied concentration of Brij 35 in the 35 to the SDS–phosphate buffer system.
range 0–5 mM at pH 7.0. As can be seen, the
resolution of the peaks of 2,3- and 3,5-dich- 3.5. Binding constants versus migration order loropyridine is greatly enhanced with further addition
of Brij 35 to the SDS–phosphate buffer system. With In MEKC, the effective electrophoretic mobility addition of Brij 35, the electrophoretic mobility and ( m ) of a neutral solute can be expressed by the
eff
the selectively of the analytes studied, except 2,3- following equation [25,26]: dichloropyridine, are considerably affected. The
mi-gration of 2,6-dichloropyridine behaves differently KB?S(CMC)mB?S1 KB?M[M]mM
]]]]]]]]]
m 5 (3)
from the other analytes, thus causing the reversal of eff 1 1 K (CMC) 1 K [M]
B?S B?M
the migration order of the peaks of 2,5- and
2,6-dichloropyridine. Moreover, the peaks of 3- and where m and K denote the electrophoretic mobility 4-chloropyridine become even unresolvable when the and binding constant, B?S represents the complexes concentration of Brij 35 exceeds 3 mM. formed between neutral analytes (B) and surfactant As a result, the separation of these chloropyridines monomers (S), and B?M represents the complexes
170 C.-E. Lin et al. / J. Chromatogr. A 910 (2001) 165 –171 Table 1
Binding constants evaluated for pyridine and eight chloropyridines
a
in a SDS–phosphate buffer system at pH 7.0
b
Peak Analytes Binding Log Pow
no. constant 21 (M ) 1 Pyridine 3.2 1.04 2 2-Chloropyridine 7.5 1.45 3 3-Chloropyridine 11.2 1.43 4 4-Chloropyridine 13.0 1.28 5 2,6-Dichloropyridine 17.0 2.15 6 2,5-Dichloropyridine 18.5 2.40 7 3,5-Dichloropyridine 28.5 2.56 8 2,3-Dichloropyridine 30.0 2.11 9 2,3,5-Trichloropyridine 58.0 3.11 a
Binding constants are evaluated according to Eq. (4) with the Fig. 6. An electropherogram of pyridine and eight chloropyridines
CMC value of SDS equal to 4.8 mM. obtained in a phosphate buffer (10 mM ) containing 30 mM SDS, b
Refs. [28,29]. 3 mM Brij 35 and 10% (v / v) methanol at pH 7.0. Detection
wavelength, 200 nm. Other operating conditions and peak identifi-cation are the same as for Fig. 3.
1.04, 1.28–1.45, 2.11–2.56, 3.11, 3.32, and 3.53, respectively, the hydrophobicity of chloropyridines formed between neutral analytes (B) and surfactant increases with increasing the number of chlorine micelles (M), [M] is the concentration of surfactant substituents on the pyridine ring. Moreover, as micelles which is defined as the total concentration indicated in Table 1, the binding constants of of surfactant molecules minus the critical micelle pyridine, monochloropyridines, dichloropyridines concentration (CMC). The CMC value of SDS in 10 and 2,3,5-trichloropyridine evaluated are in the range
21
mM phosphate buffer containing 10% (v / v) metha- 3.2, 7.5–13.0, 17.0–30.0, and 58.0 M , respective-nol in the presence of chloropyridines is determined ly. The binding constant of chloropyridines increases to be 4.8 mM [27]. As the magnitude of the term as the number of chlorine substituents on the involving KB?S is very small because the binding pyridine ring increases. The results clearly indicate between chloropyridines and SDS monomers is very that the migration order of these chlopopyridines weak, Eq. (3) can be simplified to depends primarily on their hydrophobicity. However, the magnitudes of the binding constants of positional
KB?M[M]mM isomers of monochloropyridines and those of
dich-]]]]
meff51 1 K [M] (4) loropyridines do not follow the same order as for B?M
their hydrophobicity. The results reveal that the Accordingly, the binding constant of each individual migration behavior of those chloropyridines is not solute to SDS micelles can be calculated by varying solely governed by the hydrophobic interaction. It the parameter (KB?M) through the utilization of Excel also implies that electrostatic interactions may play a software until the simulated mobility curve is best significant role in the determination of the migration fitted to the observed data points. Table 1 lists the order.
magnitudes of the binding constants evaluated for
these chloropyridines, together with the log Pow 3.6. Reproducibility and detection limits (logarithm of octanol–water partition coefficient)
values available in the literature. The migration times of these analytes were quite As the log Pow values of pyridine, monochloro- reproducible, with relative standard deviation (RSD) pyridines, dichloropyridines, 2,3,5-trichloropyridine, varying in the range 0.6–0.8% (n 56). The limits of 2,3,5,6-tetrachloropyridine, and pentachloropyridine detection (LOD) at a signal-to-noise ratio (S /N ) reported in the literature [28,29] are in the range equal to 3 determined with UV detection at 214 nm
[6] L.H. Klemm, J. Shabtai, F.H.W. Lee, J. Chromatogr. 51
for 2- and 3-chloropyridine, 2,5- and
3,5-dichloro-(1970) 433.
pyridine, and 2,3,5-trichloropyridine were in the
[7] S. Husain, P.N. Sarma, G.Y.S.K. Swamy, J. Chromatogr. 540
range 0.5|1.1 mg / ml, depending on the molar (1991) 331.
absorbtivity of each individual analyte. It is believed [8] S. Husain, P.N. Sarma, S.S. Swamy, J. High Resolut.
that much lower levels of the LOD values of these Chromatogr. 14 (1991) 493.
[9] S. Husain, A.S.R. Krishnamurthy, P.N. Sarma, J.
Chroma-analytes can be obtained with UV detection by using
togr. 285 (1984) 509.
sweeping technique [30–32]. Currently, on-line
con-[10] S. Husain, A.S.R. Krishnamurthy, P.N. Sarma, J.
Chroma-centration of chloropyridines by sweeping in MEKC togr. 348 (1985) 309.
is undertaken and the results of the analysis will be [11] F. Foret, L. Krivankoa, P. Bocek, Capillary Zone
Electro-reported later. phoresis, VCH, Weinheim, 1993.
[12] S.F.Y. Li, Capillary Electrophoresis: Principles, Practice and Applications, Elsevier, Amsterdam, 1993.
[13] N.A. Guzman (Ed.), Capillary Electrophoresis Technology,
4. Conclusion Marcel Dekker, New York, 1993.
[14] P. Camilleri (Ed.), Capillary Electrophoresis: Theory and
The separation of pyridine and eight chloro- Practice, CRC Press, Boca Raton, FL, 1993.
[15] J. Cai, J.T. Smith, Z.E. Rassi, J. High Resolut. Chromatogr.
pyridines is effectively achieved by MEKC with the
15 (1992) 30.
use of either SDS micelles or SDS–Brij 35 mixed
[16] C.E. Lin, C.C. Chang, W.C. Lin, J. Chromatogr. A 768
micelles. Various separation parameters are opti- (1997) 105.
mized. In addition to buffer pH and SDS concen- [17] C.E. Lin, Y.T. Chen, J. Chromatogr. A 871 (2000) 357.
tration, methanol content and Brij 35 concentration [18] I.E. Valko, H. Siren, M.-L. Riekkola, J. Microcol. Sep. 11 (1999) 199.
also affect the selectivity of analytes considerably.
[19] H.T. Rasmussen, L.K. Goebel, H.M. Menair, J. Chromatogr.
The migration order of those analytes depends
517 (1990) 549.
primarily on the hydrophobic interaction of each [20] H.T. Rasmussen, L.K. Goebel, H.M. Menair, J. High Re-analyte with the SDS micelles. However, electro- soult. Chromatogr. 14 (1991) 25.
static interactions may also play a significant role. [21] Q. Wu, H.A. Claessens, C.A. Cramers, Chromatographia 34 (1992) 25.
[22] E.L. Little, J.P. Foley, J. Microcol. Sep. 4 (1992) 145. [23] Y. Esaka, M. Kobayashi, T. Ikeda, K. Kano, J. Chromatogr.
Acknowledgements A 736 (1996) 273.
[24] E.S. Ahuja, E.L. Little, K.R. Nielsen, J.P. Foley, Anal.
We thank the National Science Council of Taiwan Chem. 67 (1995) 26.
[25] C.E. Lin, C.C. Hsueh, T.Z. Wang, T.C. Chiu, Y.C. Chen, J.
for financial support.
Chromatogr. A 835 (1999) 197.
[26] C.E. Lin, T.Z. Wang, T.C. Chiu, C.C. Hsueh, J. High Resolut. Chromatogr. 22 (1999) 265.
References [27] C.E. Lin, M.J. Chen, H.C. Huang, H.W. Chen, J. Chroma-togr. A, submitted for publication.
[28] A. Leo, C. Hansch, D. Elkins, Chem. Rev. 71 (1971) 525. [1] S. Husain, P.N. Sarma, G.Y.S.K. Swami, R. Narsimha, J.
[29] P.I. Gehring, T.R. Torkelson, F. Oyen, Toxicol. Appl. Chromatogr. 540 (1991) 331.
Pharmacol. 11 (1967) 361. [2] W.H. Taplin, US Pat. 3 420 833(1969), Chem. Abstr. 71
[30] J.P. Quirino, S. Terabe, Science 282 (1998) 465. (1969) 3279z.
[31] J.P. Quirino, S. Terabe, Anal. Chem. 72 (2000) 1023. [3] Imperial Chemical Industries Ltd., Jap. Pat. 7 853 664
[32] C.E. Lin, Y.C. Liu, T.Y. Yang, T.Z. Wang, C.C. Yang, J. (1978); Chem. Abstr., 89 (1978) 146771m.
Chromatogr. A, in press. [4] P. Sutter, C.D. Weis, J. Heterocycl. Chem. 17 (1980) 493.
[5] D.J. Perettie, N.L. Dean, US Pat. 4 225 718 (1980), Chem. Abstr. 94 (1981) 65483v.
Journal of Chromatography A, 879 (2000) 197–210
www.elsevier.com / locate / chroma
Optimization of separation and migration behavior of
cephalosporins in capillary zone electrophoresis
a ,
*
a b a aChing-Erh Lin
, Hung-Wen Chen , Erick C. Lin , Kuo-Shen Lin , Hui-Chun Huang
aDepartment of Chemistry, National Taiwan University, Taipei, Taiwan
b
Department of Internal Medicine, Chang Gung Memorial Hospital, Lin-Kou, Tao-Yuen, Taiwan Received 22 November 1999; received in revised form 17 February 2000; accepted 2 March 2000
Abstract
The influences of buffer pH, buffer concentration and buffer electrolyte on the migration behavior and separation of 12 cephalosporin antibiotics in capillary zone electrophoresis using three different types of buffer electrolyte, including phosphate, citrate, and 2-(N-morpholino)ethanesulfonate (MES), were investigated. The results indicate that, although buffer pH is a crucial parameter, buffer concentration also plays an important role in the separation of cephalosporins, particularly when cefuroxime and cefazolin, cephalexin and cefaclor, or cefotaxime and cephapirin are present as analytes at the same time. The electrophoretic mobility of cephalosporins and electroosmotic mobility measured in citrate and MES buffers are remarkably different from those measured in phosphate buffer. With citrate buffer, optimum buffer concentration is confined to a small range (35–40 mM ), whereas buffer concentrations up to 300 mM can be used with MES buffer. Complete separations of 12 cephalosporins could be satisfactorily achieved with these three buffers under various optimum conditions. However, the separability of 12 cephalosporins with citrate or MES buffer is better than that with phosphate buffer. As a consequence of a greater electrophoretic mobility of cephalosporins than the electroosmotic mobility with citrate buffer at pH below about 5, some cephalosporins are not detectable. The cloudiness of the peak identification and of the magnitudes of the electrophoretic mobility of cefotaxime and cefuroxime reported previously are clarified. In addition, the pK values ofa cephradine, cephalexin, cefaclor, and cephapirin attributed to the deprotonation of either an amino group or a pyridinium group are reported, and the migration behavior of these cephalosporins in the pH range studied is quantitatively described. 2000 Elsevier Science B.V. All rights reserved.
Keywords: Buffer composition; Cephalosporins; Antibiotics
1. Introduction dihydrothiazine, but differ in the nature of the substituents attached at the 3- and / or 7-positions of Cephalosporins are antibiotics for the treatment of the cephem ring. These substituents affect either the Gram-positive and Gram-negative infections. These pharmacokinetic properties or antibacterial spectrum. antibiotics derived from the 7-aminocephalosporanic For the past two decades, these antibiotics are acid composed of a b-lactam ring fused with a generally separated and determined by high-perform-ance liquid chromatography (HPLC). Numerous HPLC procedures have been proposed for the
sepa-*Corresponding author. Tel.: 369-1949; fax:
1886-2-ration and / or quantification of these antibiotics [1–
363-6359.
E-mail address: [email protected] (C.-E. Lin) 5].
0021-9673 / 00 / $ – see front matter 2000 Elsevier Science B.V. All rights reserved. P I I : S 0 0 2 1 - 9 6 7 3 ( 0 0 ) 0 0 3 0 1 - 0
In recent years, capillary electrophoresis (CE) has cefotaxime and cefuroxime [20]. The difference in become an important separation technique owing to pK values between these two cephalosporins may bea its advantageous features, such as extremely high less than 0.2, as was determined from the poten-column efficiency, small sample volumes and rapid tiometric measurements [22] because the mobility analysis, in comparison with HPLC [6–11]. The curves of cephalexin and cefaclor shown in [22] are applications of this technique to the separation and / very close to each other. Moreover, the peak identifi-or determination of cephalospidentifi-orins have previously cation of cefotaxime and cefuroxime [20–22] may be been demonstrated using either micellar electrokin- questionable because their peak identification was etic chromatography (MEKC) [12–18] or capillary not confirmed by our preliminary results. Further-zone electrophoresis (CZE) [18–21]. more, the cause of the disappearance of the signals The separation of nine cephalosporins was per- of some cephalosporins with a citrate buffer at a pH formed by MEKC using sodium dodecyl sulfate below about 5 is speculated, but not clearly under-(SDS) and sodium N-lauroyl-N-methyltaurate as stood [22].
anionic surfactants with phosphate buffer at pH 9.0 In order to clarify all this cloudiness, a more [12]. Twelve cephalosporins were separated under thorough investigation with regard to the effects of similar electrophoretic conditions, but at pH 6.0 [13]. buffer pH and buffer concentration on the migration Five cephalosporins were analyzed with a borate behavior and separation of cephalosporins is certain-buffer containing SDS at an alkaline pH [15]. The ly needed. Furthermore, in view of the modification determinations of cefuroxime in human serum [16] on the capillary surface with the use of a zwitterionic and of cefotaxime in plasma [17,18] by MEKC were buffer such as sodium
2-(N-morpholino)ethanesulfo-demonstrated. nate (MES), an investigation on the migration
be-On the other hand, the determinations of cefotax- havior and separation of cephalosporins using such a ime in plasma with phosphate buffer or with borate buffer electrolyte is desirable. A comparative study buffer were first illustrated by CZE [18,19]. Recent- on this matter using these three different types of ly, the separation and determination of nine cephalo- buffer electrolyte is also worthy for investigation. In sporins in urine and bile sample solutions [20] and in this work, 12 cephalosporins, which have a similar plasma sample solution [21] were performed by CZE basic structure but with different substituents at-using either a citrate buffer at pH 6.0 or a phosphate tached to the cephem ring, are selected. These buffer at pH 7.2. Dissociation constants of nine cephalosporins are prescribed antibiotics and are cephalosporins were determined using citrate, ace- commercially available. Here, we present the results tate, and phosphate buffers in three different pH of our investigations.
regions ranging from 2 to 9 [22]. However, the influence of the buffer pH on the migration behavior
and separation of the cephalosporins by CZE were 2. Experimental
less rigorously investigated and the effects of buffer
concentration and buffer type were incompletely 2.1. Apparatus examined or even lacking.
It should be pointed out that some of the results All CE experiments were performed on a Beck-reported previously by Mrestani et al. [20–22] seem man P/ACE System 5500 equipped with a UV to be not very consistent. For instance, the pH- detector for absorbance measurements at 214 nm. dependence of the electrophoretic mobility curves of The dimensional spectral scan of the CE separation cefotaxime and cefuroxime level off at pHs greater was performed on a Beckman P/ACE System MDQ than about 4.2 [22], but the curves of the migration with a photodiode array detector (Beckman Coulter, time versus buffer pH level off at pHs greater than Fullerton, CA, USA). Uncoated fused-silica capil-about 7.5 [21]; the electrophoretic mobility of laries, purchased from Polymicro Technologies cefotaxime and cefuroxime reported previously [22] (Phoenix, AZ, USA), were used. The dimensions of are two orders of magnitude smaller than that of the capillary were 57 cm350 mm I.D. for the cefamandole, but cefamandole migrates in between Beckman P/ACE System 5500 instrument and 60.2
C.-E. Lin et al. / J. Chromatogr. A 879 (2000) 197 –210 199
cm350 mm I.D. for the Beckman P/ACE System least in triplicate to ensure reproducibility. Applied MDQ. The effective length of the capillary is 50 cm voltages of 20 kV for the phosphate buffer and 30 kV from the injection end of the capillary. The CE for the citrate and MES buffers were selected to keep system was interfaced with a microcomputer and a the total current less than 100 mA in order to avoid laser printer. The System Gold software of Beckman experimental complications resulting from Joule was used for data acquisition. For pH measurements, heating. For instance, the current measured for a a pH meter (Suntex Model SP-701, Taipei, Taiwan) phosphate buffer at 150 mM with an applied voltage was employed with a precision of 60.01 pH unit. of 20 kV is 78.7 mA. The detection wavelength was set at 214 nm. The relative standard deviation of 2.2. Chemicals and reagents migration time is less than 0.6% (N55).
For peak identification, on-column UV spectra Twelve cephalosporins were obtained from Sigma (200–300 nm with a 2-nm wavelength increment) of (St. Louis, MO, USA). MES and mesityl oxide (used cephalosporins were recorded simultaneously during as a neutral marker) were purchased from Tokyo the electrophoretic separation. Spiking with the Kasei Kogyo (TCI, Tokyo, Japan). All other chemi- analyte to be identified was also employed.
cals were of analytical-grade. Deionized water was
prepared with a Milli-Q system (Millipore, Bedford, 2.4. Mobility calculations MA, USA).
Standard solutions of cephalosporins at various The electrophoretic mobility of analytes was concentrations ranging from 10 to 50 mg / ml were calculated from the observed migration times with prepared by dissolving analytes in an aqueous solu- the equation:
tion. The pH of a phosphate buffer was adjusted to
L Ld t 1 1 the desired pH value by mixing various proportions m 5 m 2 m 5]] ] ]
? ( 2 )
ep eo V t t
of a certain concentration of sodium dihydrogen- m eo
phosphate solution with the same concentration of
where mep is the electrophoretic mobility of the disodium hydrogenphosphate solution. Similar
pro-analyte tested, m is the apparent mobility, meo is the cedures were followed to adjust the pH of a citrate
electroosmotic mobility, tm is the migration time buffer by mixing various portions of a certain
measured directly from the electropherogram, teo is concentration of trisodium citrate solution with the
the migration time for an unchanged solute, L is thet same concentration of citric acid solution, and to
total length of capillary, L is the length of capillaryd adjust the pH of a MES buffer solutions by mixing
between injection and detection and V is the applied salt solutions with the corresponding acid solutions.
voltage. All buffer solutions, freshly prepared weekly and
stored in a refrigerator before use, were filtered through a membrane filter (0.22 mm).
3. Results and discussion
2.3. Electrophoretic procedure
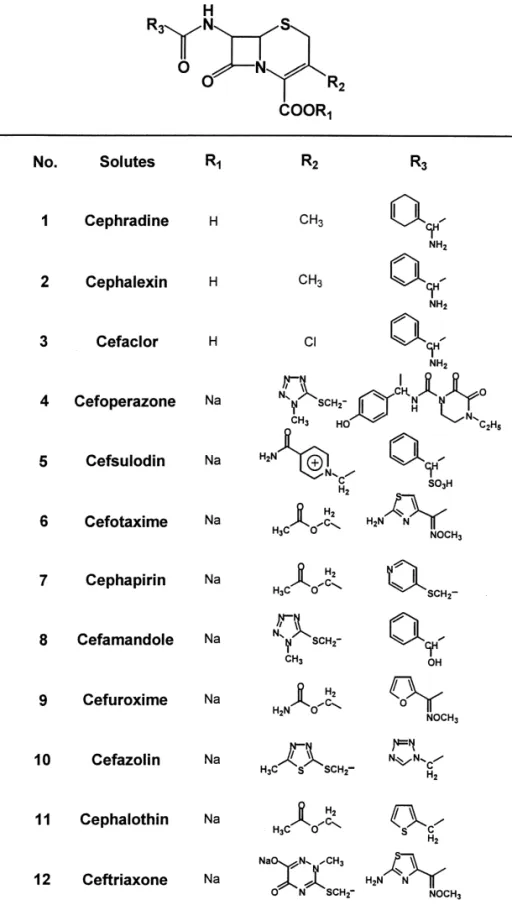
The optimization of the separation of cephalospor-When a new capillary was used, the capillary was ins in CZE can be achieved by manipulation of washed 30 min with 1.0 M NaOH solution, followed separation parameters, such as buffer pH and buffer by 20 min with deionized water at 258C. Before each concentration, of a selected buffer electrolyte. In this injection, the capillary was prewashed for 5 min with work, the combined effects of buffer pH and buffer running buffer and postwashed for 2 min with concentration are taken into consideration to obtain deionized water, 5 min with 1.0 M NaOH and 5 min the optimized separation of 12 cephalosporins. Three with deionized water to maintain proper reproduci- different buffer electrolytes, including phosphate, bility of run-to-run injections. Sample injections citrate and MES are selected to examine the effects were done in a hydrodynamic mode over 4 s under a of buffer electrolytes on the migration behavior and pressure of 0.4 p.s.i. The measurements were run at separation of cephalosporins. The structures of the
12 cephalosporins selected are shown in Fig. 1. (1), cephalexin (2) and cefaclor (3), which will be described later in Section 3.4, are determined to be According to the nature of the carboxyl group of
7.27, 6.96 and 6.92, respectively. cephalosporins, these analytes are categorized into
The electrophoretic mobility of cephapirin (7) two classes. The cephalosporins belonging to class I,
increases with increasing buffer pH from pH 5.5 to possessing their carboxyl groups in the acid-form,
7.8. The variation of the electrophoretic mobility of consist of cephradine (1), cephalexin (2) and
cefa-cephapirin (7) in this pH range is believed due to the clor (3), whereas cephalosporins belonging to class
deprotonation of its pyridinium group at the 7-posi-II, used as sodium salt, include the rest of the nine
tion of the cephem ring. The pK value of this
cephalosporins. a2
pyridinium group, which will be described later in Section 3.4, is determined to be 4.72. Thus, the 3.1. Influence of buffer pH
results that cephapirin (7) appears before cefsulodin (5) at a pH below 5.9 and it elutes together with The pH of the buffer plays an important role in the
cefazolin (10) at a pH above 7.0 is predictable. separation of ionizable analytes since it determines
As shown in Fig. 2, the electrophoretic mobility of the extent of the ionization of the analytes [23,24].
cefotaxime (6) and cefuroxime (9) is essentially Moreover, the charge of the capillary wall surface
pH-independent because these two cephalosporins do and the zeta potential are influenced by buffer pH.
not possess any acidic or basic functional groups Thus, manipulation of buffer pH becomes a key
with pK values lying in the pH range studied. With strategy to optimize the separation in CZE. For a
the phosphate buffer (100 mM ) at pH 6.2, the minimizing any possible degradation due to b-lactam
observed magnitudes of the electrophoretic mobility hydrolysis of cephalosporins, the separations were
of cefotaxime (6) and cefuroxime (9) are 29.03? performed in a weak acidic, neutral or a weak basic
25 25 2 21 21
medium. 10 and 29.65?10 cm V s , respectively,
Fig. 2 shows the influence of buffer pH on the which are greater than those reported previously [22] electrophoretic mobility of 12 cephalosporins with a by a factor of about 45. In addition, the observed phosphate buffer (100 mM ) in the pH range of electrophoretic mobility of cefamandole (8) is
25 2 21 21
5.5–7.8. The electrophoretic mobility (migrating in 29.34?10 cm V s , which is in between the the opposite direction to the electroosmotic flow) of values of cefotaxime (6) and cefuroxime (9). Evi-cephalosporins belonging to class I increases sigmoi- dently, the results indicate that the correctness of dally with the pH of the buffer, whereas the electro- mobility data of these two cephalosporins reported phoretic mobility of cephalosporins belonging to previously [22] are questionable.
class II, except cephapirin (7), remains essentially As the primary amino group of class I cephalo-constant with increasing the pH of the buffer. sporins contribute to their migration behavior in the As shown in Table 1, the class I cephalosporins pH range studied, all members of class I cephalo-possess a carboxylic acid group with pKa1 values in sporins migrate at a slower velocity toward the anode the range 1.5–3.1 and an amino group with pKa2 than those of class II cephalosporins at pH below values in the range 6.8–7.4 [22,25,26]. Thus, these 7.0. Thus in the pH range 5.5–7.0, excluding cephalosporins exist as zwitterionic species in the pH cephapirin (7), the migration of the 11 cephalospor-range studied. As the carboxylic acid group is fully ins selected follows the order: cephradine (1), dissociated at pH.5, the variation in the electro- cephalexin (2),cefaclor (3),cefoperazone (4), phoretic mobility of these three cephalosporins in the cefsulodin (5),cefotaxime (6),cefamandole (8), pH range from 5 to 9 is a result of the increase in the cefuroxime (9),cefazolin (10),cephalothin (11), degree of deprotonation of an amino group at the ceftriaxone (12). Compared with other members of 3-position of the cephem ring. The migration be- class II cephalosporins, it is expected that ceftriaxone havior of these cephalosporins is predictable, once migrates with the greatest mobility towards the the pKa2 value and the limiting electrophoretic anode because it carries an extra negative charge in mobility at pH$pK 12 (or adequate mobility data)a2 the R substituent.2
C.-E. Lin et al. / J. Chromatogr. A 879 (2000) 197 –210 201
and 6.4. As ceftriaxone (12) elutes relatively far behind cephalothin (11), the peak of ceftriaxone which appears at about 20–23 min, depending on the pH of the buffer, is not shown in Fig. 3.
3.2. Influences of buffer concentration
It is well known that, for a given type of buffer electrolyte, the magnitude of the electroosmotic flow ( m ) depends mainly on the zeta potential whicheo decreases with decreasing buffer pH and / or increas-ing ionic strength (or buffer concentration) of the buffer solution. Hence, at a given buffer pH, it is expected that an increase in the ionic strength (or buffer concentration) results in a decrease in the zeta potential, thus leading to a decrease in the value of
meo.Similar arguments can be applied to account for the variation in the electrophoretic mobility ( m ) ofep analytes.
At a particular buffer pH, buffer concentration plays a significant role in the separation of cephalo-sporins. This is particularly true when cefuroxime (9) and cefazolin (10) are simultaneously present as analytes because the resolution of the peaks between
Fig. 2. Electrophoretic mobility of 12 cephalosporins obtained these two cephalosporins is concentration-dependent. with phosphate buffer (100 mM ) at varied pH in the range
They are hardly resolved with the phosphate buffer
5.5–7.8. Capillary: 57 cm350 mm I.D.; the length between
at a concentration of 20 mM, partially resolved at 50
column inlet and detector, 50 cm. Injection method: hydrodynamic
mM and are well separated at a concentration above
mode; pressure, 0.4 p.s.i., 1 p.s.i.56894.76 Pa; injection time, 4 s.
Other operating conditions: 20 kV, 258C and current, 47|91 mA. 100 mM. On the other hand, the separation of
Peak identification: 15cephradine, 25cephaloxin, 35cefaclor, cephalexin (2) and cefaclor (3) and that of cefotax-45cefoperazone, 55cefsulodin, 65cefotaxime, 75cephapirin,
ime (6) and cephapirin (7) depend also on the
85cefamandole, 95cefuroxime, 105cefazolin, 115cephalothin,
concentration of a buffer electrolyte. At pH 6.0, the
125ceftriaxone.
peaks of cefaclor (3) and cephalexin (2) are barely resolved with phosphate buffer at 50 mM. These two peaks are incompletely resolved at 100 mM and are concentration of 100 mM, the resolution of peaks baseline separated at 150 mM with an applied between cephalexin (2) and cefaclor (3) improves as voltage of 20 kV. Similarly, the peak of cephapirin the pH of the buffer increases from 5.8 to 7.0. In (7) almost merges with cefotaxime (6) at 50 mM and fact, the peaks of these two cephalosporins are barely is merely resolved at 100 mM. Fig. 4 shows such resolved at pH 5.8, but they are well resolved at pHs electropherograms of cephalosporins obtained with a above 6.2. Since all of the cephalosporins, except phosphate buffer at pH 6.0. Thus, to achieve op-cephapirin (7), are well separated, complete sepa- timum separation of these 12 cephalosporins, a rations of the 12 cephalosporins can be achieved by phosphate buffer at a concentration of at least 100 careful manipulation of buffer pH at a pH above 6.2. mM at pH 6.2 or at a concentration above 150 mM at Fig. 3 shows the electropherograms of cephalospor- pH 6.0 is required.
ins obtained with a phosphate buffer (100 mM ) at
pHs 5.8, 6.2, 6.4 and 7.0. As shown in Fig. 3B and 3.3. Influences of buffer electrolytes C, complete separations of these cephalosporins were
C.-E. Lin et al. / J. Chromatogr. A 879 (2000) 197 –210 203 Table 1
The pK values and mobility data of cephalosporinsa
Peak Analytes pKa1 pKa2 Limiting
a
mobility : Literature Literature This work
this work values values
Curve-fitting Inflection point
c c 1 Cephradine 2.63 7.30 7.27 7.27 0.95 b b b b 2 Cephalexin 3.11 (2.34) 6.79 (7.08) 6.96 6.96 0.99 c c 2.56 6.88 b b b 3 Cefaclor 2.69 7.38 (7.19) 6.92 6.92 0.01 d d 1.5 7.2 d 4 Cefoperazone 2.6 5 Cefsulodin b b 6 Cefotaxime 2.09 (2.9) d 3.4 7 Cephapirin 4.65 4.72 1.13 b b 8 Cefamandole 2.46 (2.60) d 2.7 b b 9 Cefuroxime 2.04 (2.17) d 10 Cefazolin 2.1 d 11 Cephalothin 2.5 d d 12 Ceftriaxone 3.2 3.2 a 24 2 21 21 Mobility in units of 10 cm V s . b
Ref. [22], values in parathesis determined from potentiometric measurements.
c
Ref. [25].
d
Ref. [26].
cephalosporins in citrate buffer was significantly buffer shown in Fig. 2. The electrophoretic mobility different from that of cephalosporins in phosphate of class I cephalosporins, as well as cephapirin (7), buffer at pH 6.0 [20,21], and the separation of increases considerably, but the electrophoretic cephalosporins was remarkably improved on addition mobility of class II cephalosporins decreases about of tetraalkylammonium salts to the SDS solution 10% of their magnitudes with increasing buffer pH [13]. We thought that the surface modification of the from 5.3 to 6.7. The electrophoretic mobility of capillary wall with the use of a zwitterionic buffer, cephalosporins measured in citrate buffer has a 1.2– such as MES, and that the electrostatic forces of the 1.3 fold increase, compared with the corresponding attraction and repulsion between cephalosporins and mobility measured in a phosphate buffer, whereas zwitterionic buffer electrolytes, would influence sig- the electroosmotic mobility has a 1.1–1.3 fold nificantly the migration behavior and separation of increase with increasing buffer pH from 5.5 to 7.0. cephalosporins. Thus, it would be of interest to With the citrate buffer at a pH below 5.3, the examine the effects of separation parameters using absolute magnitudes of the electrophoretic mobility these two types of buffer electrolyte. of class II cephalosporins, expect cephapirin (7) and cefoperazone (4), exceed that of the electroosmotic 3.3.1. Citrate buffer mobility, thus leading to the disappearance of the Fig. 5 shows the effect of the buffer pH on the signals of the cephalosporins that elute later than migration and separation of cephalosporins in the pH cefoperazone (4). Similar phenomena were also range 5.3–6.7 using citrate buffer at a concentration observed with a citrate buffer at a lower concen-of 40 mM. As can be seen, the trends in the variation tration, but at a lower buffer pH. The disappearance of the electrophoretic mobility of these 12 cephalo- of the signals of these cephalosporins occurred at pH sporins as a function of buffer pH with citrate buffer below 5.0 with citrate buffer at a concentration of 35 are similar to those observed with the phosphate mM.
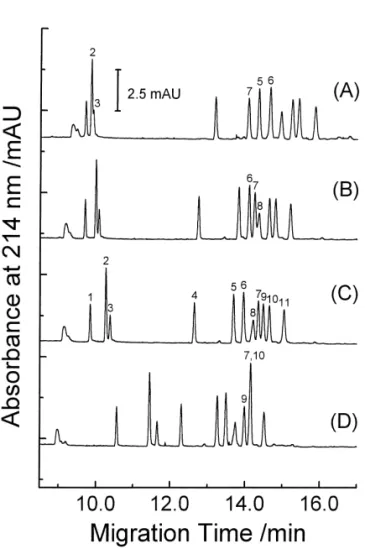
Fig. 4. Electropherograms of cephalosporins obtained with phos-Fig. 3. Electropherograms of cephalosporins obtained with phos- phate buffer at varied concentrations at pH 6.0: (A) 50 mM, (B) phate buffer (100 mM ) at varied pH: (A) 5.80, (B) 6.21, (C) 6.4, 100 mM, and (C) 150 mM. Operating conditions and peak (D) 7.00. Operating conditions and peak identification as for Fig. identification as for Fig. 2.
2.
As indicated in Fig. 5, with the citrate buffer at a concentration of 50 mM, the current of the electro-concentration of 40 mM, the peaks of cephalexin (2) phoretic system exceeds 100 mA at pHs above 6.0. and cefaclor (3) are well separated in the pH range Hence, in order to avoid experimental difficulties due studied. A similar situation is encountered to the to excessive Joule heating, the use of the citrate peaks of cefuroxime (9) and cefazolin (10). Hence, buffer at concentrations greater than 50 mM is not by manipulating the buffer pH in the range 5.5–6.2, recommended. On the other hand, at buffer con-the overlapping of con-the peak of cephapirin (7) with centrations below 35 mM, the peaks of cephalexin the others may be avoided and complete separations (2) and cefaclor (3) are baseline separated only at a of the 12 cephalosporins selected can be easily pH above 6.2. Unfortunately, the peaks of cefurox-achieved. As a matter of fact, complete separations ime (9) and cefazolin (10) can not be well resolved of 12 cephalosporins can be achieved at pHs 5.5, 5.8, at pHs above 5.6. Thus complete separation of the 12 6.0 and 6.2. Fig. 6 shows the electropherograms of cephalosporins is impossible to achieve with citrate the 12 cephalosporins obtained with the citrate buffer buffer at concentrations below 35 mM.
at these pH values. As the extent of the increase in the magnitude of The optimum concentration of the citrate buffer is the electroosmotic mobility ( m ) and the extents ofeo confined in a small range. With the citrate buffer at a the increase in the electrophoretic mobility of class I
C.-E. Lin et al. / J. Chromatogr. A 879 (2000) 197 –210 205
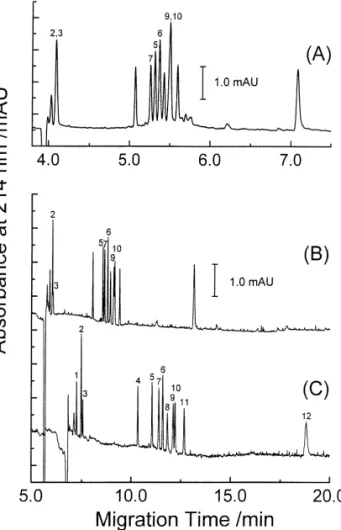
Fig. 6. Electropherograms of cephalosporins obtained with citrate Fig. 5. Electrophoretic mobility of cephalosporins obtained with
buffer (40 mM ) at varied pH: (A) 5.5, (B) 5.8, (C) 6.0, (D) 6.2. citrate buffer (40 mM ) at varied pH in the range 5.5–6.7.
Operation conditions and peak identification as for Fig. 5. Operating conditions and curve identification as for Fig. 2, except
that the applied voltage is 30 kV.
in the range 5.5–7.3 using MES buffer at a con-centration of 260 mM. In general, the trends in the cephalosporins and the decrease in the
electropho-variation of the electrophoretic mobility of these 12 retic mobility of class II cephalosporins with the
cephalosporins as a function of buffer pH with MES citrate buffer are much greater than those of the
buffer are similar to those observed with the phos-corresponding mobility with the phosphate buffer
phate and citrate buffers (shown in Figs. 2 and 5, when the pH of the buffer increases from 5.3 to 6.7,
respectively). However, the electrophoretic mobility the difference between the electrophoretic mobility
of each individual cephalosporin increases about 5% of each analyte and electroosmotic mobility at a
of its magnitude when the buffer pH increases from particular buffer pH is greater with the citrate buffer
5.5 to 7.3. The electrophoretic mobility of cephalo-than with the phosphate buffer. Comparing Fig. 6
sporins measured in MES buffer has a slight in-with Fig. 3, better separability and shorter analysis
crease, compared with the corresponding mobility time is clearly illustrated when using the citrate
measured in the phosphate buffer. Since the mag-solutions as a buffer electrolyte.
24 nitude of meodecreases quite rapidly from 2.85?10
2 21 21 24 2 21 21
3.3.2. MES buffer cm V s at pH 5.5 to 2.25?10 cm V s at
Fig. 7 shows the variation of electrophoretic pH 6.2, and then gradually decreases further to
24 2 21 21
Fig. 7. Electrophoretic mobility of cephalosporins obtained with MES buffer (260 mM ) at varied pH in the range 5.5–7.3. Operating conditions and curve identification as for Fig. 5.
Fig. 8. Electropherograms of cephalosporins obtained at pH 6.21 with MES buffer at varied concentrations: (A) 40 mM, (B) 150 mM, (C) 260 mM. Operating conditions and peak identification as for Fig. 5.
cephalosporins move towards the position of neutral marker as the buffer pH decreases. To achieve complete separation of these 12 cephalosporins, the buffer pH at 6.2 should be selected when using the
MES buffer at the concentration of 260 mM. With later than cefsulodin (5) at or above 260 mM. this buffer concentration, the current measured was Moreover, the resolution of the peaks between
about 70 mA. cephalexin (2) and cefaclor (3) and that of the peaks
The electrophoretic mobility of cephalosporins between cefuroxime (9) and cefazolin (10) are increases with increasing buffer concentration. Fig. 8 significantly affected by varying the concentration of shows the electropherograms of cephalosporins ob- the MES buffer. In fact, these two pairs of peaks are tained with the MES buffer at concentrations of 40, well resolved at a concentration greater than 260 mM 150 and 260 mM at pH 6.21. The migration of with the MES buffer at pH 6.2.
cephapirin (7) is markedly influenced by the con- It should be noted that complete separations are centration of the MES buffer. The peak of cephapirin much easier to achieve when cephalexin (2) and (7) appears before cefsulodin (5) with the buffer cefaclor (3) or cefuroxime (9) and cefazolin (10) are concentration at 40 mM. However, cephapirin (7) not simultaneously present as analytes. As shown in comigrates with cefsulodin (5) at 150 mM, but elutes Fig. 8A, most of the cephalosporins studied can be
C.-E. Lin et al. / J. Chromatogr. A 879 (2000) 197 –210 207
easily and effectively separated even with the MES pH (DpH), say 0.005, in the pH range studied are buffer at a concentration as low as 40 mM at pH calculated. The first or second derivative of Dm with
6.21. respect to DpH is then plotted against buffer pH for
each mobility curve and the pH value of the inflec-3.4. Determination of pKa2 value and prediction of tion point corresponding to the pKa value is de-migration behavior termined. Fig. 9 shows such plots for cephradine (1), cephalexin (2), cefaclor (3) and cephapirin (7). The The pKa2 values of class I cephalosporins in the arrows shown in Fig. 9 indicate the positions of the phosphate buffer (100 mM ) and that of cephapirin inflection points of these mobility curves. The pKa (7) in the citrate buffer (35 mM ) can be determined values of cephradine (1), cephalexin (2), cefaclor (3) from the inflection points of the electrophoretic and cephapirin (7) determined are 7.27, 6.96, 6.92 mobility curves which are the plots of electrophoretic and 4.72, respectively. As the literature values of the mobility versus buffer pH. To determine the pKa pKa2 of nicotinic acid attributed to the pyridinium value of an analyte, a simulated mobility curve group is 4.81 [27], the determined pKa2 value of which is best-fitted to the experimental mobility cephapirin (7) would be a reasonable value. curve is first obtained through the utilization of the As mentioned earlier, the carboxylic acid group of Sigmoidal Fit of Microcal Origin software (version cephalosporins is fully dissociated at pH.5 and the 5.0) so that small differences in the electrophoretic variation of the electrophoretic mobility of cep-mobility (Dm) for every small increment of buffer hradine (1), cephalexin (2), cefaclor (3) and
Fig. 9. The pKa2 values of cephalosporins determined from the inflection points of pH-dependent mobility curves: (A) cephradine (1), cephalexin (2) and cefaclor (3) in phosphate buffer (100 mM ), (B) cephapirin (7) in citrate buffer (35 mM ). Other operating conditions in the cases of (A) and (B) are the same as for Fig. 2 and Fig. 5, respectively. Arrows indicate the inflection points of mobility curves.
cephapirin (7) in the pH range studied is the result of values of pKa2 and limiting mobility of each in-the increase in in-the degree of deprotonation of eiin-ther dividual cephalosporin are first estimated from the an amino group or a pyridinium group of the specific mobility curve. The best-fitted pKa2 value and limit-cephalosporin. Thus, the effective electrophoretic ing mobility are then determined by varying the trial mobility ( m ) of these cephalosporins as a functioneff values of these two parameters until the predicted of buffer pH can be described by the following mobility curve calculated by using Eq. (1) is best equation modified from the one used for cationic fitted to the experimental mobility curve through the
species [28,29]: utilization of Microcal Origin software. Fig. 10
shows the mobility curves obtained for these four 1
cephalosporins. As can be seen, the agreement [H O ]m3 BH1
]]]]
meff5 1 2mBH1 between the predicted mobility curves (represented [H O ] 1 K3 a2
by solid or dash lines) and the observed mobility K ma2 BH1 curves (shown by data points) is very good. Table 1
]]]]
5 2 1 (1)
lists the pK values and the mobility data evaluated,
[H O ] 1 K3 a2 a2
together with the pK values reported in the literaturea where mBH1is the electrophoretic mobility of the [22,25,26]. The pKa2 values determined from the protonated form of a zwitterionic solute. According- inflection-point and curve-fitting methods agree very ly, the migration behavior of these cephalosporins in well. It is noted that a small correction to the the pH between pK 22 and pK 12 can be pre-a2 a2 effective mobility is sometimes necessary for the dicted using Eq. (1), provided that the pKa2 values best fit of mobility curves for class I cephalosporins. and the necessary mobility data are available. For instance, for the mobility curves shown in Fig. To determine the pKa2 values of cephalosporins 9A, a small correction of 20.04 was made. This is properly from the curve-fitting method, the trial perhaps due to a small contribution to the
electro-Fig. 10. The agreement between the predicted mobility curves (represented by solid and dash lines) and observed mobility curves (shown by data points) for cephalosporins: (A) cephradine (1), cephalexin (2) and cefaclor (3), (B) cephapirin (7).
C.-E. Lin et al. / J. Chromatogr. A 879 (2000) 197 –210 209
phoretic mobility from other structural moieties of more accurate pKa2 value of cefaclor (3) than that cephalosporins. reported previously [22] is obtained in this work.
It should be pointed out that the pKa2 value of cefaclor (3) reported previously by Mrestani et al.
3.5. Peak confirmation [22] was not accurate enough because the mobility
curves of cephalexin (2) and cefaclor (3) shown in
In the course of our investigation, the migration Fig. 3 from [22] are very close to each other and the
order of cephalosporins between cefotaxime (6) and difference in the pKa2 values of these two cephalo- cefuroxime (9) is contradictory to that reported by sporins determined by the CE method may be less
Mrestani et al. [20]. In order to confirm the correct-than 0.2, as was determined from the potentiometric
ness of our assignments for these two peaks, a real measurements [22]. The results shown in Figs. 9A or
sample of cefuroxime (Lifurox) obtained from Lilly 10A clearly demonstrate that the difference in pKa2 (Taiwan) was injected into the CE system. Fig. 11A values between cephalexin (2) and cefaclor (3) is
shows the electropherogram obtained for a standard only 0.04, with the pK value of cefaclor (3) beinga solution containing cefotaxime (6), cefuroxime (9) smaller than that of cephalexin (2). Therefore, a
and cefazolin (10) (50 mg / ml each dissolved in an injection fluid). A amount of 20 mg / ml of urea was added to the sample solutions in order to examine whether urea contained in urine samples can affect the migration order of cefotaxime (6) and cefurox-ime (9) using citrate buffer (50 mM ) at pH 6.0. Fig. 11B shows the electropherogram of these three analytes obtained after spiking with Lifurox (50
mg / ml). As can be seen, the relative migration time
of the cefuroxime standard and that of Lifurox to cefazolin (10) or to cefotaxime (6) is agreeable. Evidently, the result confirms that our assignments for these peaks should be beyond doubt. On the contrary, the assignments made by Mrestani et al. [20] are questionable.
4. Conclusions
Although manipulation of buffer pH is a key strategy to optimize the separation of cephalosporins in CZE, combined effects of buffer pH and buffer concentration should be taken into consideration to optimize the separation of cephalosporins, particu-larly when cefotaxime and cephapirin, cephalexin and cefaclor, or cefuroxime and cefazolin, are simul-taneously present. Complete separations of 12 ceph-alosporins are achievable with citrate, MES and phosphate buffers under various optimum conditions.
Fig. 11. Electropherograms of cefotaxime, cefuroxime and However, citrate and MES buffers are superior to the cefazolin obtained with citrate buffer (50 mM ) at pH 6.0: (A) a
phosphate buffer in the CZE separation of the
mixture of standards (50 mg / ml each), (B) a standard solution of
cephalosporins. The migration behavior of these
(A) spiking with Lifurox (50 mg / ml). Operation conditions and
[14] S.H. Chen, H.L. Wu, S.M. Wu, H.S. Kou, S.J. Lin, J. Chin.
Acknowledgements
Chem. Soc. 43 (1996) 393.
[15] C.J. Sciacchitano, B. Mopper, J.J. Specchio, J. Chromatogr.
We thank the National Science Council of Taiwan B 657 (1994) 395.
for financial support. [16] O.K. Choi, Y.S. Song, J. Pharm. Biomed. Anal. 15 (1997) 1265.
[17] G. Castaneda Penalvo, E. Julien, H. Fabre, Chromatographia 42 (1996) 159.
References
[18] G. Castaneda Penalvo, M. Kelly, H. Maillois, H. Fabre, Anal. Chem. 69 (1997) 1364.
[1] F. Pehourcq, C. Jarry, J. Chromatogr. A 812 (1998) 159. [19] H. Fabre, G. Castaneda Penalvo, J. Liq. Chromatogr. 18 [2] J.J. Kirschbaum, A. Aszolos, in: A. Aszalos (Ed.), Modern (1995) 3877.
Analysis of Antibiotics, Marcel Dekker, New York, 1986. [20] Y. Mrestani, R. Neubert, A. Hartl, J. Wohlrab, Anal. Chim. [3] C.M. Moore, K. Sato, Y. Katsumato, J. Chromatogr. 539 Acta 349 (1997) 207.
(1991) 215. [21] Y. Mrestani, R. Neubert, I. Schiewe, A. Hartl, J. Chromatogr. [4] M.C. Hsu, Y.S. Lin, C.H. Chung, J. Chromatogr. A 692 B 690 (1997) 321.
(1994) 67. [22] Y. Mrestani, R. Neubert, A. Munk, M. Wiese, J. Chromatogr. [5] A.K. Seneviratne, A.L. Jayewardene, J.G. Gambertoglio, J. A 803 (1998) 273.
Liq. Chromatogr. 17 (1994) 4157. [23] C.E. Lin, W.C. Lin, W.C. Chiou, J. Chromatogr. A 705 [6] S.F.Y. Li, Capillary Electrophoresis: Principles, Practice and (1995) 325.
Applications, Elsevier, Amsterdam, 1993. [24] S.C. Smith, M.G. Khaledi, Anal. Chem. 65 (1993) 193. [7] N.A. Guzman (Ed.), Capillary Electrophoresis Technology, [25] C.G. Pinto, J.L.P. Pavon, B.M. Cordero, Analyst 120 (1995)
Marcel Dekker, New York, 1993. 53.
[8] P. Camilleri (Ed.), Capillary Electrophoresis: Theory and [26] W.O. Foye, T.L. Lemke, D.A. Williams, Principles of Practice, CRC Press, Boca Raton, FL, 1993. Medicinal Chemistry, 4th ed., Blackwell, Baltimore, MD, [9] D. Coleman (Ed.), Directory of Capillary Electrophoresis, 1995.
Elsevier, Amsterdam, 1994. [27] D.C. Harris, Quantitative Chemical Analysis, 5th ed., [10] J.P. Landers (Ed.), Handbook of Capillary Electrophoresis, Freeman, New York, NY, 1998, AP 24.
CRC Press, Boca Ration, FL, 1994. [28] C.E. Lin, C.C. Chang, W.C. Lin, J. Chromatogr. A 768 [11] H. Shintani, J. Polonsky (Eds.), Handbook of Capillary (1997) 105.
Electrophoresis Applications, Blackie, London, 1997. [29] C.E. Lin, Y.T. Chen, J. Chromatogr. A 871 (2000) 357. [12] H. Nishi, N. Tsumagari, T. Kakimoto, S. Terabe, J.
Chroma-togr. 477 (1989) 259.
[13] H. Nishi, N. Tsumagari, S. Terabe, Anal. Chem. 61 (1989) 2434.