國
立
交
通
大
學
電機與控制工程學系
碩
士
論
文
研發無線感測網路用於居家健康照護
Development of Wireless Sensor Network for Home Health-Care Application
研 究 生:林俊良
指導教授:陳右穎 博士
研發無線感測網路用於居家健康照護
Development of Wireless Sensor Network for Home Health-Care Application
研 究 生:林俊良 Student:Jun-Liang Lin
指導教授:陳右穎 Advisor:Dr. You-Yin Chen
國 立 交 通 大 學
電機與控制工程系
碩 士 論 文
A Thesis
Submitted to Department of Electrical and Control Engineering College of Electrical Engineering
National Chiao Tung University in partial Fulfillment of the Requirements
for the Degree of Master
in
Electrical and Control Engineering
June 2006
Hsinchu, Taiwan, Republic of China
博碩士論文授權書
本授權書所授權之論文為本人在_________大學(學院)______系所 _______組______學年度第___學期取得___士學位之論文。 論文名稱:______________________________ 指導教授:______________________________ 1.□同意 □不同意 本人具有著作財產權之上列論文全文(含摘要)資料,授予行政院國家科學委員會科學技 術資料中心(或改制後之機構),得不限地域、時間與次數以微縮、光碟或數位化等各種 方式重製後散布發行或上載網路。 本論文為本人向經濟部智慧財產局申請專利(未申請者本條款請不予理會)的附件之一, 申請文號為:______________,註明文號者請將全文資料延後半年再公開。 2.□同意 □不同意 本人具有著作財產權之上列論文全文(含摘要)資料,授予教育部指定送繳之圖書館及國 立交通大學圖書館,基於推動讀者間「資源共享、互惠合作」之理念,與回饋社會及學 術研究之目的,教育部指定送繳之圖書館及國立交通大學圖書館得以紙本收錄、重製與 利用;於著作權法合理使用範圍內,不限地域與時間,讀者得進行閱覽或列印。 本論文為本人向經濟部智慧財產局申請專利(未申請者本條款請不予理會)的附件之一, 申請文號為:______________,註明文號者請將全文資料延後半年再公開。 3.□同意 □不同意 本人具有著作財產權之上列論文全文(含摘要),授予國立交通大學與台灣聯合大學系統 圖書館,基於推動讀者間「資源共享、互惠合作」之理念,與回饋社會及學術研究之目 的,國立交通大學圖書館及台灣聯合大學系統圖書館得不限地域、時間與次數,以微縮、 光碟或其他各種數位化方式將上列論文重製,並得將數位化之上列論文及論文電子檔以 上載網路方式,於著作權法合理使用範圍內,讀者得進行線上檢索、閱覽、下載或列印。 論文全文上載網路公開之範圍及時間 – 本校及台灣聯合大學系統區域網路: 年 月 日公開 校外網際網路: 年 月 日公開 上述授權內容均無須訂立讓與及授權契約書。依本授權之發行權為非專屬性發行權利。依本授 權所為之收錄、重製、發行及學術研發利用均為無償。上述同意與不同意之欄位若未鉤選,本 人同意視同授權。 研究生簽名: 學號: (親筆正楷) (務必填寫) 日期:民國 年 月 日 1. 本授權書請以黑筆撰寫並影印裝訂於書名頁之次頁。國家圖書館博碩士論文電子檔案上網授權書
本授權書所授權之論文為本人在_________大學(學院)______系所 _______組______學年度第___學期取得___士學位之論文。 論文名稱:______________________________ 指導教授:______________________________ □同意 □不同意 本人具有著作財產權之上列論文全文(含摘要),以非專屬、無償授權國家圖書館,不限地域、時間 與次數,以微縮、光碟或其他各種數位化方式將上列論文重製,並得將數位化之上列論文及論文電 子檔以上載網路方式,提供讀者基於個人非營利性質之線上檢索、閱覽、下載或列印。 上述授權內容均無須訂立讓與及授權契約書。依本授權之發行權為非專屬性發行權利。依本授權所 為之收錄、重製、發行及學術研發利用均為無償。上述同意與不同意之欄位若未鉤選,本人同意視 同授權。 研究生簽名: 學號: (親筆正楷) (務必填寫) 日期:民國 年 月 日 1. 本授權書請以黑筆撰寫,並列印二份,其中一份影印裝訂於附錄三之一(博碩士論文授 權書)之次頁﹔另一份於辦理離校時繳交給系所助理,由圖書館彙總寄交國家圖書館。研發無線感測網路用於居家健康照護
學生:林俊良
指導教授:陳右穎 博士
國立交通大學電機與控制工程學系 碩士班
摘
要
無線感測網路尚未廣泛地應用於居家健康照護服務上,大多數在健康照護相關方面的研究都 只著重於點對點的傳輸,而沒有採取網路的架構。如此,將會使系統的擴充性受到限制。然而少 數具有使用網路架構的研究大都採用藍芽的無線傳輸技術,藍芽是無線個人區域網路的標準之 一,其Piconet 網路最多只容許八個裝置加入,網路定址能力將受到限制。為了實現無線感測網路, 使其具有高度網路定址能力,本研究透過ZigBee 發展無線感測網路。ZigBee 為無線個人區域網 路,其建構在IEEE 802.15.4 的標準之上,具低功率消耗,高度網路定址能力的優點。 本研究所實現之居家健康照護系統是由多個無線生理信號感測器、路由器與個人區域網路仲 裁器所組成的。開發此系統之硬體平台包含了一個微控制器 (MSP430F1611, TI, USA) 與 ZigBee 射頻晶片(UZ2400, UBEC, Taiwan)。本研究已完成 ZigBee 網路層之開發,並建構無線感測網路為 一個樹狀三階層式之架構。透過無線生理感測器量測病人之心電圖與血氧濃度傳送至路由器;路 由器負責分配每個無線感測器可擁有的傳送時間,使用階層式的路由方式將封包傳送給個人區域 網路仲裁器。個人區域網路仲裁器接收路由器傳送之封包並取出生理信號資料,以RS232 傳送至 個人電腦。 居家健康照護上常伴隨大量生理信號的處理,由於無線感測網路在管理與控制會面臨棘手的 問題,例如感測裝置如何做有效的管理及資料時效性的問題, 因此本研究採用 web-based 的管理 方式,並結合web 2.0 的概念, 使生理信號圖形能夠流暢地顯示於網頁上。其技術主要結合非同步 Java 描述語言、可延伸性標示語言、可縮放向量圖形與資料庫,具有跨平台、不受空間限制與整 合性等優點。 本研究已建構完具有遠端監控與管理能力之無線感測網路系統,其優點為具有高定址能力、 低功率消耗、快速反應時間。將本研究應用於居家健康照護系統上,可讓病人在家裡就可以透過 此系統讓醫生即時監看居家病人的健康情形,但是在病人隱私權上面卻是相當有道德爭議,未來 居家健康照護系統須加強資料安全以保護病人隱私。 關鍵字: 無線感測網路; ZigBee;心電圖;血氧濃度;可縮放向量圖形。
Development of Wireless Sensor Network for Home Health-Care Application
Student:Jun-Liang Lin
Advisors:Dr. You-Yin Chen
Degree Program of Electrical and Control Engineering
National Chiao Tung University
ABSTRACT
The Wireless Sensor Network (WSN) is an underdeveloped area today in the health-care service industry. Many studies in health-care issues focus on implementation of peer-to-peer communication without network topology, which refers to the extension of system limits. Furthermore, most studies adopt Bluetooth, which is a wireless standard for the Wireless Personal Area Network (WPAN). Bluetooth has limited addressing capability; a Piconet of Bluetooth contains eights devices at most. For the above reasons this study uses ZigBee, a wireless standard based on IEEE 802.15.4, which is a WPAN with low power consumption and high addressing capability.
The home-care system proposed in this study consists of sensor devices, a router, Personal Area Network (PAN) coordinators and a remote database server. The sensor device, router and PAN coordinator are all developed on the ZigBee module, which consists of a micro-controller (MCU; MSP430F1611, TI, USA) and a ZigBee RF chip (UZ2400, UBEC, Taiwan). Furthermore, the ZigBee network (NWK) layer and application (APP) layer are built on MCU for a WSN with three-level topology. For the sensor devices, physiological signals of the electrocardiogram (ECG) and (Oxygen Saturation) SpO2 are measured from patients and then transmitted to the router. The router is responsible
for scheduling a sending time for each associated device and using hierarchical routing to forward data to a specific device. On the PAN coordinator side, data is extracted from received packages and then passed to the personal computer through RS232.
Due to the large number of sensor devices in the WSN, management and querying present a number of problems. In this study a web-based management method is used to manage physiological information in the WSN. To display physiological signals on the web interface smoothly and rapidly, the latest design of web 2.0, which contains Ajax (Asynchronous Java Script + XML) and Scalable Vector Graphing (SVG), is adopted. This is a high-performance web based technology that is cross-platform, has no limitations of space and integrates the WSN and database servers.
The WSN with web-based management has been implemented successfully with many advantages, including higher addressing capability, lower power consumption, and reduced waking time. The system proposed in this study has the potential to bring healthcare out of the hospital and into the patient’s home, replace nurses with sensor devices, and collect sensitive information. This will create many ethical considerations, which must be dealt with in order to ensure that any changes made in the health-care industry are for the good of the patients.
Keywords: Wireless Sensor Network, ZigBee, Electrocardiogram, Oxygen Saturation, Scalable Vector Graph
誌
謝
在碩士班的求學過程中,首先要感謝我的指導老師陳右穎博士,在我求學生涯中,老師除了 在研究上對我細心指導,在待人處事上也給我許多的教導,使得我的研究不僅有所收穫,並且能 夠順利完成本論文;此外還要感謝我的口試委員:曾煜棋、黃育綸與張淵仁教授,他們在口試中 給我許多寶貴的意見,讓我成長茁壯。對於所有教導過我的所有師長們,讓我在兩年的學習的過 程中獲益良多,我更是懷著感恩的心,謝謝您們的教導。 另外,我還要感謝台灣新竹的達盛電子提供我一個完善的實驗平台與諮詢,讓我能夠有優良 的學習成果。對於達盛電子的簡嘉瑋經理、黃國彰經理、俊嘉、鈞泰以及所有達盛電子的員工們 的熱心協助與關心,我充滿了無限的感激與謝意。更要感謝交通大學給我良好的學習與研究環境, 讓我可以在這兩年中成長與茁壯。我還要感謝實驗室各位學長姐弟妹們,在實驗室裡的生活有了 他們的幫忙以及扶持,使得我在這兩年能夠過得充實且多采多姿,感謝碩仁、信賢、毓廷學弟妹 們的幫忙與支持,更要感謝修宏學長、家禎學姊的鼓勵與指導。對於同屆的富全,在研究上彼此 互相幫忙與協助,我充滿了感激的心。此外還要感謝所上助教們的幫忙和提供的設備資源,還有 電控所94 級的所有同學以及一些默默關心我的朋友們,在這天時地利人和的配合之下順利完成碩 士學位。 最後,我要感謝我親愛的家人,我的父母與我的弟弟,尤其感謝我父母親從小到大的栽培, 由於他們的支持、鼓勵、教誨以及無限的愛,才能讓我今天得以順利完成本論文而取得碩士學位, 僅以本論文獻給我最親愛的家人。
Contents
CHAPTER 1
INTRODUCTION...1
1.1.MOTIVATION... 1
1.2.REVIEW OF THE LITERATURE... 2
1.3.OBJECTIVE... 5
1.4.THESIS ORGANIZATION... 5
CHAPTER 2
SENSORS DESIGN ...6
2.1.OVERVIEW OF THE SYSTEM DESIGN... 6
2.2.SENSORS... 7
2.2.1. ECG Sensor... 8
2.2.2. SpO2 Sensor... 14
CHAPTER 3
WIRELESS SENSOR NETWORK ...18
3.1.INTRODUCTION TO WIRELESS TRANSMISSION SPECIFICATIONS... 18
3.1.1. Bluetooth ... 18
3.1.2. ZigBee ... 18
3.1.3. Advantages of ZigBee... 19
3.2.HARDWARE DESIGN... 20
3.2.1. Micro-Controller Unit (MCU) ... 21
3.2.2. ZigBee Chip ... 21
3.2.3. SPI Mode... 22
3.3.FIRMWARE AND SOFTWARE DESIGN... 22
3.3.1. Introduction to RTOS ... 22
3.3.3. Network Layer Design Based on a MAC Layer ... 27
3.3.4. Implementation of the ZigBee Protocol Stack ... 28
3.4.PCAPPLICATION... 44
3.4.1. Development Language and Tools... 44
3.4.2. Flowchart of PC Application ... 44
CHAPTER 4
WEB-BASED MANAGEMENT SYSTEM...46
4.1.OVERVIEW OF THE WEB-BASED MANAGEMENT SYSTEM... 46
4.2.WEB TECHNOLOGY... 47
4.2.1. Ajax (Asynchronous Java Script + XML) ... 47
4.2.2. SVG (Scalable Vector Graphics) ... 47
4.2.3. Web Program Design... 48
4.3.DATABASE DESIGN... 49 4.3.1. ODBC API ... 50 4.3.2. ODBC Structure... 50 4.4.ODBCAPI ... 51 4.4.1. SQL ... 51 4.4.2. Result of the SQL... 52
4.4.3. Use Procedure of ODBC API ... 52
4.4.4. Data type transfer between Database and C language... 52
CHAPTER 5
EXPERIMENTAL RESULTS...54
5.1.ECGWAVEFORM ON A SENSOR... 54
5.2.ECGWAVEFORM ON A PCAPPLICATION... 55
5.3.ECGWAVEFORM ON A WEB BROWSER... 55
5.5.DISPLAY PANEL OF THE WIRELESS SENSOR NETWORK... 59
5.6.PACKET SNIFFING... 59
CHAPTER 6
DISCUSSION ...60
6.1.COMPARISON WITH EXISTING STUDIES... 60
6.2.ADVANCED APPLICATIONS FOR THE WIRELESS SENSOR NETWORK... 61
6.2.1. Advanced Home-Care Applications ... 61
6.2.2. Home Automation Applications ... 61
6.2.3. Security Issues... 62
CHAPTER 7
CONCLUSIONS AND FUTURE RESEARCH .63
7.1.CONCLUSIONS... 637.2.CONTRIBUTIONS FOR THIS STUDY... 63
7.3.LOCATION ESTIMATION... 64
APPENDIX A. ...65
APPENDIX B. ...83
APPENDIX C. ...91
List of Tables
TABLE 3-1COMPARISON BLUETOOTH WITH ZIGBEE... 20
TABLE 3-2COMPARISON BLUETOOTH WITH ZIGBEE IN POWER CONSUMPTION... 20
TABLE 3-4SUMMARY OF THE PRIMITIVE FOR NLME ENTITY... 28
List of Figures
FIG.2-1STRUCTURE OF WHOLE WIRELESS SENSOR NETWORK WITH WEB-BASED MANAGEMENT... 7
FIG.2-2CARDIAC VECTOR DIAGRAM... 8
FIG.2-3 LEAD IIECG DIAGRAM... 9
FIG.2-4. EVERY COMPONENT OF ECG WAVEFORM DIAGRAMS... 10
FIG.2-5BLOCK DIAGRAM OF ECG SENSOR... 11
FIG.2-6 SEMANTIC DIAGRAM OF THE DIFFERENTIAL INPUT STAGE FOR ECG SENSOR... 12
FIG.2-7SEMANTIC DIAGRAM OF GAIN AND FILTER STAGE FOR ECG SENSOR... 13
FIG.2-8SEMANTIC DIAGRAM OF THE ANTI MOTION ARTIFACT STAG FOR ECG SENSOR... 13
FIG.2-9SEMANTIC DIAGRAM OF THE DRIVEN-RIGHT-LEG (DRL) CIRCUIT FOR ECG SENSOR... 14
FIG.2-10FLOWCHART OF SPO2PARSER... 17
FIG.3-1PICO-NET DIAGRAM FOR BLUETOOTH... 18
FIG.3-3ZIGBEE PROTOCOL STACK DIAGRAM... 25
FIG.3-4FLOW DIAGRAM OF PRIMITIVE CONCEPT... 26
FIG.3-5FLOWCHART OF END DEVICE WITH ECG SENSOR... 31
FIG.3-6HARDWARE BLOCK DIAGRAM... 32
FIG.3-7MESSAGE FLOW CHART OF END DEVICE WITH ECG SENSOR... 33
FIG.3-8FLOWCHART FOR END DEVICE WITH SENSOR... 35
FIG.3-9HARDWARE BLOCK DIAGRAM OF END DEVICE WITH SENSOR... 36
FIG.3-10MESSAGE FLOW CHART FOR END DEVICE WITH SPO2 SENSOR... 38
FIG.3-11TIME SLICE DIAGRAM OF SENDING TIME FOR EACH DEVICE... 38
FIG.3-12FLOWCHART OF ROUTER... 39
FIG.3-13FLOWCHART OF PANCOORDINATOR... 41
FIG.3-14MESSAGE FLOW CHART FOR PANCOORDINATOR... 43
FIG.3-15FLOWCHART OF PC’S END PROGRAM... 46
FIG.4-1OVERVIEW DIAGRAM OF WEB-BASED MANAGEMENT SYSTEM... 46
FIG.4-2MODEL OF AJAX WEB PAGE... 47
FIG.4-3FLOWCHART OF WEB PAGE PROGRAM USING AJAX AND SVG TECHNOLOGIES... 49
FIG.4-4TABLE FORMAT FOR ECG TABLE, HEART RATE TABLE,SPO2TABLE, ... 50
FIG.4-5TABLE FORMAT FOR SENSOR STATUS TABLE. ... 50
FIG.4-6 STRUCTURE DIAGRAM OF ODBC ... 50
FIG.4-8FLOWCHART OF ODBC OPERATION... 53
FIG.5-1ECG WAVEFORM ON SENSOR... 55
FIG.5-2ECG WAVEFORM ON PC APPLICATION... 55
FIG.5-3ECG WAVEFORM ON WEB BROWSER... 56
FIG.5-5SPO2 WAVEFORM ON WEB BROWSER... 57
FIG.5-6THE COMPLETED PROTOTYPE OF WIRELESS ECG MONITORING SYSTEM USING WIRELESS SENSOR NETWORK... 58
FIG.5-8 THE DISPLAY PANEL OF WIRELESS SENSOR NETWORK FOR HOME HEALTH-CARE SYSTEM ON WEB PAGE... 59
FIG.A-1FLOWCHART OF DATA SERVICE OF NETWORK LAYER... 66
FIG.A-2FLOWCHART OF NETWORK DISCOVERY SERVICE OF NETWORK LAYER... 67
FIG.A-3FLOWCHART OF NETWORK FORMATION IN NETWORK LAYER... 69
FIG.A-4 FLOWCHART OF NETWORK PERMITS JOINING SERVICE... 71
FIG.A-5FLOWCHART OF NETWORK JOINING SERVICE... 73
FIG.A-6MESSAGE FLOW CHART OF ESTABLISHING A NEW NETWORK... 75
FIG.A-7MESSAGE FLOW CHART FOR NETWORK DISCOVERY. ... 77
FIG.A-8FLOWCHART FOR NETWORK LEAVE... 79
FIG.A-10MESSAGE FLOW CHART FOR PARENT TO HANDLE A LEAVE REQUEST FROM ITS CHILD... 81
FIG.A-11MESSAGE FLOW CHART FOR A PARENT TO FORCE A CHILD FROM ITS NETWORK... 82
FIG.A-12MESSAGE FLOW CHART FOR A CHILD TO REMOVE ITSELF FROM A NETWORK... 83
FIG.B-1STATUS OF PAN COORDINATOR IS SHOWN IN HYPER-TERMINAL... 84
FIG.B-2FRAMES MEASUREMENT FOR PAN COORDINATOR USING CHIPCON SNIFFER... 85
FIG.B-3STATUS OF ROUTER IS SHOWN IN HYPER-TERMINAL... 86
FIG.B-4FRAMES MEASUREMENT FOR ROUTER USING CHIPCON SNIFFER... 87
FIG.B-5FRAMES MEASUREMENT FOR ROUTER USING CHIPCON SNIFFER... 87
FIG.B-6STATUS OF ROUTER IS SHOWN IN HYPER-TERMINAL... 88
FIG.B-7FRAMES MEASUREMENT FOR DEVICE USING CHIPCON SNIFFER... 89
FIG.B-8FRAMES MEASUREMENT FOR DEVICE USING CHIPCON SNIFFER... 90
FIG.C-1 GENERAL MAC FRAME FORMAT DIAGRAM... 91
FIG.C-2 FRAME CONTROL FIELD FORMAT DIAGRAM... 91
Chapter 1
Introduction
The wireless sensor network is comprised of many sensor devices, each of which communicates and operates with its neighbors by wireless transmission. Each sensor device includes a microcontroller unit, a memory unit and an RF chip. The sensor device is responsible for measuring physiological signals, processing the measured data, and then sending the measured data to a specific device wirelessly. Since the sensor device with the characteristic of low power consumption is used to perform long-term monitoring, we must survey the current wireless technology and select the best candidate for low power consumption. According to our requirements, we have chosen the ZigBee wireless transmission standard [1], which is a wireless personal area network that creates a wireless sensor network of tree topology using hierarchy routing with web-based management for usage convenience.
1.1. Motivation
As the population of elderly people has increased in recent decades, the number of persons aged 60 is projected to be almost two billion by 2050 [2]. Thus heath related issues are becoming more and more important for this population. To increase medical quality, home health-care is a useful solution to achieve long-term monitoring of chronic disease effectively. The wiring of patients to obtain physiological signals has many drawbacks, including high cost of developments and maintenance. However, such drawbacks are lessened using wireless instead of wired connections to allow patients to move freely while carrying only a few small nodes. Now, in this study we propose a wireless sensor network solution that can support mobility and flexibility of sensor nodes in a network, thus providing many advantages while replacing wired with wireless logic links. Since advancement in wireless communication, sensor technology and information technology in general provides opportunities to in the area of home health-care service, which is very promising application to improve the quality of life. The home-care service usually provides real-life long term monitoring of a patient’s health that is useful for the assessment of treatments at home. This study focuses on the design and implementation of a wireless sensor network that has a tree topology of three levels using hierarchical routing with
web-based management. The wireless sensor network has many advantages, including low power consumption and high addressing space. The wireless sensor network is capable of formatting a network automatically, accepting several sensor devices and collecting data from existing devices in the network. Many studies [3] [4] [5] of home health-care issues use Bluetooth as the wireless personal area network. However, Bluetooth has many drawbacks, including limited addressing capability, higher power consumption than ZigBee and longer waking time than ZigBee.
The wireless sensor network can be used for collecting the necessary physiological signals of a patient, which are used to determine existing health problems and help predict such problems in the future. Because wireless sensor networks have a very large number of sensor nodes, their management and querying is a very troublesome problem. This study proposes a solution to this, which is to implement web-base management. This has the advantages of flexibility, ease of development and convenience of access. To determine existing health problems and help predict such problems in the future, we must measure the physiological signal of a patient. This study first implements an electrocardiogram (ECG) senor, since the ECG provides signals to monitor the most vital biological processes of the patient. Secondly, we select a commercial SpO2 sensor that provides oximeter
information containing SpO2 and the heart rate.
1.2. Review of the Literature
Recently, in health-care related research Tura et al. [4] have focused on the implementation of a network for managing home-care activities. The device of this network can measure blood oxygen saturation, the heart rate, the respiration rate and the patient’s quantity of movement. Measured data are stored into a multimedia card and then transmitted to a PC through Bluetooth. At the PC end the measured data is finally transmitted to the server center through the internet. The device uses a 16-bit microcontroller of the Mitsubishi M16C/62 family. There are many reasons for choosing this micro-controller, including compact design, smaller board dimensions and lower power consumption. For sensors they use the OEM pulse oximeter board, which is the NONIN OEM П module, to measure plenty of physiological signals of blood oxygen saturation and heart rate. The respiration rate is
measured using the Respiratory Effort Monitoring System (RESP-EZ) from the EPM systems module. The patient’s quantity of movement is measured through a dual axis thermal accelerometer called MEMSIC MXD205.
In terms of the hardware design for the wireless sensor, some papers [6] [7] have focused on integrating the hardware and communication interface such that each sensor device can communicate with other sensor devices and enter various physiological values into a database.
For network topology some studies have focused on the constructing suitable network topology for physiological signal transmission. One study focused on the implementation of wireless sensors network using Bluetooth, which consists of sensor nodes, relay nodes and a control node. It allowed all nodes to communicate with each other with a Bluetooth module, sensor and relay nodes detecting certain events and reporting the events to the control node. Its network is a tree topology based on Piconet where each Piconet has one master and up to seven slaves.
Korhonen et al. [8] proposed methods to implement health monitoring in homes of the future home. These methods included models of remote monitoring, comparing wearable sensors with environmental sensors, system architecture that contained sensor devices, a personal gateway or home gateway that was a mobile device, such as mobile phone used to transfer data from a sensor device to a remote database through the internet. In this study the authors presented some useful models for health monitoring and discussed the technical requirements for the health monitoring system based on wearable and ambient sensors, which measured health related data in the daily environment of the patient. To make these methods more affordable, health-monitoring needed to support the use of the generic platforms such as Bluetooth or ZigBee. The gateway used generic hardware such as a mobile phone or Personal Digital Assistant (PDA) as a personal gateway or a Digital TV as a home gateway.
Since the wireless sensor network is comprised of a very large number of sensor nodes, their management and querying of the wireless sensor network was a troublesome problem. Web-based management was useful solution for management and querying of the wireless sensor network. Hwang et al. [9] implemented a wireless sensor gateway that was responsible for processing a user’s query from
a web page and transferring the user’s query into a sensor query. Finally the wireless sensor gateway sent the sensor query to the wireless sensor network that was generated by a sensor network emulator.
Tan et al. [3] focused on the design and implementation of a home health-care system using Bluetooth, web service and Global System for Mobile communication (GSM) short message service. In this study the authors implemented a mobile ECG unit that comprised a sensor, transmitter and receiver. The ECG physiological signal was passed to a remote database of the health web server unit based on the SOAP for diagnosis through the internet. This study used the web service to enhance the flexibility of architecture and convenience of usage, which improved medical quality and reduced medical costs.
A system called Telemedicine [10] has been developed to improve the quality of home-based care and medical treatment. The system supports 24-hour real-time monitoring in a patient’s home by reliable sensors, which are responsible for measuring the physiological signals of the patient and sending this data to the patient’s computer through wireless communication. The computer analyzes and stores the data.
For medical care, a project called CodeBlue [10] was developed by the division of engineering and applied science at Harvard University. The project explored the application of a wireless sensor network to a range of medical applications including pre-hospital, in-hospital emergency care, disaster response and stroke patient rehabilitation. The project integrated medical sensors with lower power wireless networks, which used wireless ad-hoc routing protocols for critical care, security, robustness and prioritization. The hardware architecture of the project focused on many aspects, including ultra-lower-power sensing, computation and communication. The project also implemented 3D location tracking using radio signal information and adaptive resource management, congestion control and bandwidth allocation in the wireless sensor network.
Another project [10] has been initiated to integrate body sensors with the internet. Sensors were attached to the body of a patient and connected with other sensor nodes through wireless transmission. The wireless body sensor network comprised several body sensor units and one body control unit. The body control unit was responsible for collecting data from all body sensor units and sending this data to
the internet. Body sensor units were responsible for measuring the necessary physiological signal of patients. This data could be used for disease diagnosis or disease prediction. The project was suitable for hospital applications, home care services, healthcare centers and sports medicine.
1.3. Objective
Home health-care is a useful solution to improve medical quality by using wireless technology to transmit physiological signals to a hospital. The hospital uses this data to do long-term monitoring. Doctors can use this data to make diagnoses or predict future diseases. To implement the home health-care system for multiple users, the wireless sensor network is need. The wireless sensor network is comprised of many sensor nodes, and has lower power consumption, high addressing capability and low transmission latency.
1.4. Thesis Organization
This study is organized as follows. Chapter 2 briefly introduces the rationale of ECG and SpO2
and describes implementation methods for ECG sensor and SpO2 sensors. Chapter 3 illustrates the
implementation methods of hardware and firmware for the wireless sensor network. Chapter 4 describes the design method of web-based management. In Chapter 5 we show experimental results of the whole system. These experimental results include the wireless sensor network and the web-based management system. Chapter 6 compares the wireless sensor network in this study with existing research, and describes related advanced applications. Chapter 7, the final chapter of this study, provides some conclusions and deals with another great challenge of this area of research. We also provide directions of future research for the extended applications.
Chapter 2
Sensors Design
To measure physiological signals of patients this study used two sensors: ECG and SpO2 sensors.
In this Chapter the ECG sensor and SpO2 sensor will be described. The basic principles and circuit
designs of the two sensors will also be illustrated.
2.1. Overview of the System Design
This study develops a wireless senor network system with web-based management, which is a tree topology of three levels with hierarchical routing. The wireless sensor network is comprised of a Personal Area Network (PAN) coordinator, routers and end devices. In the wireless personal area network, there are two types of wireless technology, Bluetooth and ZigBee. Compared to Bluetooth, ZigBee has lower power consumption, smaller size of protocol stacks and higher addressing capability. This study uses ZigBee wireless technology to develop the wireless sensor network.
The end device of the wireless sensor network includes the ECG sensor and the SpO2 sensor. A
micro-controller unit with a ZigBee RF chip selects one of the routers, which is the shortest distance between routers and the end device. When the device had joined a router, the device remains sleeping until it receives a start command from the router. To reduce power consumption, the router sends a start command to the associated devices every 15 seconds, alternately, according to its neighbor table. When the device has received a start command, it starts conversion of ADC and sends the results of the conversion to the router. When the router has received data from the associated device, it sends data to the associated PAN coordinator immediately. The PAN coordinator sends it to the UART that was connected with the UART of a personal computer (PC).
Since the wireless sensor network has many sensor devices, it is very difficult to manage and control. To solve this problem we use a remote database as the interface between the wireless sensor network and a web page. The system architecture is flexible. Users can monitor and control the wireless sensor network easily via the internet.
UART and then storing it to a remote database by an open database connectivity application interface (ODBC API).
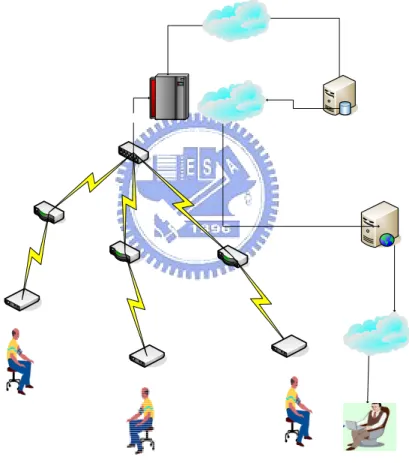
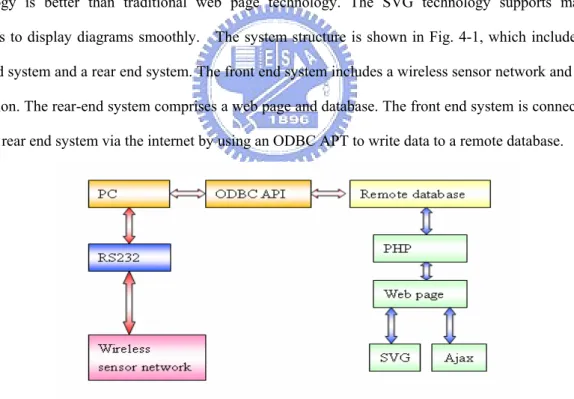
Finally, this study develops a web page, which is comprised of XML, PHP, java script and Scalable Vector Graphs (SVG) to show the physiological curve. Doctors can access and manage the wireless sensor network conveniently via the internet. The system structure is shown in Fig. 2-1, which includes 3 patients in a net. The user (professional medical personnel) can monitor the ECG or SpO2
signals via the internet.
Fig. 2-1 Structure of the whole wireless sensor network with web-based management
2.2. Sensors
The sensors are responsible for providing an interface between physical signals and the digital world. In the case of home-care, the sensor is used to measure physiological signals. This study uses two sensors: ECG and SpO2 sensors, which will be discussed below.
2.2.1. ECG Sensor
The measurement of the ECG involves the connection of between twelve and fifteen leads to a patient’s chest, arms and right leg via adhesive foam pads. It records a short sampling of the heart’s electrical activity between different pairs of electrodes. This study develops a sensor board that provided continuous ECG monitoring by measuring the differential across a single pair of electrodes.
2.2.1.1. ECG
The ECG measures the electrical activity of heart. The beating heart generates an electric signal that can be used as a diagnostic tool for examining the functions of the heart. This electric activity of the heart can be approximately represented as a vector quantity. Cardiologists have developed a simple model to represent the electric activity of the heart. In this model, the heart consists of an electric dipole located in the partially conducting medium of the thorax. This dipole moment, knew as the cardiac vector, is shown in Fig. 2-2
Fig. 2-2 Cardiac vector diagram [11]
The cardiac vector is defined as including 12 leads to form the exact ECG. However, in our case this is a portable device that cannot employ the whole 12 leads in our sensor, so we choose only lead II (shown in Fig. 2-3), which is considered to be a typical example of ECG monitoring. The lead II ECG waveform is also considered to provide typical clinical data for diagnosing heart disease. In fact, hospitals widely use the portable lead II ECG machine in the emergency ward.
Fig. 2-3 Lead II ECG diagram [11]
2.2.1.2. ECG Waveform
There are two premises in the ECG waveform. One is that the cardiac muscle is formed by excitable nerves that express electrical signals (voltage). The electrical signals are termed the ‘action potential’ of the cardiac nerve cells. The other premise is that the cardiac muscle (the atrium and the ventricle) cells systole and diastole together, which produces every beat of the heart. If they do not systole and diastole together, the heart beat is irregular -- so called cardiac fibrillation -- and the person die.
The explanation of the ECG waveform is that electric stimulation is activated by the SA node; the SA node expresses an action potential, as shown in the first curve of Fig. 2-4. Then the AV node receives the stimulation and expresses its action potential, which is shown on the third curve of Fig. 2-4. Then the signal (electric stimulation by the SA node) keeps conducting to the atrial muscle and then the ventricular muscle.
Cardiologists have determined that the P wave of the ECG waveform is mainly contributed by the atrial muscle, as shown on the second curve of Fig. 2-4. The QRS complex and the T wave are mainly contributed by the ventricular muscle, seen in the last curve of Fig. 2-4. Because the cardiac muscle is formed by excitable nerves, the electrical stimulus from the SA node is propagated to the other part of the heart. According to the difference between propagation time and action potential of every part of the heart, the ECG wave form is decomposed to the P wave, QRS complex, and T wave. Every component of the ECG waveform is shown in Fig. 2-4. Note that the action potential of bundle branches lags behind the action potential of the AV node by 100 ms., so it takes 100 ms. to pump blood from the ventricle to the atrium.
Fig. 2-4 Components of ECG waveform diagrams [11]
2.2.1.3. Measurement for ECG Signal
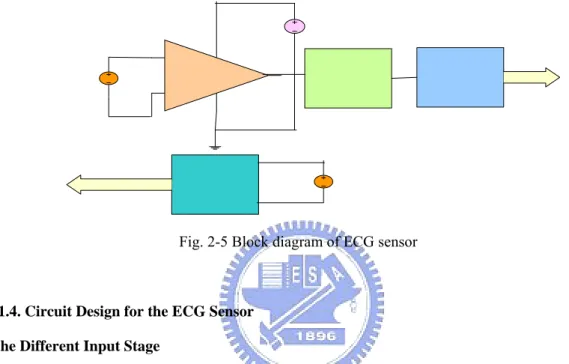
Because the ECG has very small signals, at the range of a few mV (usually less than 10) it is often interfered with by the 60 Hz noise created by the power line or the human body. In this case, we knew that signal conditioning is very important for bio-potential measuring. The best-fitting conditioning for the bio-potential signal can make it much simpler to do further signal processing. Therefore, it is necessary to employ an instrumentation amplifier to reduce the 60 Hz noise and to amplify the ECG signals we are interested in. Then, we filter the low frequency DC noise by a low pass filter and amplify the signal by a gain and filter stage. The fault often occurs that the output waveform is very sensitive to
motions like breathing and even slight movement of the human body, so it is necessary to add an anti-motion artifact stage to isolate the signal from motion artifacts. To create clearer signals with less 60 Hz noise interference on the baseline of the ECG waveform, we apply a DRL (Driven Right Leg) circuit to reduce the 60 Hz noise. The block diagram of the ECG sensor is shown in Fig. 2-5.
Fig. 2-5 Block diagram of ECG sensor
2.2.1.4. Circuit Design for the ECG Sensor a. The Different Input Stage
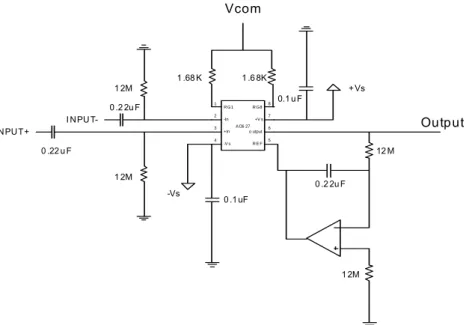
The differential input stage [12] is shown in Fig. 2-6. Here we choose a micro-power consumption instrumentation amplifier AD627 (Analog Device). Its max supply current is only 85 μA, and it has a wide power supply range from +2.2 V to ±18 V. It also provides gain for the signal.
The gain is adjusted by the resister RG, in the term:
5 200 − Ω = Gain K RG
R G1 1 -In 2 3 +In 4 -V s R G8 +V s o utput R E F 8 7 6 5 A D6 27 1 2M 1 2M 0 .2 2u F 0 .22 u F INPUT+ I NPUT--Vs +Vs 1 .6 8K 1 .68 K 0.1 uF 0 .1uF 0 .2 2uF 12 M 1 2M Vcom Output
Fig. 2-6 semantic diagram of the differential input stage for the ECG sensor We use 2 1 8 1= G = G R R with G =1.68
R KΩ, and the gain of the first stage is set to G1 =
64.5.
b. The Gain and Filter Stage
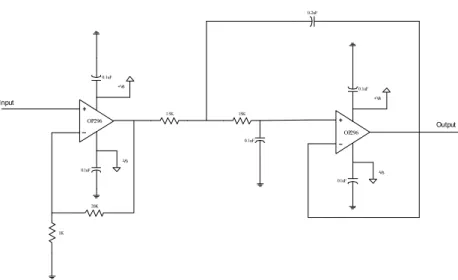
In the gain and filter stage, shown in Fig. 2-7, we choose OP296 for the operation amplifier. Its max supply current is only 85 μA and consists of 2 OP amplifiers in one chip. For the sake of minimizing the scale, ICs with SMD packages are used. In this stage, the first OP amplifier serves as a gain stage where G2 = 20, and the second OP serves as a low pass second-order Butterworth filter where
1K 0.1uF -Vs 0.1uF +Vs 20K Input 15K 15K OP296 0.1uF -Vs 0.1uF +Vs OP296 Output 0.1uF 0.2uF
Fig. 2-7 Semantic diagram of the gain and filter stage for the ECG sensor
c. The Anti-Motion Artifact Stage
As for the anti-motion artifact stage, a second-order band-pass filter [12] is used, as in Fig. 2-8, and
the resonance frequency Fr =
3 2 1 3 1 2 1 R R R R R C +
π = 10 Hz. The quality factor Q =πR2CFr =1.38. The
bandwidth BW =
Q
Fr = 7.24. And the gain at resonance frequency Ar = -3.33.
20nF OP296 2.7M 2.2M 20nF 2.2M 330K EKG output Input R1 R2 R3 R4 C C
Fig. 2-8 Semantic diagram of the anti motion artifact stag for the ECG sensor
d. Driven-Right-Leg (DRL) Circuit
value of 10 nF to block the 60 Hz noise, and an auxiliary OP amp to feed the noise back to the human body by the DRL electrode.
O P 29 6 0. 5Vs 10K 510K 10nF D R L elec trode Vc om
Fig. 2-9 Semantic diagram of the Driven-Right-Leg (DRL) circuit for the ECG sensor
2.2.2. SpO
2Sensor
A commercial SpO2 sensor is used in this study, which is an integrated pulse oximetry using
NONIN OEM . The Ⅲ SpO2 sensor sends physiological data to the UART at the rate of 9600 baud. This
study combines the SpO2 sensor with a development board, which is comprised by an MCU and ZigBee
chip. The development board receives the physiological data of the SpO2 sensor via UART, parses it to
get available data and sends this data to a router wirelessly. This study chooses data of type 2 format for the SpO2 sensor to write its parser, which was used to divide it into SpO2 value, heart rate value and
plethysmographic pulse. 2.2.2.1. Data Format of SpO2
The data of format type 2 provides oximeter information on SpO2, heart rate, pulse, sensor alarm,
sensor disconnection, out of track, bad pulse, software firmware revision level and plethysmohraphic pulse. There are 75 frames of data sent per second. A frame consists of 5 bytes of data; the 1st byte of the frame is used for byte synchronization; the 2nd byte of the frame is the status of the SpO
2 sensor; the
3rd byte of the frame is the plethysmographic pulse value; the 4th byte of the frame may be HR, SpO 2 or
software reversion. a. SpO2
The measurement of the SpO2 in the range of 0 to 100 is sent three times per second in the 4th byte
at frames 3, 28 and 53. b. Heart Rate
The detection of heart rates in the range of 18 to 300 is 2 bytes. The heart rate’s most significant byte is sent three times per second in the 4th byte at frames 1, 26 and 51. The heart rate’s least significant
byte is sent three times per second in the 4th byte at frames 2, 27 and 52.
c. Plethysmographic Pulse
The plethysmographic pulse is a representation of the IR signal; it has a range of 0 to 255 and is sent 75 times per second in the 3rd byte at all 75 frames.
2.2.2.2. SpO2 Parser
This study develops a simple SpO2 parser to get the heart rate, SpO2 and SpO2 diagram according to
a data format of type 2. The data format of type 2 is described below. The flowchart of the SpO2 parser
is shown in Fig. 2-10. a. Heart Rate
The parser gets the most significant byte of the heart rate by the 4th byte of the 1st frame, and the least significant byte of the heart rate by the 4th byte of the 2nd frame.
b. SpO2
The parser gets the SpO2 value by the 4th byte of the 3rd frame.
c. Plethysmographic Pulse Value
The parser gets the plethysmographic pulse value by the 3rd byte of the frame.
Chapter 3
Wireless Sensor Network
3.1. Introduction to Wireless Transmission Specifications
In this chapter ZigBee and Bluetooth will be described, and the comparison between the two will be analyzed. Finally, design methods will be illustrated including hardware structure, firmware structure, message flow chart and PC application.
3.1.1. Bluetooth
The Bluetooth is a wireless personal area network that focuses on short range ad-hoc connectivity. Its operating frequency is in the Industrial-Scientific-Medical (ISM) frequency band of 2.402 GHz to 2.483 GHz. It uses a Time Division Multiplexing (TDM) technique to divide a channel into 625 micro sec slots. With Bluetooth each packet is transmitted on a different hop frequency. The Bluetooth device can be divided into two types, master and slave; a master connects with at most seven slave devices. A unit network of Bluetooth is called Piconet, as shown in Fig. 3-1, which includes a master device and a slave device.
Fig. 3-1 Piconet diagram for Bluetooth
3.1.2. ZigBee
ZigBee is based on IEEE 802.15.4 wireless protocol, which focuses on sensor networks, control and home-care related applications. It has several advantages such as self-organization, lower power consumption, smaller size of protocol stacks and larger addressing space. The ZigBee can be classified into two types when accessing channels, unslotted networks and slotted networks. In unslotted networks, all devices are considered peers with respect to one another and the entire wireless resource is available.
Slotted networks comprise three time periods.The first period is the beacon frame; two beacon frames bound this structure. The second period is an active period that consists of a contention access period and a contention free period. All devices compete equally to get channel resources by using a Carrier Sensed Multiple Access with Collision Avoidance (CSMA/CA) mechanism during the contention access period. The channel resource can be allocated to specific devices during the contention free period. The third period is the inactive period. Channel access is not permitted during the inactive period. The IEEE 802.15.4 standard defines the lower two layers as Physical (PHY) and Medium Access Control (MAC) layers. ZigBee alliance builds on this foundation by providing a Network (NWK) Layer and Application (APP) layer.
3.1.2.1. Physical (PHY) Layer
The IEEE802.15.4 has three PHY layers that operate in three separate frequency ranges of 868-868.6 MHz, 902-928 MHz and 2.4-2.4835 GHz. There are 20 kb/s, 40 kb/s and 250 kb/s using the frequency bundles of 868-868.6 MHz, 902-928 MHz and 2.4-2.4835 GHz.
3.1.2.2. MAC Layer
The IEEE802.15.4 MAC layer is responsible for accessing the radio channel using two CSMA-CA mechanisms, transmitting a beacon frame, synchronization and providing a reliable transmission mechanism.
3.1.2.3. NWK Layer
The NWK Layer is responsible for implementing a mechanism that is used to join and leave a network. The NWK Layer also provided discovery and maintenance of routes between devices devolving to the NWK Layer.
3.1.3. Advantages of ZigBee
ZigBee has low power consumption and high addressing capability. ZigBee can receive 65536 devices to connect, significantly more than the seven devices of Bluetooth. ZigBee was developed to serve different applications than Bluetooth and its technology has led to optimizations in power consumption. According to the ZigBee Alliance, ZigBee has many advantages such as a very low duty
cycle, long primary battery life, static and dynamic star and mesh networks. A comparison between ZigBee with Bluetooth is shown in Table 3-1.
Operation Range
Data rate Waking time Battery Life System Resources Network Size Bluetooth 10 m 250 Kbps 3 m sec Several
weeks
250 KB+ 7
ZigBee 10-75 m 1 Mbps 3 sec 6 month to 2 years
4 KB- 32 KB
Unlimited 264 Table 3-1 Comparison between Bluetooth and ZigBee [1]
To compare ZigBee with Bluetooth in low power consumption accurately, this study compares Bluetooth [W7020, Lucent, USA] with ZigBee [UZ2400, UBEC, Taiwan] in terms of power consumption. The comparison is illustrated in Table 3-2, with which we can see that the power consumption of ZigBee is smaller than Bluetooth. Therefore, in this study we use ZigBee as the specification for wireless transmission.
Sleep Mode TX RX
Bluetooth 2.8 V/ 50 μA 2.8 V/ 33 mA 2.8 V/ 40 mA ZigBee 3.3 V/ 2 μA 3.3V / 22 mA 3.3V/ 18 mA
Table 3-2 Comparison between Bluetooth and ZigBee in Power consumption [15] [16]
This study uses the unslotted method to access channels in the 2450 MHz band. The 2450 MHz band provides the most channels (16 channels), highest data rate (250 kb/s), least overhead and least complexity, relative to the slotted method.
3.2. Hardware Design
The development board (DEB) used in this study is comprised of a micro-controller and a ZigBee chip (UZ2400, UBEC, Taiwan) to act as hardware platform for each device in the wireless sensor
network.
3.2.1. Micro-Controller Unit (MCU)
The MCU of the development board us the Texas Instruments MSP430F1611, which incorporates a 16-bit RISC CPU, peripherals, and a flexible clock system.
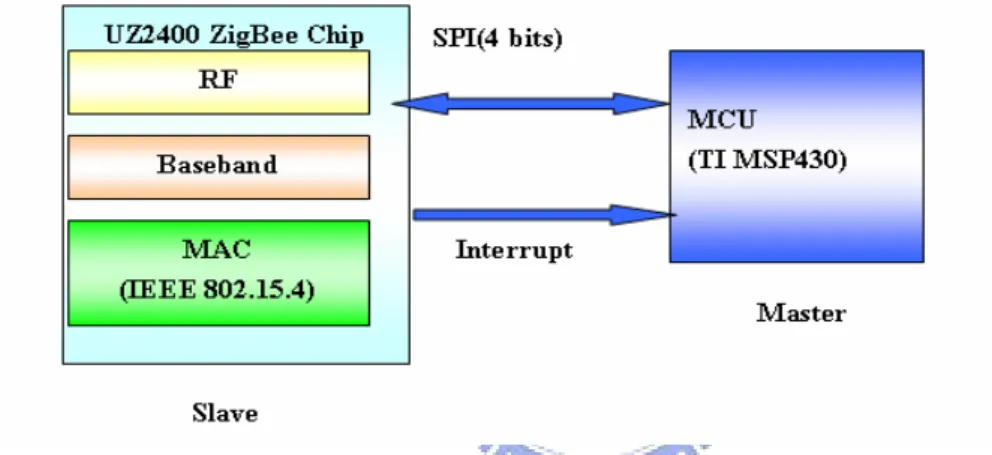
3.2.2. ZigBee Chip
The ZigBee chip (UZ2400, UBEC, Taiwan) integrates a wireless RF transceiver operating at 2.4 GHz, the 802.15.4 PHY layer baseband and the MAC layer architecture. The block diagram of the DEB is shown in Fig. 3-2.
Fig. 3-2 Block diagram of the development board
The MAC of the ZigBee chip is comprised of six components, which are RX MAC, TX MAC, security, control register, FIFO and SPI interface. The FIFO of the MAC consists of five components, which are TX FIFO, RX FIFO, TX GTS1 FIFO, TXGTS2 FIFO and TX Beacon FIFO. These FIFO are listed in Table 3-3, which contains the FIFO name and its length.
3.2.3. SPI Mode
The ZigBee chip communicates with the MCU by the SPI mode of the UART. This study uses 4-pin SPI including four serial signals, SPI enable, SPI clock, Master Input Slave Output (MISO) and Master Output Slave Input (MOSI). The MCU is the master and the ZigBee chip is the slave. If the MCU wants to read any register of the ZigBee chip, it should pull down SPI enable to zero voltage and send the register address with variable size according to the different types registered to the ZigBee chip. If the first bit of the address is 1, indicating that the register type the MCU wants to access is a long address register, it should send a 10-bit address of the register to the MCU. If the first bit of the address is 0, indicating that the register type the MCU wants to access is a short address register, it should send a 6-bit address of the register to the MCU. The last bit of the address is used to determine that the MCU wants to write or read the register. If the last bit of the address is 0, this indicates that the MCU wants to read the register. If the last bit of the address is 1, this indicates that the MCU wants to write the register. Furthermore, the ZigBee chip should send serial data to the MCU via a MISO pin if the register operation is read. If the register operation is writing, the MCU should send serial data to ZigBee via a MOSI pin.
3.3. Firmware and Software Design
The firmware of this study is a Real Time Operating System (RTOS) called CMX to interrupt the handle, provide a Timer and ZigBee protocol stack. First, the RTOS is described and the kernel functions used in the firmware are. Secondly, the ZigBee protocol stack, network layer design method based on the MAC layer, flowchart and message sequence chart are described. Finally, the design methods of the hardware and firmware are illustrated.
3.3.1. Introduction to RTOS
The firmware uses an RTOS called CMX, which is a real time multi-tasking operating system that supports many functions to develop real time multi-tasking applications. The heart of the operating system is the scheduler based on true preemption, which allows for tasks and interrupts to cause an immediate task switch. The firmware uses some tasks to handle the necessary jobs and a software timer
to do periodical jobs by calling the kernel functions of the RTOS. These task related functions and cyclic timer functions are described below.
3.3.1.1. Task Related Functions a. K_Task_Create Function
This function is used to create a task before entering the CMX RTOS. The ROM TCB task is a structural table used to describe the task ID, system stack of the task, the task’s code address and the task’s initial priority. The task is in the IDLE state when it is created.
b. K_Task_Start Function
This function is used to start a task; it puts the task into a ready state allowing it to become a running task when it is the highest priority task ready to run.
c. K_Task_Wait Function
This function is used to enable a task to suspend itself for a specific amount of time or indefinitely. The firmware uses this function to suspend an ISR task and wait for the ISR to occur. These steps are described below.
d. K_Task_Wake Function
This function is used to wake up a specific task that was put into the suspend state; it puts the task into a resume state. The firmware uses K_Task_Wait and K_Task_Wake functions in the interrupt process, this process is described as follows. The firmware selects two steps to handle the interrupt. The first step is called top halve and is responsible for doing critical tasks in order to increase sensitivity of the system. The second step is called bottom halve and is responsible for doing the remainder of the interrupt. To achieve this goal, the firmware uses a task called ISR task to handle the bottom halve; the ISR is responsible for handling the top halve. The ISR task remains in an idle state by using the K_Task_Wait kernel function of the RTOS until the ISR wakes it by using the K_TASK_WAKE kernel function of the RTOS.
e. K_OS_Start Function
control of the CPU and determines when tasks should run. f. K_OS_Intrap_Entry Function
This function is used to save the context of the CPU registers and swap in the interrupt stack when an interrupt occurs; the interrupt’s first instruction is this function.
g. K_OS_Intrap_Exit Function
This function is used to return the original sequence of the program when the interrupt has finished its code. This function is the last instruction of the interrupt’s code. The firmware implements three ISRs, including the timer ISR, external ISR and ADC ISR, by writing in assembly language. The first instruction of the ISR code is the K_OS_Intrap_Entry function, and its last instruction is the K_OS_Intrap_Exit function.
3.3.1.2. Timer Related Functions
The CMX RTOS supports a software cyclic timer to execute a specific routine at the specified number of system ticks. When the timer expires, the K_Event_Signal function is performed. These details are described below.
a. K_Timer_Create Function
This function is used to sets up a cyclic timer’s event function. b. K_Timer_Start Function
This function is used to initially start a cyclic timer that has been set up by the K_Timer_Create function.
c. K_Event_Wait Function
This function is used to wait for a specific event to occur; this function is arranged in pairs with the timer related function to do a specific routine.
3.3.2. ZigBee Protocol Stack
The ZigBee protocol stack is comprised of four layers, the Physical Layer (PHY), Medium Access Control Layer (MAC), Network Layer (NWK) and Application Layer (APP). The lower two layers of the ZigBee protocol stack are IEEE 802.15.4 standards. The ZigBee protocol stack is shown in Fig. 3-3.
Fig. 3-3 ZigBee protocol stack diagram
3.3.2.1. Description of the IEEE 802.15.4 WPAN
The IEEE 820.15.4 consists of two devices, the Full Function Device (FFD) and the Reduce Function Device (RFD). The FFD can operate in three modes serving as a PAN coordinator, a coordinator, or a device. The RFD is used for extremely simple applications, such as a passive sensor device that only sends sensing data to the associated router or PAN coordinator periodically.
3.3.2.2. Description Concept of Primitives
A layer of the ZigBee protocol stack might have several services; each layer of ZigBee offers services to the user in the layer immediately above by building its functions on the service of the layer immediately below.
Fig. 3-4 Flow diagram of primitive concept
Each services of a layer can be implemented by describing the service primitives and parameters. A service might consist of one or more related primitives. Each service primitive might have zero or more parameters that convey the information required to provide the service.
3.3.2.4. A primitive can be one of four generic types:
a. Request: The N+1 Layer requests a service from the N Layer.
b. Confirm: The N layer issues a confirm primitive to report the result of the request when the requested service has been completed.
c. Indication: The N+1 Layer indicates that n internal N Layer event has happened by issuing an indication primitive.
d. Response: The N+1 Layer issues a response primitive to notify the N Layer when N+1 Layer has received an indication from the N Layer.
3.3.3. Network Layer Design Based on a MAC Layer
The network layer is responsible for creating a network, processing network joining and leaving of devices, and routing frames to their destination by using a MAC layer service. This study implements primitives of a network layer according to ZigBee specifications. The network layer consists of two entities, a Network Layer Data Entity (NLDE) and a Network Layer Data Entity (NLME). The NLDE entity is responsible for network layer data services that include data request, data confirm and data
indication primitives. The NLME entity is responsible for network management services that include network discovery, network joining and leaving and routing algorithms. The NLME entity comprises several primitives to achieve network management services; these primitives are listed in Table 3-4.
Table 3-4 Summary of the primitive for the NLME entity
3.3.3.1. NLDE Entity
The NLDE entity consists of three primitives, the data request primitive, data confirm primitive and data indication primitive; these primitives are described in Appendix A.
3.3.3.2. NLME Entity
The NLME entity comprises many primitives, such as network discovery, network join /leave and other primitives concerning network management; these primitives are described in Appendix A
3.3.4. Implementation of the ZigBee Protocol Stack
This ZigBee protocol stack uses an Operating System (OS) called the CMX Tiny real time multi-tasking operating system, which provides a true preemptive operating system and a wide range of functions, and uses as little RAM as possible. We port the CMX Tiny real time multi-tasking operating system on the TI MSP430 platform, and the RTOS supports many kernel functions to handle interrupts, timer, task scheduling and resource management of the hardware. First of all, the firmware system initializes the Universal Asynchronous Receiver/Transmitter (UART), the serial peripheral interface
(SPI), the micro-controller unit (MCU) and the MAC, and then it creates three tasks, the timer task, ISR task and system task. Finally, these tasks are initiated.
This study implements the network layers of the ZigBee protocol stack based on the MAC layer. When the ZigBee chip receives a packet or sends a packet, its ISR is run. The ISR is responsible for saving the event status of RX or TX and then waking the ISR task to process receive events or transmission events. The firmware employs four tasks to handle four necessary jobs, including interrupt handles, transmission of bio-signals, maintenance of the system timer and device functionality. According to ZigBee specifications, the device type is divided into three types, the end device, router and PAN coordinator. The system task is responsible for implementing the functionalities of each device in PAN.
3.3.4.1. End Device with Sensor
This device is a passive type device that is responsible for sending physiological data to the associated router. This study uses two sensors, an ECG sensor and SpO2 sensor. The output data of the
ECG sensor is an analog value, so it should been sent into the ADC of the MCU for conversion. When the conversion of ADC is completed, the ADC12 ISR is run. The ADC12 ISR is used to obtain conversion results and send them to the associated router. Because the SpO2 sensor outputs sensing data
to the UART, we should connect the UART of the end device with the UART of the SpO2. When the
end device receives data from the UART and the process of parsing had been completed, it sends data to the associated device. The hardware structure is shown in Fig. 3-6.
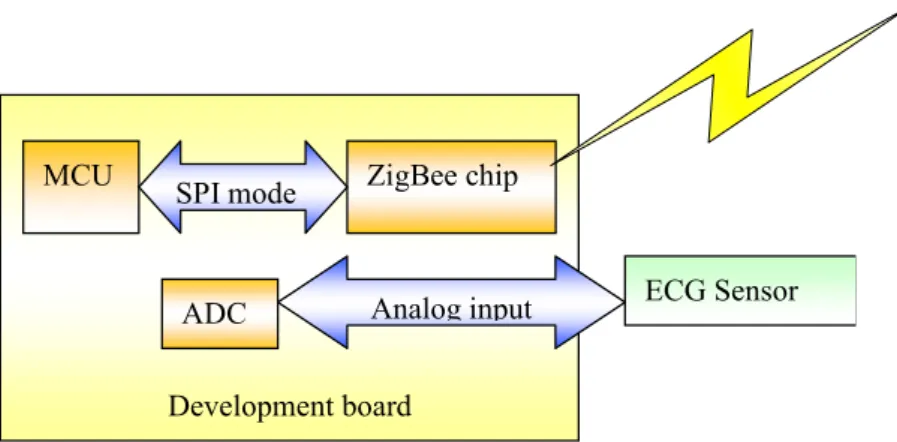
a. ECG Sensor Device a.1. Flowchart Description
The firmware of the end device with ECG sensor has four tasks, including the timer task, ISR task, system task and send task, which are responsible for doing necessary jobs according to their attributes. These are illustrated below. The flowchart is shown in Fig. 3-5.
Timer Task: The timer task is responsible for waiting for one system tick and storing the TTL (time to live) of packet to the TX buffer.
ISR Task: When the ISR task starts, it enters suspend status until the ISR wakes it. The ISR task is waked when the ISR occurs. The ISR task is used to process the received packet and parse the RX frame if the interrupt is an RX event. Or, it stores the status of packet transmission into the TX buffer if the interrupt is a TX event.
System Task: The responsibility of this device is to join a router according to the results of network discovery and start the send task.
Send Task: When this task has been started, it remains in sleep mode until it receives a start command. If it receives a start command, it is awakened from sleep mode to normal mode to start a timer and the ADC. When conversion of the ADC has been completed, it runs the ADC ISR that is responsible for getting conversion results and sending them to the associated router. When the timer expires, the send task stops sending data to the router and enters sleep mode again.
Development board
MCU SPI mode ZigBee chip
ECG Sensor ADC Analog input
Fig. 3-6 Hardware block diagram
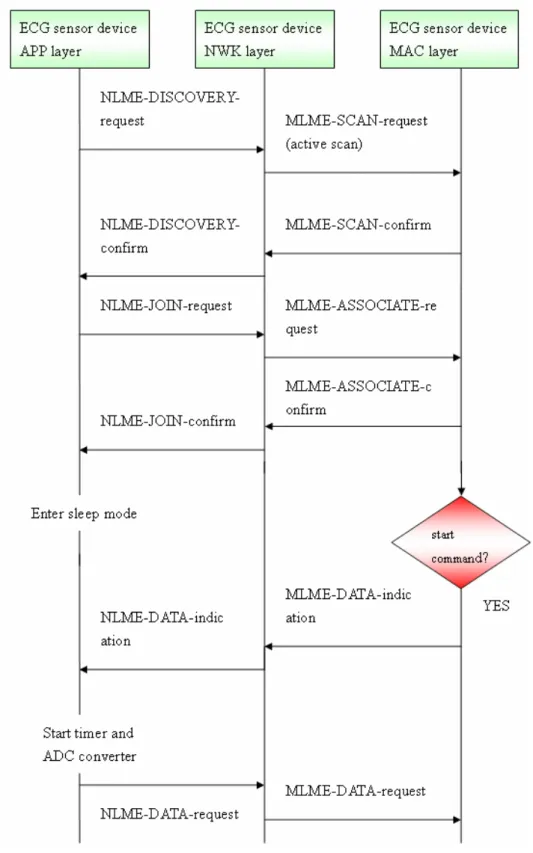
a.2. Message Flow of the ECG sensor device
When the end device with ECG sensor is powered on, it does network discovery by issuing the NLME-DISCOVERY-request primitive and joins a router of the network according to the discovery results returned from the NLME-DISCOVERY-confirm primitive by issuing the NLME-JOIN-request primitive. Furthermore, it remains sleeping until receiving a start command from the associated router. If the end device with ECG sensor receives a start command, it starts a timer and ADC converter that is used to convert the physiological analog signals of the ECG and sends the results of conversion to the associated router by issuing the NLME-DATA-request primitive. When the timer expires, the end device with ECG sensor stops converting and remains sleeping until receiving a start command from the associated router. The message flow chart of the ECG sensor device is shown in Fig. 3-7.
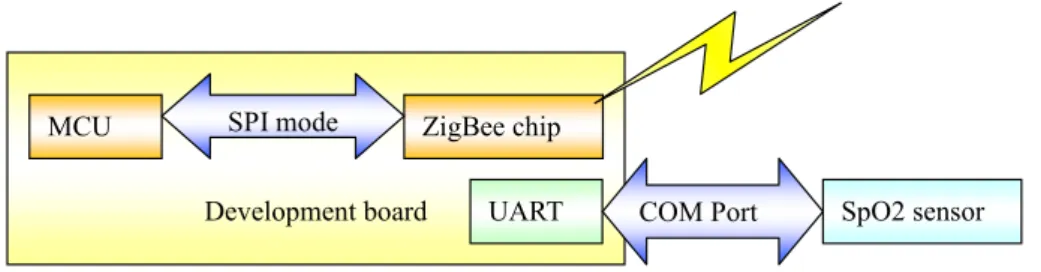
b. SpO2 Sensor Device
b.1. Flowchart Description
The firmware of the end device with SpO2 sensor is comprised of three tasks: the timer task, ISR
task and system task, which are responsible for doing the necessary jobs according to their attributes. This firmware implements a parser of data type 2 for the SpO2; the parser is used to extract the SpO2
value, heart rate value and plethysmographic pulse value from raw data. The flowchart of the SpO2
sensor device is shown in Fig. 3-8, and the hardware structure of the SpO2 sensor device is shown in Fig.
3-9.
Timer Task: The timer task is responsible for waiting for one system tick and storing the TTL of a packet to the TX buffer.
ISR Task: When the ISR task has been started, it enters suspend status until the ISR wakes it. The ISR task is awakened when the ISR occurs. The ISR task is used to process received packets and parse the RX frame if the interrupt is an RX event. Or, it stores the status of packet transmission into the TX buffer if the interrupt is a TX event.
System Task: This task first joins a router according the results of network discovery and remains sleeping until receiving a start command. If the device receives a start command, it starts a timer and polls the UART to determine whether it has received any data. If the UART has received data, the system task uses a parser for SpO2 data type 2 to extract a SpO2 value, heart rate value and
Development board
MCU SPI mode ZigBee chip
UART COM Port SpO2 sensor
Fig. 3-9 Hardware block diagram of the end device with SpO2 sensor
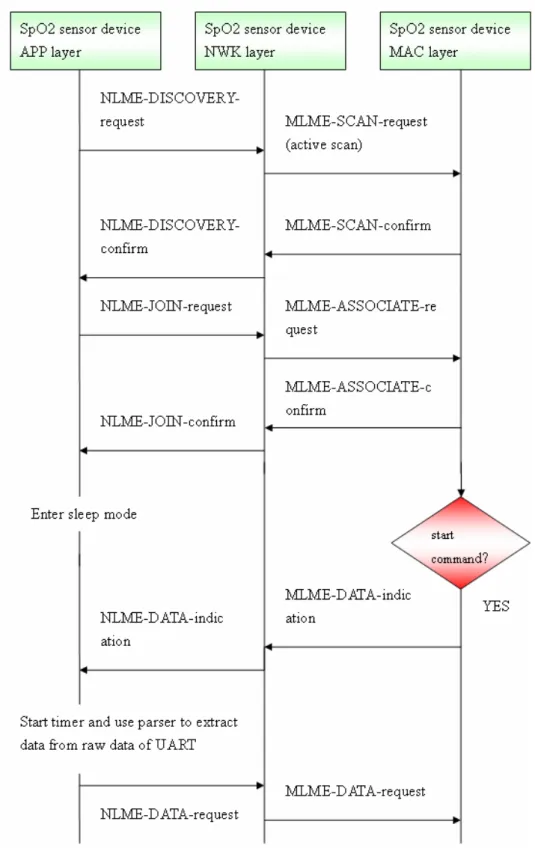
b.2. Message Flow of the SpO2
When the end device with SpO2 sensor is powered on, it first does network discovery by issuing the
NLME-DISCOVERY-request primitive and then joins the router of a network according to the discovery results returned from the NLME-DISCOVERY-confirm primitive by issuing the NLME-JOIN-request primitive. Afterwards it remains sleeping until receiving a start command from the associated router. When the end device with SpO2 sensor receives a start command, it starts a timer and
parser that are used to extract a SpO2 value, heart rate value and plethysmographic pulse value and send
them to the associated router until the timer expires by issuing the NLME-DATA-request primitive. When the timer has expired, the end device with SpO2 sensor stops sending and remains sleeping until
3.3.4.2. Router
The router is responsible for scheduling sending time for each associated device according its neighbor table and using hierarchical routing to forward data to specific devices. To reduce power consumption of sensor devices, this study inserts an idle time in the middle of the sending time of two devices. The idle time is adjusted by the scheduler according to number of associated end device and end device‘s attributes that contain type of signal and signal frequency. The time slice diagram of sending times for each device is shown in Fig. 3-11.
Fig. 3-11 Time slice diagram of sending times for each device
a. Flowchart Description
The firmware of the router performs four tasks: the timer task, ISR task, system task and switch task, which are responsible for doing the necessary jobs according to their attributes. The flowchart of the router is shown in Fig. 3-12.
Timer Task: The timer task is responsible for waiting for one system tick and storing the TTL (Time to Live) of a packet to the TX buffer.
ISR Task: When the ISR task has started, it enters into suspend status until the ISR wakes it. The ISR task is waked when the ISR occurs. The ISR task is used to process received packets and parse the RX frame if the interrupt is an RX event. Or, it shows the processing status of packet transmission if the interrupt is a TX event. If the received packet is a data frame, the router sends data to the associated PAN Coordinator wirelessly.
System Task: The responsibility of router is to schedule sending times of each associated device and wait for other devices to join. The router first does network discovery by requesting the NLME-network-discovery-request of the network layer services. The NLME-network-discovery-request
issues the NLME-scan-request primitive of the MAC layer services to do active scanning, which broadcasts beacon request commands to existing devices of the POS. Finally, the router chooses a PAN Coordinator to join according to the number of associated routers and the distance between the PAN Coordinator and the router.
Switch Task: The switch task is responsible for scheduling sending time for each associated device according its neighbor table and adjusting its idle time according to the signal type and attributes of the associated end device.
Fig. 3-12 Flowchart of the router
3.3.4.3. PAN Coordinator
to manage the WPAN, gather data from associated routers and wait for other unassociated routers to join.
a. Flowchart Description
The firmware of the PAN Coordinator is comprised of three tasks: the timer task, ISR task, and system task, which are responsible for doing the necessary jobs according to their attributes. These are illustrated as follows. The flowchart of the PAN coordinator is shown in Fig. 3-13.
Timer Task: The timer task is responsible for waiting for one system tick and storing the TTL (Time to Live) of a packet to the TX buffer.
ISR Task:When the ISR task has been started, it enters into suspend status until the ISR wakes it. The ISR task is awakened when the ISR occurs. The ISR task is used to process received packets and parse the RX frame if the interrupt is an RX event. Or, it shows the processing status of packet transmission if the interrupt is a TX event.
System Task: The responsibility of the PAN Coordinator is to form the network and wait for the router to join. The PAN Coordinator first does network formation by requesting the NLME-network-formation-request of network layer services. The NLME -network- formation-request issues the NLME-scan-request primitive of MAC layer services to do energy detection and select a channel that has the maximum energy in all channels as the current channel of packet transmission. The PAN ID of the network is determined by a random number or input parameters of the NLME -network-formation-request, and then does active scanning by issuing the MLME -scan-request primitive of MAC layer services. Finally, it configures a new super-frame by issuing the MLME-start-request primitive of MAC layer services. When the PAN Coordinator has received a beacon request, it first delays a random tick time and then broadcasts a beacon frame to existing devices of the POS. Due to different arrival times of the beacon frame, the router can get all information of the existing PAN Coordinators in the POS.