Changes in Serum Levels of HBV DNA and Alanine Aminotransferase
Determine Risk for Hepatocellular Carcinoma
CHUEN–FEI CHEN,*,‡
WEN–CHUNG LEE,* HWAI–I YANG,§,储
HUNG–CHUEN CHANG,¶
CHIN–LAN JEN,§ UCHENNA H. ILOEJE,#
JUN SU,#
CHUHSING K. HSIAO,* LI–YU WANG,** SAN–LIN YOU,§
SHENG–NAN LU,‡‡ and CHIEN–JEN CHEN,*,§
for the Risk Evaluation of Viral Load Elevation and Associated Liver Disease/Cancer in HBV (REVEAL–HBV) Study Group
*Graduate Institute of Epidemiology and Preventive Medicine, College of Public Health, National Taiwan University, Taipei, Taiwan;‡Department of Health-Business
Administration, Hungkuang University, Taichung, Taiwan;§
Genomics Research Center, Academia Sinica, Taipei, Taiwan;储Molecular and Genomic Epidemiology Research Center, China Medical University Hospital, Taichung, Taiwan;¶Division of Gastroenterology, Department of Internal Medicine, Shin Kong Wu Ho-Su
Memorial Hospital, Taipei, Taiwan;#
Research and Development, Bristol-Myers Squibb Company, Wallingford, Connecticut; **Department of Medicine, Mackay Medical College, New Taipei City, Taiwan; and‡‡Division of Gastroenterology, Department of Internal Medicine, Kaohsiung Chang-Gung Memorial Hospital,
Kaohsiung, Taiwan
BACKGROUND & AIMS: It is not clear whether risk for hepatocellular carcinoma can be accurately determined from long-term changes in serum levels of hepatitis B virus (HBV) DNA or alanine aminotransferase (ALT). METHODS: We measured serum levels of HBV DNA and ALT at enrollment and during follow-up analysis of 3160 participants in the REVEAL-HBV study. Development of hepatocellular carci-noma was determined from follow-up examinations and computerized linkage with National Cancer Registry and National Death Certification profiles. Multivariate-adjusted hazard ratios (HRs) and 95% confidence intervals (CIs) were estimated using Cox regression models. RESULTS: During 38,330 person-years of follow-up, 81 participants developed hepatocellular carcinoma (incidence rate, 211.3/100,000 per-son-years). The risk for hepatocellular carcinoma was only slightly higher for participants whose follow-up levels of HBV DNA spontaneously decreased to⬍10,000 copies/mL compared with those with baseline levels of HBV DNA ⬍10,000 copies/mL (control group; HR, 2.25; 95% CI, 0.68– 7.37). Compared with the control group, the HRs (95% CI) for long-term levels of HBV DNA that persisted at 10,000 to 100,000 copies/mL, decreased to/persisted at 100,000 to 1,000,000 copies/mL, or decreased to/persisted at 1,000,000 to 10,000,000 copies/mL were 3.12 (1.09 – 8.89), 8.85 (3.85– 20.35), and 16.78 (7.33–38.39), respectively. A gradient in ALT level was significantly associated with hepatocellular carcinoma risk: from all low-normal, to ever high-normal, to transient abnormal, to persistent abnormal (Ptrend ⬍ .001).
CONCLUSIONS: Long-term changes in serum levels of HBV DNA and ALT are independent predictors of risk for hepatocellular carcinoma. Regular monitoring of lev-els of HBV DNA and ALT is important in clinical man-agement of chronic carriers of HBV.
Keywords: Liver Disease; Long-term Follow-up Study;
Chronic Hepatitis B.
C
hronic hepatitis B virus (HBV) infection poses a global health challenge, affecting more than 350 million people worldwide1; the vast majority of thoseaffected are from the Asia-Pacific region2 and are mostly
infected perinatally or during early childhood.3Globally,
more than 50 million new cases of HBV infection occur annually.4 Patients with chronic hepatitis B are at
in-creased risk for developing cirrhosis and hepatocellular carcinoma,5resulting in more than half a million deaths
annually.
The progression of chronic hepatitis B is a multistage, multifactorial process involving interactions among host, environmental, and viral factors.6,7 Important HBV
bio-markers for prediction of hepatocellular carcinoma risk include hepatitis B e antigen (HBeAg) serostatus,8
geno-type C,9 –11specific mutants,10,12,13and elevated HBV DNA
level.14 –16Cross-sectional, case-control, and cohort studies
have shown a significant dose-response association be-tween serum HBV DNA levels at initial evaluation and subsequent risk of hepatocellular carcinoma.16 Serum
HBV DNA levels may vary markedly in the natural pro-gression of chronic hepatitis B; however, most studies were only based on a single HBV DNA measurement at enrollment rather than multiple measurements during long-term follow-up.
Chronic inflammation associated with human immune responses to HBV infection may increase damage and proliferation of hepatocytes. Consequently, persistent in-jury and regeneration may promote liver carcinogene-sis.17,18Serum alanine aminotransferase (ALT) level is the
most commonly used seromarker of HBV-related liver cell injury.19 Higher ALT levels imply more active immune
response against HBV and more extensive hepatocyte damage.20 Prospective studies have shown that elevated
serum ALT level at enrollment was a risk predictor for HBV-related hepatocellular carcinoma.10,14Because serum
ALT levels may vary during the progression of chronic hepatitis B,19 the risk for hepatocellular carcinoma
pre-dicted by long-term patterns of ALT levels remains to be elucidated.
Abbreviations used in this paper: ALT, alanine aminotransferase; HBeAg, hepatitis B e antigen; HBV, hepatitis B virus.
©2011 by the AGA Institute 0016-5085/$36.00 doi:10.1053/j.gastro.2011.06.036
CLINICAL
This study aimed to identify distinctive groups of long-term changes in serum HBV DNA levels during follow-up and examine risk for hepatocellular carcinoma associated with the patterns of long-term changes in HBV DNA and ALT levels.
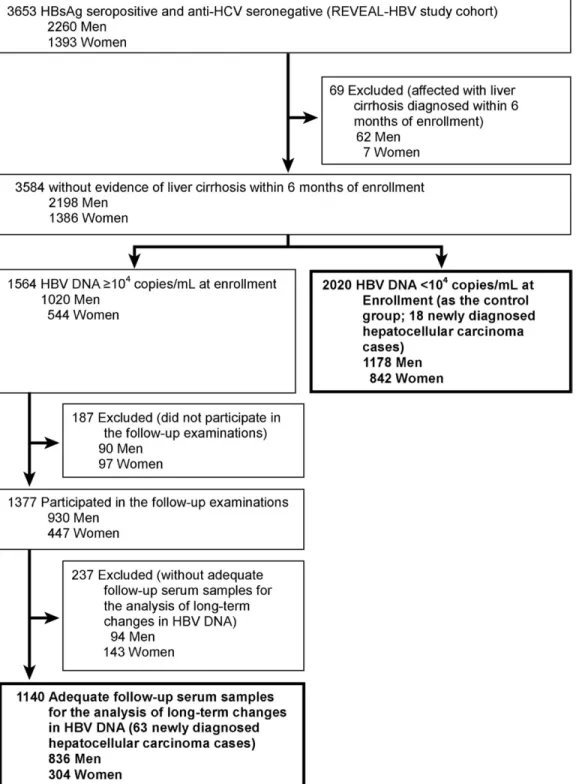
Subjects and Methods Study Cohort Enrollment
The participants in this study included a subcohort of the Risk Evaluation of Viral Load Elevation and Associated Liver
Disease/Cancer in HBV (REVEAL-HBV) Study described previ-ously.14Of the 3653 participants included in the study cohort,
3584 had no cirrhosis within 6 months of enrollment. Of these, 2020 had serum HBV DNA levels⬍104copies/mL at enrollment
(control group). The remaining 1564 participants had serum HBV DNA levelsⱖ104copies/mL at enrollment, and 187 (12%)
of them did not participate in the follow-up examinations. Among 1377 participants with follow-up examinations, 237 (17%) did not have adequate follow-up serum samples for the analysis of long-term changes in HBV DNA levels. The remain-ing 1140 had at least 2 long-term repeated HBV DNA data 2 or
Figure 1. Flow of study participants.
CLINICAL
more years apart. These 1140 participants and the 2020 partic-ipants in the control group (total, 3160;Figure 1) were included in this study. The average number of repeated HBV DNA mea-surements per participant available for the group-based trajec-tory analysis was 4.8 ⫾ 2.1 (mean ⫾ SD). This study was conducted between February 1991 and June 2004 and was ap-proved by the institutional review board of the College of Public Health, National Taiwan University.
Interview and Blood Collection
All participants were personally interviewed by trained public health nurses using a structured questionnaire. Informa-tion on sociodemographic characteristics, dietary intake, habits of cigarette smoking and alcohol consumption, personal medi-cal and surgimedi-cal history, and family history of cancers and other major diseases was collected. A 10-mL blood sample was col-lected from each participant at enrollment and follow-up exam-inations (every 6 –12 months). The fractionated serum samples were stored at⫺70°C until tested.
Laboratory Examinations
Serologic testing was performed using commercial kits: hepatitis B surface antigen, HBeAg, and␣-fetoprotein by radio-immunoassay (Abbott Laboratories, North Chicago, IL), anti-bodies against hepatitis C virus by enzyme immunoassay using second-generation test kits (Abbott Laboratories), ALT by serum chemistry autoanalyzer (model 736; Hitachi Co, Tokyo, Japan) using commercial reagents (Biomérieux, Mercy-L’Etoile, France), and serum HBV DNA levels by polymerase chain reaction using the Cobas Amplicor HBV Monitor Test Kit14,21and Cobas
Taq-Man HBV Monitor Test Kit (Roche Diagnostics, Indianapolis, IN). We defined the undetectable lower limit as HBV DNA level ⬍300 copies/mL. According to the manufacturer’s instructions, there was an excellent correlation between HBV DNA levels detected by the TaqMan test and the Amplicor test (R2⫽ 0.977).
A real-time polymerase chain reaction– based single-tube assay with fluorescent hybridization probes and LightCycler technol-ogy (Roche Diagnostics Applied Science, Mannheim, Germany) was used to determine the genotype of HBV as described by Yeh et al.22Of 3160 hepatitis B surface antigen–positive participants,
2297 participants (72.7%) had a detectable viral load and an adequate serum sample for genotyping.
Ascertainment of Newly Developed Hepatocellular Carcinoma
No study participant had hepatocellular carcinoma at enrollment. Newly developed hepatocellular carcinoma was de-termined by follow-up health examinations or computerized linkage with National Cancer Registry and National Death Cer-tification profiles in Taiwan from January 1, 1991, to June 30, 2004. Overall, 81 incident hepatocellular carcinoma cases were ascertained by the following criteria: histopathologic examina-tion, positive lesion detected by at least 2 imaging techniques (abdominal ultrasonography, angiography, or computed tomog-raphy), or an imaging technique with a serum␣-fetoprotein level ofⱖ400 ng/mL.8,10,14
Statistical Analysis
The group-based trajectory model23was used to identify
distinctive groups of long-term changes in serum HBV DNA levels over 11 years of follow-up. Repeated measurements of HBV DNA were log10transformed and modeled by a censored
normal distribution. The group-based trajectory analysis (see
Supplementary Materials and Methods) was performed using the PROC TRAJ macro (SAS software version 9.1; SAS Institute Inc, Cary, NC).24Model selection was based on the log Bayes
factor24as a measure of the extent of evidence for improvement
in model fit, thereby ensuring model parsimony. Participants were classified into different groups of long-term HBV DNA change based on the highest posterior probabilities of belonging to each group.23
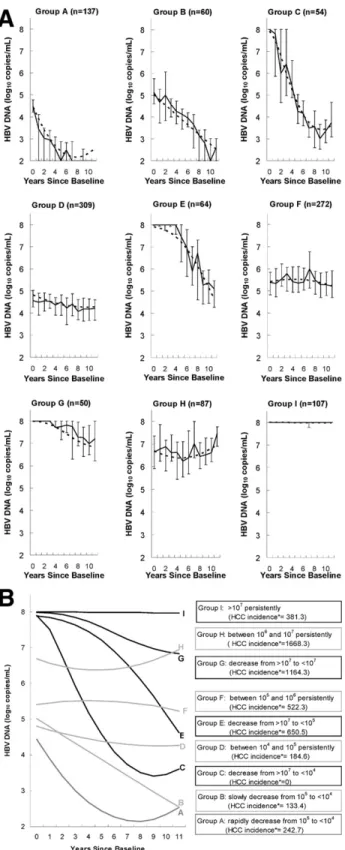
The group-based trajectory model identified 9 groups of long-term changes in HBV DNA levels for participants with HBV DNA levelsⱖ104copies/mL at enrollment. As shown inFigure
2A, the predicted long-term changes in HBV DNA levels fit the observed viral loads of the 9 groups very well. There were 137 participants (12.0%) in group A whose viral loads spontaneously decreased from 105copies/mL to undetectable levels from
base-line to the fifth year of follow-up, thereafter fluctuating between undetectable levels and⬍103copies/mL after the fifth year of
follow-up; 60 (5.3%) in group B whose viral loads spontaneously decreased from 105copies/mL to undetectable levels from
base-line to the tenth year of follow-up and then rebounded to low detectable levels (⬍103copies/mL); 54 (4.7%) in group C whose
viral loads spontaneously decreased from ⬎107 to ⬍104
cop-ies/mL from baseline to the seventh year of follow-up, thereafter fluctuating between 103 and 104 copies/mL; 309 (27.1%) in
group D with persistent viral loads of 104to 105copies/mL; 64
(5.6%) in group E whose viral loads spontaneously decreased from ⬎107 to ⬍105 copies/mL; 272 (23.9%) in group F with
persistent viral loads of 105to 106copies/mL; 50 (4.4%) in group
G whose viral loads spontaneously decreased from⬎107to⬍107
copies/mL; 87 (7.6%) in group H with persistent viral loads of 106to 107copies/mL; and 107 (9.4%) in group I with persistent
viral loads⬎107copies/mL.
Of these 9 groups, those with similar incidence rates of hepatocellular carcinoma (seeFigure 2B) were combined into a new group for further analyses. Thus, 5 long-term HBV DNA change groups were obtained. The new group designated as “decrease to⬍104copies/mL” was a combination of the A, B,
and C groups; the group of “persistence at 104to 105copies/mL”
was the D group; the group of “decrease to/persistence at 105to
106copies/mL” was a combination of the E and F groups; the
group of “decrease to/persistence at 106to 107copies/mL” was a
combination of the G and H groups; and the group of “persis-tence at ⬎107copies/mL” was the I group. The new group of
long-term HBV DNA change was treated as a categorical variable for subsequent analyses.
The person-years of follow-up for each participant were cal-culated from the date of recruitment to the date of the diagnosis of hepatocellular carcinoma, date at death, or last date of avail-able data from the National Cancer Registry (June 30, 2004), whichever came first. Participants free of hepatocellular carci-noma at their death or at the end of follow-up were censored. Incidence rates of hepatocellular carcinoma were calculated by dividing the number of incident cases of hepatocellular carci-noma by person-years of follow-up. Cumulative incidence of hepatocellular carcinoma by follow-up years was derived using the Nelson–Aalen method. A Cox regression model was used to calculate adjusted hazard ratios with 95% confidence intervals of developing hepatocellular carcinoma for groups of long-term HBV DNA change and long-term patterns of ALT and HBV genotype after adjustment for other risk predictors. Four cate-gories of the long-term patterns of serum ALT levels were de-fined as follows: “persistent abnormal ALT” for ALT levelⱖ45 U/L inⱖ50% of sequential ALT measurements, “transient
ab-CLINICAL
normal ALT” for at least 1 ALT level ⱖ45 U/L but ⬍50% of sequential ALT measurements ⱖ45 U/L, “ever high-normal ALT” for all sequential ALT measurements⬍45 U/L and at least 1 ALT level⬎30 U/L, and “all low-normal ALT” for sequential ALT measurementsⱕ30 U/L. P ⬍ .05 was considered statisti-cally significant. SAS software version 9.1 was used for all sta-tistical analyses.
Results
Follow-up Years and Overall Incidence of Hepatocellular Carcinoma
In our study, 81 participants newly developed hep-atocellular carcinoma during 38,330 person-years of fol-low-up (incidence rate, 211.3/100,000 person-years). Among 2020 participants with baseline HBV DNA levels ⬍104copies/mL, the mean age was 46⫾ 10 (SD) years,
the proportion of male subjects was 58%, and 18 new cases of hepatocellular carcinoma were diagnosed (inci-dence rate, 73.4/100,000 person-years). Among 1140 par-ticipants with baseline HBV DNA levelsⱖ104copies/mL,
the mean age was 45 ⫾ 9 (SD) years, the proportion of male subjects was 73%, and 63 new cases of hepatocellular carcinoma were diagnosed (incidence rate, 456.1/100,000 person-years).
Basic Characteristics of 6 Long-term HBV DNA Change Groups
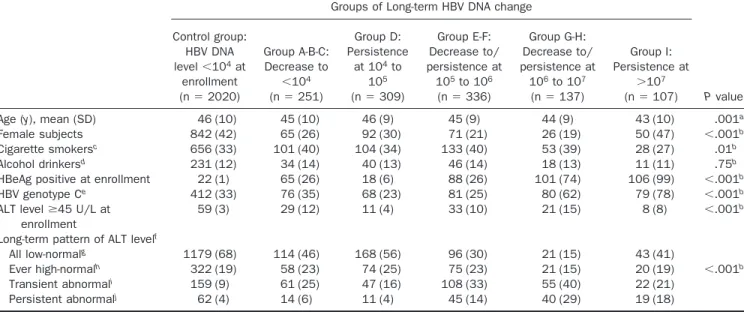
The characteristics of different groups of long-term HBV DNA change are shown inTable 1. Age, sex, habits of cigarette smoking and alcohol consumption, HBeAg seropositivity at enrollment, HBV genotype, ele-vated serum ALT level at enrollment, and long-term pat-tern of ALT were significantly associated with groups of long-term HBV DNA change.
Participants in group I with persistent viral loads⬎107
copies/mL are unique for several reasons: they were more likely to be younger, had a much higher proportion of female subjects (47%), were almost exclusively HBeAg se-ropositive (99%), and were mostly genotype C infected (78%). Furthermore, 60% of the participants with persis-tent viral loads ⬎107 copies/mL had sequential serum
ALT levels⬍45 U/L.
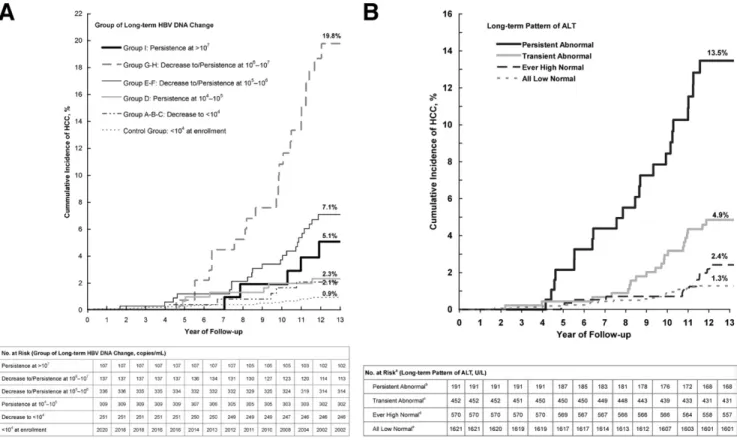
Cumulative Incidence of Hepatocellular Carcinoma by Long-term HBV DNA and ALT Changes
Figure 3shows the cumulative incidence of hepa-tocellular carcinoma by long-term patterns of HBV DNA and ALT. The cumulative incidence of hepatocellular car-cinoma at the end of the 13th year of follow-up was 0.9% for participants with HBV DNA levels⬍104copies/mL at
enrollment (control group), 2.1% for participants in group A-B-C whose long-term HBV DNA levels decreased to ⬍104 copies/mL, 2.3% for participants in whom these
levels persisted at 104 to 105 copies/mL (group D), 5.1%
for participants in whom these levels decreased to/per-sisted at 105 to 106 copies/mL (group E-F), 19.8% for
participants in whom these levels decreased to/persisted
Figure 2. Nine groups of long-term changes in serum HBV DNA levels
over the 11-year follow-up. (A) The solid line represents actual median levels of long-term HBV DNA change over the 11-year follow-up (the lower limit was the 25th percentile of HBV DNA levels and the upper limit was the 75th percentile of HBV DNA levels), and the dashed line repre-sents predicted levels of long-term HBV DNA change over the 11-year follow-up. All predicted levels of long-term HBV DNA change were gen-erated using the group-based trajectory model; n indicates total number of participants. (B) The plots were generated using the group-based trajectory model. HCC, hepatocellular carcinoma.ⴱThe HCC incidence rate was calculated by the following formula: [(Number of Incident Hep-atocellular Carcinoma Cases)/(Person-Year of Follow-up)]⫻ 100,000.
CLINICAL
at 106to 107 copies/mL (group G-H), and 7.1% for
par-ticipants in whom these levels persisted at ⬎107
cop-ies/mL (group I).
An increasing trend was found in the cumulative inci-dence of hepatocellular carcinoma with increasing abnor-mality of long-term serum ALT levels. The cumulative incidences of hepatocellular carcinoma at the end of the 13th year of follow-up were 1.3%, 2.4%, 4.9%, and 13.5% for those with all low-normal ALT, ever high-normal ALT, transient abnormal ALT, and persistent abnormal ALT levels, respectively.
Incidence Rates of Hepatocellular Carcinoma by Long-term HBV DNA and ALT Changes Table 2shows the incidence rates of hepatocellular carcinoma for groups of long-term HBV DNA change, long-term pattern of ALT, and HBV genotype. The inci-dence rates per 100,000 person-years were 73.4 for par-ticipants with HBV DNA levels ⬍104 copies/mL at
enrollment (control group), 163.0 for participants whose long-term HBV DNA levels decreased to⬍104copies/mL
(group A-B-C), 184.6 for participants in whom these levels persisted at 104 to 105 copies/mL (group D), 546.8 for
participants in whom these levels decreased to/persisted at 105 to 106 copies/mL (group E-F), 1481.3 for
partici-pants in whom these levels decreased to/persisted at 106
to 107copies/mL (group G-H), and 381.3 for participants
in whom these levels persisted at⬎107copies/mL (group
I). The hepatocellular carcinoma incidence rates per 100,000 person-years increased from 101.0 for partici-pants with all low-normal ALT levels to 1033.1 for those with persistent abnormal ALT levels in a dose-response relationship. Participants infected with genotype C had a higher hepatocellular carcinoma incidence rate than those infected with B or mixed genotype (415.3 vs 175.0 per 100,000 person-years).
Multivariate-Adjusted Hazard Ratios of Hepatocellular Carcinoma for Long-term HBV DNA and ALT Changes
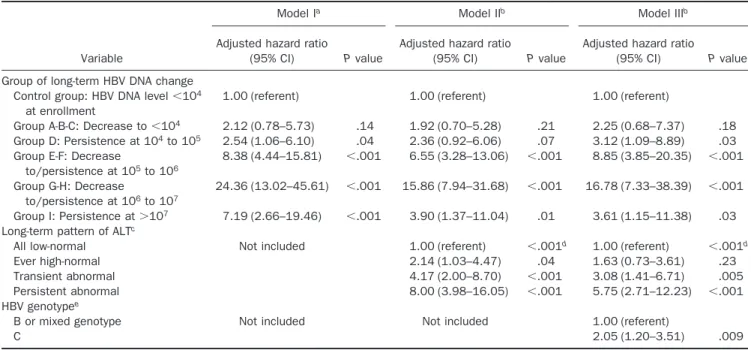
Table 3shows multivariate-adjusted hazard ratios of developing hepatocellular carcinoma for groups of long-term HBV DNA change, long-term ALT pattern, and HBV genotype. Compared with participants with HBV DNA levels⬍104copies/mL at enrollment, the
multivar-iate-adjusted hazard ratios (95% confidence interval) were 2.25 (0.68 –7.37), 3.12 (1.09 – 8.89), 8.85 (3.85–20.35), 16.78 (7.33–38.39), and 3.61 (1.15–11.38) for participants with long-term HBV DNA levels decreased to⬍104
cop-ies/mL (group A-B-C), persisted at 104to 105 copies/mL
(group D), decreased to/persisted at 105to 106copies/mL
(group E-F), decreased to/persisted at 106 to 107
cop-ies/mL (group G-H), and persisted at ⬎107 copies/mL
(group I), respectively, after adjustment for age, sex, habits of Table 1. Characteristics of Different Groups of Long-term HBV DNA Change
Groups of Long-term HBV DNA change
P value Control group: HBV DNA level⬍104at enrollment (n⫽ 2020) Group A-B-C: Decrease to ⬍104 (n⫽ 251) Group D: Persistence at 104to 105 (n⫽ 309) Group E-F: Decrease to/ persistence at 105to 106 (n⫽ 336) Group G-H: Decrease to/ persistence at 106to 107 (n⫽ 137) Group I: Persistence at ⬎107 (n⫽ 107)
Age (y), mean (SD) 46 (10) 45 (10) 46 (9) 45 (9) 44 (9) 43 (10) .001a
Female subjects 842 (42) 65 (26) 92 (30) 71 (21) 26 (19) 50 (47) ⬍.001b
Cigarette smokersc 656 (33) 101 (40) 104 (34) 133 (40) 53 (39) 28 (27) .01b
Alcohol drinkersd 231 (12) 34 (14) 40 (13) 46 (14) 18 (13) 11 (11) .75b
HBeAg positive at enrollment 22 (1) 65 (26) 18 (6) 88 (26) 101 (74) 106 (99) ⬍.001b
HBV genotype Ce 412 (33) 76 (35) 68 (23) 81 (25) 80 (62) 79 (78) ⬍.001b
ALT levelⱖ45 U/L at enrollment
59 (3) 29 (12) 11 (4) 33 (10) 21 (15) 8 (8) ⬍.001b
Long-term pattern of ALT levelf
All low-normalg 1179 (68) 114 (46) 168 (56) 96 (30) 21 (15) 43 (41)
Ever high-normalh 322 (19) 58 (23) 74 (25) 75 (23) 21 (15) 20 (19) ⬍.001b
Transient abnormali 159 (9) 61 (25) 47 (16) 108 (33) 55 (40) 22 (21)
Persistent abnormalj 62 (4) 14 (6) 11 (4) 45 (14) 40 (29) 19 (18)
NOTE. All values are expressed as no. (%) unless otherwise noted.
aCalculated by analysis of variance. bCalculated by2test.
cData were not available for 3 participants. dData were not available for 5 participants.
eData were not available for 863 participants because of baseline HBV DNA level undetectable (n ⫽ 519), low viral load (n ⫽ 264), and
inadequate serum sample for HBV genotyping (n⫽ 80).
fData were not available for 326 participants because of less than 2 measurements of ALT; some percentages do not total 100 due to rounding. gAll sequential ALT measurementsⱕ30 U/L.
hAll sequential ALT measurements⬍45 U/L and at least one ALT level ⬎30 U/L. iAt least one ALT levelⱖ45 U/L but ⬍50% of sequential ALT measurements ⱖ45 U/L. jALT levelⱖ45 U/L in ⱖ50% of sequential ALT measurements.
CLINICAL
cigarette smoking and alcohol consumption, long-term ALT pattern, and HBV genotype. The long-term pattern of serum ALT levels was independently associated with the develop-ment of hepatocellular carcinoma. Compared with partici-pants with all low-normal ALT levels, the multivariate-ad-justed hazard ratio (95% CI) was 1.63 (0.73–3.61) for ever high-normal ALT levels, 3.08 (1.41– 6.71) for transient normal ALT levels, and 5.75 (2.71–12.23) for persistent ab-normal ALT levels. The increasing trend was statistically significant (Ptrend⬍ .001). Genotype C was associated with a
higher risk of hepatocellular carcinoma than was B or mixed genotype, showing a multivariate-adjusted hazard ratio (95% confidence interval) of 2.05 (1.20 –3.51).
Discussion
In this analysis, 9 groups of long-term HBV DNA change were identified to illustrate spontaneous changes in HBV viral loads. Regardless of baseline HBV DNA levels, participants with spontaneous viral load reduction to⬍104copies/mL during follow-up had a similar risk of
hepatocellular carcinoma to those with a baseline HBV DNA level⬍104copies/mL. We found that the group of
long-term HBV DNA change was a strong independent risk predictor of hepatocellular carcinoma after taking age, sex, long-term ALT pattern, HBV genotype, and hab-its of cigarette smoking and alcohol consumption into consideration. In other words, participants with similar
HBV DNA levels at enrollment had different risks of hepatocellular carcinoma depending on their HBV DNA levels during follow-up. For participants with the same HBV DNA levels at enrollment, greater decreases in serum HBV DNA levels during follow-up were associated with lower risk of hepatocellular carcinoma. This finding is consistent with those of clinical trials, which have shown improvements in liver histologic findings and reduction in the incidence of advanced liver disease with effective antiviral therapy.25–27It suggests the importance of
regu-lar monitoring of serum HBV DNA levels and therapy to lower HBV viral load in patients with chronic hepatitis B. The risk of hepatocellular carcinoma was primarily de-termined by HBV DNA levels at enrollment for the par-ticipants who had persistent HBV DNA levels during follow-up. In other words, the higher the persistent HBV viral load, the higher the risk of subsequent hepatocellular carcinoma except in the cases of persistent viral loads ⬎107copies/mL. Participants in group I with persistent
viral loads ⬎107 copies/mL had a higher proportion of
young, female, HBeAg-seropositive (99%), ALT normal participants than those in other long-term HBV DNA change groups. They had a moderate risk of developing hepatocellular carcinoma even after taking age, sex, long-term ALT pattern, HBV genotype, and habits of cigarette smoking and alcohol consumption into consideration. HBV-infected persons in the immune tolerance phase are
Figure 3. Cumulative incidence of hepatocellular carcinoma by (A) group of long-term HBV DNA change and (B) long-term pattern of ALT. Both P
values for log-rank tests were⬍.001.aData were not available for 326 participants because of⬍2 measurements of ALT level.bALT levelⱖ45 U/L inⱖ50% of sequential ALT measurements.cAt least one ALT levelⱖ45 U/L but ⬍50% of sequential ALT measurements ⱖ45 U/L.dAll sequential ALT measurements⬍45 U/L and at least one ALT level ⬎30 U/L.eAll sequential ALT measurementsⱕ30 U/L.
CLINICAL
characterized by HBeAg seropositivity and high viral load but normal serum ALT levels with minimal liver disease progression.19,28 –30 A large proportion of participants
with persistent viral loads⬎107copies/mL were
remain-ing in their immune tolerance phase durremain-ing the long-term follow-up period. Their moderate risk of hepatocellular carcinoma may be attributable to their persistent immune tolerance phase resulting from certain unique interactions between viral and host characteristics. The mechanism and risk of hepatocarcinogenesis may be different be-tween patients with chronic hepatitis B in the immune tolerance phase and those in the immune clearance phase. Further study is needed to elucidate and differentiate these mechanisms.
A recent case-cohort study of male adult chronic HBV carriers has reported only 3 groups of long-term HBV DNA change.31The limited number of long-term change
groups identified in the previous study may be due to the small number of participants with serum HBV DNA levels ⬎104copies/mL at enrollment. Owing to a large number
of participants with serum HBV DNA levels ⬎104
cop-ies/mL at enrollment, 9 distinctive groups of long-term HBV DNA change were identified in our study. They included 4 groups of long-term HBV DNA change with baseline levels⬎107copies/mL and another 5 groups with
baseline levels⬍107copies/mL. We were therefore able to
examine the impact of long-term sequential changes in
HBV viral load on subsequent hepatocellular carcinoma risk in a more refined manner.
In this study, a significant biologic gradient was asso-ciated with hepatocellular carcinoma risk: long-term pat-terns of ALT from all low-normal, ever high-normal, and transient abnormal to persistent abnormal levels. The risk of hepatocellular carcinoma started to increase at ever high-normal ALT levels. The threshold of high-normal ALT level associated with increased risk of hepatocellular carcinoma in this study was set as 30 U/L partly because it has been reported that the risk of liver-related mortality is increased even in patients with high normal ALT lev-els.32These data suggest that lowering the upper limit of
normal for ALT might be important in the medical man-agement of patients with chronic hepatitis B. Consistent with previous findings, the frequency of abnormal ALT levels (ⱖ45 U/L) during follow-up was important to eval-uate the risk of hepatocellular carcinoma.15 Serum ALT
levels usually reflect the degree of HBV-related liver cell injuries and may vary during the course of chronic HBV infection.19,33,34 It is important to monitor serum ALT
levels regularly to predict the risk of hepatocellular carci-noma.
In consideration of the cost, only the last follow-up HBV DNA samples were tested for participants with base-line HBV DNA levels⬍104copies/mL; only 82 (0.9%) of
them had HBV DNA levels ⱖ105 copies/mL at the last
Table 2. Incidence Rate of Hepatocellular Carcinoma by Group of Long-term HBV DNA Change, Long-term Pattern of ALT, and HBV Genotype Variable No. (%) of participants (N⫽ 3160) Person-years of follow-up No. of hepatocellular carcinoma cases
Incidence rate (per 100,000 person-years)
(95% CI)
Crude hazard ratio
(95% CI) P value
Group of long-term HBV DNA change
Control group: HBV DNA level ⬍104at enrollment
2020 (64) 24,515.4 18 73.4 (46.3–116.5) 1.00 (referent)
Group A-B-C: Decrease to⬍104
251 (8) 3067.6 5 163.0 (67.8–391.6) 2.23 (0.83–6.00) .11
Group D: Persistence at 104 to 105
309 (10) 3791.9 7 184.6 (88.0–387.2) 2.51 (1.05–6.01) .04
Group E-F: Decrease to/persistence at 105 to 106 336 (11) 4023.1 22 546.8 (360.1–830.5) 7.52 (4.03–14.01) ⬍.001 Group G-H: Decrease to/persistence at 106 to 107 137 (4) 1620.2 24 1481.3 (992.9–2210.0) 20.63 (11.20–38.02) ⬍.001 Group I: Persistence at⬎107 107 (3) 1311.3 5 381.3 (158.7–916.1) 5.23 (1.94–14.08) .001 Long-term pattern of ALTa
All low-normal 1621 (57) 19,810.4 20 101.0 (65.1–156.5) 1.00 (referent)
Ever high-normal 570 (20) 7054.1 13 184.3 (107.0–317.4) 1.81 (0.90–3.64) .10 Transient abnormal 452 (16) 5557.7 21 377.9 (246.4–579.5) 3.75 (2.03–6.91) ⬍.001 Persistent abnormal 191 (7) 2226.3 23 1033.1 (686.5–1554.7) 10.57 (5.81–19.25) ⬍.001 HBV genotypeb
B or mixed genotype 1501 (65) 18,287.1 32 175.0 (123.7–247.4) 1.00 (referent)
C 796 (35) 9630.5 40 415.3 (304.7–566.2) 2.40 (1.51–3.82) ⬍.001
CI, confidence interval.
aData were not available for 326 participants because of less than 2 measurements on ALT.
bData were not available for 863 participants because of baseline HBV DNA level undetectable (n ⫽ 519), low viral load (n ⫽ 264), and
inadequate serum sample for HBV genotyping (n⫽ 80).
CLINICAL
follow-up examination, and none were afflicted with hep-atocellular carcinoma. Therefore, participants with base-line HBV DNA levels⬍104copies/mL served as the
con-trol group. Because participants in this study were aged 30 years or older with genotype B/C HBV infection in early childhood, the findings of this study may not be directly applicable to chronic HBV carriers younger than 30 years of age or infected in adulthood by other HBV genotypes. There were some short-term fluctuations of follow-up HBV DNA levels during the observation period in each group of long-term HBV DNA change. However, for the overall 11-year follow-up, we did not found any group with an obvious increasing trend of long-term HBV DNA levels in this study. The rebound in serum HBV DNA levels is frequently observed for those who stopped anti-viral treatments, but only 16 of 1140 participants (1.4%) had rebound in this cohort study on the natural history of chronic hepatitis B.
In conclusion, a dynamic change in serum levels of HBV DNA over time is a strong risk predictor of hepatocellular carcinoma, independent of long-term pattern of ALT and HBV genotype. Spontaneous decrease of HBV DNA levels to⬍104copies/mL is associated with a significantly
low-ered risk of hepatocellular carcinoma. Regular monitoring of serum levels of HBV DNA and ALT is recommended for the clinical management of patients with chronic hepati-tis B.
Supplementary Material
Note: To access the supplementary material accompanying this article, visit the online version of
Gastroenterology at www.gastrojournal.org, and at doi: 10.1053/j.gastro.2011.06.036.
References
1. Dienstag JL. Hepatitis B virus infection. N Engl J Med 2008;359: 1486 –1500.
2. Lai CL, Ratziu V, Yuen MF, et al. Viral hepatitis B. Lancet 2003; 362:2089 –2094.
3. Stevens CE, Beasley RP, Tsui J, et al. Vertical transmission of hepatitis B antigen in Taiwan. N Engl J Med 1975;292:771–774. 4. Perrillo R. Hepatitis B virus replication⫻ time equals trouble.
Gastroenterology 2006;130:989 –991.
5. Beasley RP. Hepatitis B virus. The major etiology of hepatocellular carcinoma. Cancer 1988;61:1942–1956.
6. Chen CJ, Yu MW, Liaw YF. Epidemiological characteristics and risk factors of hepatocellular carcinoma. J Gastroenterol Hepatol 1997;12:S294 –S308.
7. Nguyen VT, Law MG, Dore GJ. Hepatitis B-related hepatocellular carcinoma: epidemiological characteristics and disease burden. J Viral Hepat 2009;16:453– 463.
8. Yang HI, Lu SN, Liaw YF, et al. Hepatitis B e antigen and the risk of hepatocellular carcinoma. N Engl J Med 2002;347:168 –174. 9. Kao JH, Chen PJ, Lai MY, et al. Hepatitis B genotypes correlate
with clinical outcomes in patients with chronic hepatitis B. Gas-troenterology 2000;118:554 –559.
10. Yang HI, Yeh SH, Chen PJ, et al. Associations between hepatitis B virus genotype and mutants and the risk of hepatocellular carcinoma. J Natl Cancer Inst 2008;100:1134 –1143.
Table 3. Multivariate-Adjusted Hazard Ratio of Developing Hepatocellular Carcinoma for Group of Long-term HBV DNA Change, Long-Term Pattern of ALT, and HBV Genotype
Variable
Model Ia Model IIb Model IIIb
Adjusted hazard ratio
(95% CI) P value
Adjusted hazard ratio
(95% CI) P value
Adjusted hazard ratio
(95% CI) P value
Group of long-term HBV DNA change Control group: HBV DNA level⬍104
at enrollment
1.00 (referent) 1.00 (referent) 1.00 (referent)
Group A-B-C: Decrease to⬍104 2.12 (0.78–5.73) .14 1.92 (0.70–5.28) .21 2.25 (0.68–7.37) .18 Group D: Persistence at 104to 105 2.54 (1.06–6.10) .04 2.36 (0.92–6.06) .07 3.12 (1.09–8.89) .03 Group E-F: Decrease
to/persistence at 105to 106 8.38 (4.44–15.81) ⬍.001 6.55 (3.28–13.06) ⬍.001 8.85 (3.85–20.35) ⬍.001 Group G-H: Decrease to/persistence at 106to 107 24.36 (13.02–45.61) ⬍.001 15.86 (7.94–31.68) ⬍.001 16.78 (7.33–38.39) ⬍.001 Group I: Persistence at⬎107 7.19 (2.66–19.46) ⬍.001 3.90 (1.37–11.04) .01 3.61 (1.15–11.38) .03 Long-term pattern of ALTc
All low-normal Not included 1.00 (referent) ⬍.001d 1.00 (referent) ⬍.001d
Ever high-normal 2.14 (1.03–4.47) .04 1.63 (0.73–3.61) .23
Transient abnormal 4.17 (2.00–8.70) ⬍.001 3.08 (1.41–6.71) .005
Persistent abnormal 8.00 (3.98–16.05) ⬍.001 5.75 (2.71–12.23) ⬍.001
HBV genotypee
B or mixed genotype Not included Not included 1.00 (referent)
C 2.05 (1.20–3.51) .009
CI, confidence interval.
aAdjusted for age, sex, cigarette smoking, alcohol drinking, and serum levels of ALT at enrollment.
bAdjusted for age, sex, cigarette smoking, alcohol drinking, total number of repeated measurements of ALT, and the other factors listed in the table. cData were not available for 326 participants because of less than 2 measurements on ALT.
dFor trend test.
eData were not available for 863 participants because of baseline HBV DNA level undetectable (n ⫽ 519), low viral load (n ⫽ 264), and
inadequate serum sample for HBV genotyping (n⫽ 80).
CLINICAL
11. Yu MW, Yeh SH, Chen PJ, et al. Hepatitis B virus genotype and DNA level and hepatocellular carcinoma: a prospective study in men. J Natl Cancer Inst 2005;97:265–272.
12. Kao JH, Chen PJ, Lai MY, et al. Basal core promoter mutations of hepatitis B virus increase the risk of hepatocellular carcinoma in hepatitis B carriers. Gastroenterology 2003;124:327–334. 13. Liu S, Zhang H, Gu C, et al. Associations between hepatitis B virus
mutations and the risk of hepatocellular carcinoma: a meta-anal-ysis. J Natl Cancer Inst 2009;101:1066 –1082.
14. Chen CJ, Yang HI, Su J, et al. Risk of hepatocellular carcinoma across a biological gradient of serum hepatitis B virus DNA level. JAMA 2006;295:65–73.
15. Wu CF, Yu MW, Lin CL, et al. Long-term tracking of hepatitis B viral load and the relationship with risk for hepatocellular carcinoma in men. Carcinogenesis 2008;29:106 –112.
16. Chen CJ, Yang HI, Iloeje UH. Hepatitis B virus DNA levels and outcomes in chronic hepatitis B. Hepatology 2009;49:S72– 84. 17. Chisari FV, Klopchin K, Moriyama T, et al. Molecular pathogenesis
of hepatocellular carcinoma in hepatitis B virus transgenic mice. Cell 1989;59:1145–1156.
18. Dunsford HA, Sell S, Chisari FV. Hepatocarcinogenesis due to chronic liver cell injury in hepatitis B virus transgenic mice. Cancer Res 1990;50:3400 –3407.
19. Liaw YF, Chu CM. Hepatitis B virus infection. Lancet 2009;373: 582–592.
20. Liaw YF, Leung N, Kao JH, et al. Asian-Pacific consensus state-ment on the managestate-ment of chronic hepatitis B: a 2008 update. Hepatol Int 2008;2:263–283.
21. Iloeje UH, Yang HI, Su J, et al. Predicting cirrhosis risk based on the level of circulating hepatitis B viral load. Gastroenterology 2006;130:678 – 686.
22. Yeh SH, Tsai CY, Kao JH, et al. Quantification and genotyping of hepatitis B virus in a single reaction by real-time PCR and melting curve analysis. J Hepatol 2004;41:659 – 666.
23. Nagin DS. Analyzing developmental trajectories: a semi-paramet-ric, group-based approach. Psychol Methods 1999;4:39 –177. 24. Jones BL, Nagin DS, Roeder K. A SAS procedure based on mixture
models for estimating developmental trajectories. Sociol Methods Res 2001;29:374 –393.
25. Mommeja-Marin H, Mondou E, Blum MR, et al. Serum HBV DNA as a marker of efficacy during therapy for chronic HBV infection: analysis and review of the literature. Hepatology 2003;37:1309 – 1319.
26. Liaw YF, Sung JJ, Chow WC, et al. Lamivudine for patients with chronic hepatitis B and advanced liver disease. N Engl J Med 2004;351:1521–1531.
27. Di Marco V, Marzano A, Lampertico P, et al. Clinical outcome of HBeAg-negative chronic hepatitis B in relation to virological re-sponse to lamivudine. Hepatology 2004;40:883– 891.
28. Chu CM, Karayiannis P, Fowler MJ, et al. Natural history of chronic hepatitis B virus infection in Taiwan: studies of hepatitis B virus DNA in serum. Hepatology 1985;5:431– 434.
29. Hui CK, Leung N, Yuen ST, et al. Natural history and disease progression in Chinese chronic hepatitis B patients in immune-tolerant phase. Hepatology 2007;46:395– 401.
30. McMahon BJ. The natural history of chronic hepatitis B virus infection. Hepatology 2009;49:S45–55.
31. Sung FY, Jung CM, Wu CF, et al. Hepatitis B virus core variants modify natural course of viral infection and hepatocellular carci-noma progression. Gastroenterology 2009;137:1687–1697. 32. Kim HC, Nam CM, Jee SH, et al. Normal serum aminotransferase
concentration and risk of mortality from liver diseases: prospec-tive cohort study. BMJ 2004;328:983–988.
33. Kim WR, Flamm SL, Di Bisceglie AM, et al. Serum activity of alanine aminotransferase (ALT) as an indicator of health and disease. Hepatology 2008;47:1363–1370.
34. Tsang PS, Trinh H, Garcia RT, et al. Significant prevalence of histologic disease in patients with chronic hepatitis B and mildly elevated serum alanine aminotransferase levels. Clin Gastroen-terol Hepatol 2008;6:569 –574.
Received December 8, 2010. Accepted June 3, 2011.
Reprint requests
Address requests for reprints to: Chien-Jen Chen, ScD, Genomics Research Center, Academia Sinica, 128 Academia Road Section 2, Nankang, Taipei 11529, Taiwan. e-mail:[email protected]; fax: (886) 2-2787-8784.
Acknowledgments
C.–F.C. and W.–C.L. contributed equally to this report. Dr Su’s current affiliation: Health Economics and Outcomes Research, Boehinger Ingelheim Pharmaceuticals, Inc., Ridgefield, CT, USA .
Other members of the REVEAL-HBV Study Group: Chang-Gung Memorial Hospital and Chang-Gung University: Y. F. Liaw; College of Public Health, National Taiwan University: T. H. H. Chen; Department of Microbiology, National Taiwan University: S. H. Yeh; Department of Public Health, National Defense Medical Center: C. A. Sun;
Department of Public Health, Tzu Chi University: S. Y. Chen; Huhsi Health Center, Penghu County: S. C. Ho, T. G. Lu; Kaohsu Health Center, Pingtung County: C. C. Chen; National Taiwan University Hospital: D. S. Chen, P. J. Chen, C. Y. Hsieh, H. S. Lee, P. M. Yang, C. H. Chen, J. D. Chen, S. P. Huang, C. F. Jan; Paihsa Health Center, Penghu County: W. C. How; Provincial Penghu Hospital: W. P. Wu, T. Y. Ou; Provincial Chutung Hospital: K. C. Shih; Provincial Potzu Hospital: W. S. Chung, C. Li; Sanchi Health Center, Taipei County: C. G. Lin; Shin Kong Wu Ho-Su Memorial Hospital: K. E. Chu; and Taipei City Psychiatric Center: M. H. Wu.
Conflicts of interest
The authors disclose the following: Dr Iloeje is an employee of and holds stock in Bristol-Myers Squibb Co. Dr Su was an employee of and held stock in Bristol-Myers Squibb Co previously. Professor Chien-Jen Chen was supported by research grants from Bristol-Myers Squibb to conduct the laboratory tests of HBV DNA for this study. Drs Chen, Lee, Yang, Chang, Jen, Hsiao, Wang, You, and Lu disclose no conflicts.
Funding
Supported by research grants from the Department of Health, Executive Yuan (Taipei, Taiwan); Academia Sinica (Taipei, Taiwan); National Health Research Institute (Taipei, Taiwan) (research grants awarded to C.-J.C.); Bristol-Myers Squibb (Wallingford, CT) to conduct the laboratory tests for this study; and National Taiwan University Hospital (Taipei, Taiwan) to conduct the laboratory test on HBV genotype for this study. The funding organizations of this study had no role in the design or conduct of the study, nor did they have any role in the collection, management, analysis, and interpretation of the data as well as the preparation, review, or approval of the manuscript. All data handling and statistical analyses were performed by staff at the National Taiwan University and Academia Sinica. At no time did the funding organizations have access to the data.
CLINICAL
Supplementary Materials and Methods Group-Based Trajectory Model
To identify distinctive groups of long-term changes in serum HBV DNA levels over 11 years of follow-up, the group-based trajectory model1 was used.
The analysis assumed that the heterogeneous study pop-ulation contained participants with multiple long-term patterns of serum HBV DNA levels. The technique was used to cluster participants following similar long-term patterns of serum HBV DNA levels in the same group, although long-term patterns of serum HBV DNA levels were never exactly the same among participants. In other words, the analysis was designed to group participants with similar patterns of long-term HBV DNA change together and to discriminate different groups of partici-pants with dissimilar patterns of long-term HBV DNA change over time.
Four key outputs of the group-based trajectory model1
included (1) the optimal number of groups of long-term HBV DNA change, (2) the shape of each long-term HBV DNA change group, (3) the group assignment for each participant (based on the highest posterior probabilities of belonging to each group), and (4) the proportion of study population in each group.
In this study, repeated measurements of serum HBV DNA levels were log10 transformed and modeled by a
censored normal distribution.1 The group-based
trajec-tory analysis was performed with the PROC TRAJ macro in SAS version 9.1.2Suppose Y
i ⫽ {yi1, yi2, yi3. . . yiT} rep-resented the long-term repeated measurements of serum HBV DNA levels (log10copies/mL) on a participant i over
T periods and P(Yi) denoted the probability of Yi. The group-based trajectory model assumes that the study population was composed of a mixture of J underlying groups of long-term HBV DNA change such that
P
共
Yi兲
⫽兺
j jPj
共
Y i兲
, where Pj共Yi兲 was the probability of Yigiven membership in group j andjwas the probability of group j. The basic model also assumed that conditional upon membership in group j, the random variables, yit, t ⫽ 1,2 . . . T, were independent. Thus, Pj共Y
i兲 ⫽
兿
TPj共y
it兲. The censored nor-mal distribution was used to define Pj共y
it兲, and the linkage between time (years of follow-up) and long-term HBV DNA levels was established via a latent variable, yitⴱj, that represented the predicted levels of HBV DNA of subject i at time t given membership in group j. The PROC TRAJ macro in SAS allowed estimation of up to a fourth-order polynomial relationship between time (years of follow-up) and long-term HBV DNA levels. It was assumed that
yitⴱj⫽0j ⫹1jXit⫹2jXit2⫹3jXit3⫹4jXit4⫹ it,
where it was a disturbance assumed to be normally distributed with a zero mean and a constant variance2.
Furthermore, the model’s coefficients (0j, 1j, j2, 3j,4j)
determined the shape for a specific group (j) of long-term HBV DNA change.
Model Selection
The group-based trajectory approach involved a 2-stage model selection process.3First, we chose the
op-timal number of long-term HBV DNA change groups based on testing the comparative fit of a series of models with different numbers of groups using an SAS macro named PROC TRAJ.2 In the second stage, the focus
turned to determining the preferred order of the polyno-mial specifying the shape of each long-term HBV DNA change group given the first-stage decision on the num-ber of groups.
The Bayesian information criterion (BIC) value was obtained for each model tested and was a fit index3 to
compare competing models that included different num-bers of long-term HBV DNA change groups or long-term HBV DNA change groups of various shapes. However, it was difficult to judge which model was clearly better without a concrete standard for calibrating the magni-tude of change in BIC. The log Bayes factor2 provided
useful statistics for calibrating the substantive impor-tance of a difference in the BIC scores of 2 nested models. The log Bayes factor approximation was defined by the formula.
2loge(B10)⬇ 2( 䉭BIC ),
where BIC was the BIC value of the alternative (more complex) model less the BIC value of the null (simpler) model.2The log Bayes factor was interpreted as a measure of
the extent of evidence for improvement of model fit, thereby ensuring model parsimony. The log Bayes factor values ranging from 0 to 2 were interpreted as weak evidence for the more complex model, values ranging from 2 to 6 were interpreted as moderate evidence, values ranging from 6 to 10 were interpreted as strong evidence, and values greater than 10 were interpreted as very strong evidence.
In the first stage (to identify the optimal number of groups of long-term HBV DNA change) of this study, a series of models that contained from one to 10 groups and included both a linear and a quadratic term for each group was systematically examined and compared. BIC rose steadily (that is, became less negative) as the number of groups increased from 1 (BIC⫽ ⫺10,715.74) to 9 (BIC⫽ ⫺8493.08) groups and thereafter began a steady decline (BIC⫽ ⫺8507.16 for 10 groups). The estimate of the log Bayes factor for the comparison of the 9- versus 8-group model equaled 42.96 (far exceeding 10). Thus, according to the log Bayes factor, this evidence was very strong in favor of the 9-group model.
In the second stage of this study, the focus turned to determining the preferred order of the polynomial spec-ifying the shape of each long-term HBV DNA change group given the first-stage decision on the number of groups. The fit of each competing model was then com-pared using the estimate of the log Bayes factor. Finally, a quadratic 9 groups of long-term HBV DNA change was identified as the best-fit model.
Group Assignment
Participants were classified into different groups of long-term HBV DNA change based on the highest
posterior probabilities of belonging to each group.1The
group of long-term HBV DNA change for each partici-pant was treated as a categorical variable for subsequent analyses.
References
1. Nagin DS. Analyzing developmental trajectories: a semi-paramet-ric, group-based approach. Psychol Methods 1999;4:39 –177. 2. Jones BL, Nagin DS, Roeder K. A SAS procedure based on mixture
models for estimating developmental trajectories. Sociol Methods Res 2001;29:374 –393.
3. Nagin DS. Group-based modeling of development. Cambridge, MA: Harvard University Press, 2005.