Effect of Direct-Current Biasing on the Dielectric Properties of
Barium Strontium Titanate
Jih-Wei Liou and Bi-Shiou Chiou
* Department of Electronics Engineering and Institute of Electronics, National Chiao Tung University, Hsinchu, TaiwanBa1-xSrxTiO3(BST, x = 0 to x = 1) ferroelectric ceramics
doped with 1.0 mol% MgO and 0.05 mol% MnO2 were
prepared with a rate-controlled sintering profile. As the strontium molar fraction x increased, the average grain size decreased from 14 µm for x = 0 to 2 µm for x = 1. Tem-perature dependence of the dielectric properties was mea-sured as a function of dc biasing. At 10°C above the Curie temperature, the changes of dielectric constant at 5000 V/ cm were 28%, 17%, 26%, and 36% for x = 0, 0.25, 0.5, and 0.75, respectively. The reduction of dielectric constant by the applied dc biasing was fitted by a phenomenological equation that was based on Devonshire’s theory. From this phenomenological equation, an anharmonic coefficient, which was an order parameter of the anharmonic interac-tions, was calculated for each composition. As the stron-tium molar fraction increased, these coefficients increased from 2.45 × 10⁻¹⁹cm2zV−2for x = 0 to 5.90 × 10⁻¹⁹cm2zV−2 for x = 0.75. A similar trend was observed on the dc field dependence of the dielectric loss, except at high field for x = 0, of which a high loss was obtained. A two-element circuit model was proposed to explain the effect of high dc biasing on the dielectric loss.
I. Introduction
F
ERROELECTRICbarium strontium titanate (BST, Ba1-xSrxTiO3) is of great interest for many practical applications. Many studies have been done on the temperature-dependent dielectric properties of BST.1–5 The effects of various dopants on thedielectric properties of BST also have been investigated exten-sively.6–9However, there are few studies on the dielectric
con-stant as a function of the dc-biasing field. Previous works have suggested that BST can be applied as a microwave phase shifter10,11and tunable capacitor.12–14A BST system must
ex-hibit the following characteristics if it is to be applied as an electrically tunable capacitor: a variation of dielectric constant under dc biasing greater than∼30% at the working tempera-ture; low dielectric loss under dc biasing; and insensitivity of dielectric properties to ambient temperature variation. Accurate measurement of these dielectric properties provides scientists and engineers with valuable information to properly incorpo-rate BST materials into their intended applications for many solid device designs. The purpose of this study is to understand the dielectric behavior of BST under dc biasing and discuss the important factors that influence the dielectric characteristics of BST.
In this study, the BST system was doped with MnO2 and
MgO, and it was prepared for the investigation of dielectric behavior under the dc-biasing field at various temperatures. The strontium molar fraction x ranged from 0 to 1 at intervals of 0.25 to vary the Curie temperature (TC) of the BST system.
Dopant MnO2was used to trap the electrons to obtain low-loss
dielectrics,8whereas dopant MgO was used as a grain-growth
inhibitor.6 A nonisothermal rate-controlled firing profile was
used to obtain a uniform sample microstructure.6
II. Experimental Procedure
Doped Ba1-xSrxTiO3 (x 4 0, 0.25, 0.5, 0.75, and 1)
poly-crystalline samples were prepared. Commercial BaCO3,
SrCO3, TiO2, MnO2, and MgO powders (Merck and Co., Inc.,
Darmstadt, German) were ball milled with acetone and alumina balls for 24 h. Excess 1.0 mol% TiO2 was added to obtain a
TiO2-rich liquid phase during sintering.15In all the samples,
the amount of MgO and MnO2 additives were 1.0 and 0.05
mol%, respectively. After the mixture was dried by an IR lamp, it was calcined in an alumina crucible at 1100°C for 2 h in air. The powder then was mixed with a small amount of poly(vinyl acetate) (PVA) binder and pressed to form disk-shaped samples at 180 MPa. Sintering of samples was conducted with a con-trolled firing profile6after the binder was burned out at 400°C
for 3 h. Samples were then heated at 100°C/min to 1200°C, with a 6 min hold at 1200°C, and then to the sintering tem-perature of 1400°C at the same heating rate. The sintering profile was conducted in air in a 1700°C box furnace with a maximum heating rate of ∼120°C/min (Model 51314, Lind-berg, Watertown, WI) with a temperature controller (Model 818P, Endotherm Corp., Reston, VA). The sintering time was 18 min at 1400°C, and the samples then were cooled to room temperature at a rate of 180°C/h. Phase identification of these specimens was conducted by powder X-ray diffractometry (XRD) (Model Dmax-B, Rigaku Co., Tokyo, Japan) with CuKa radiation. A thin gold film was deposited on the surface of the as-sintered pellet. Scanning electron microscopy (SEM) (Model S-750, Hitachi, Ltd., Tokyo, Japan) was used to exam-ine the microstructures. The average grain size was determexam-ined by the linear-intercept method from the micrograph of the as-sintered sample.
Pellet-shaped samples, 0.86 cm in diameter, were polished with SiC paper (grit 800) to 0.4 mm thickness. Extreme scru-tiny was taken in the polishing and in thickness measuring of the sample to assure flat and parallel surfaces. The thickness deviation was within the experimental error of the measure-ment. Samples were electroded by rubbing In–Ga (40:60) alloy on both surfaces to provide ohmic contacts. The dielectric con-stant of each sample was calculated from the measured capaci-tance and the specimen geometry. The capacicapaci-tance was mea-sured with an impedance–capacitance–resistance (LCR) meter (Model HP4275A, Hewlett-Packard, Palo Alto, CA) at 10 kHz. A 200 V dc power supply was connected to the LCR meter as the external dc bias. The current–voltage characteristics were measured (Model HP4140, Hewlett–Packard).
W. Huebner—contributing editor
Manuscript No. 191621. Received August 6, 1996; approved April 7, 1997. Supported by Chung-Shan Institute of Science and Technology under Contract No. CS-85-0210-D-009-009 and supported in part by National Science Council of Tai-wan, ROC, under Contract No. NSC 85-2216-E-009-012.
Presented at the 98th Annual Meeting of the American Ceramic Society, In-dianapolis, IN, April 15, 1996 (Electronics Division, Paper No. E-26-96).
*Member, American Ceramic Society.
Journal
III. Results and Discussion (1) X-ray Analysis and Grain-Size Measurements
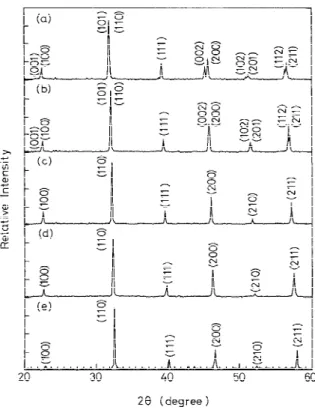
Typical XRD patterns of sintered samples (BST doped with 1.0 mol% MgO and 0.05 mol% MnO2) are shown in Fig. 1.
The XRD patterns show that the crystal structures are tetrag-onal phase for x4 0 and 0.25 and that the structures are cubic phase for x4 0.5, 0.75, and 1. The labeled Miller index for each diffraction peak is based on the space groups of the two types of crystal structure. The tetragonal space group for x4 0 and 0.25 and the cubic space group for x4 0.5, 0.75, and 1 are, respectively, P4mm and Pm3m. Syamaprasad et al.1have
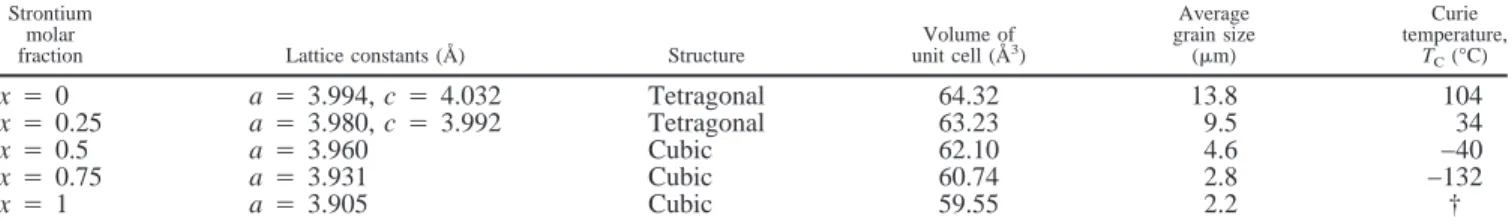
reported XRD patterns of the undoped BST system and have revealed that there are two or more phases for x4 0.3 and 0.5 that are prepared by conventional solid-solution sintering. In the current work, with a rate-controlled sintering profile, ce-ramics of doped BST without apparent multiphase solution have been obtained. The unit-cell parameters based on the least-squares refinement with more than nine diffraction pat-tern peaks are calculated and listed in Table I. The unit-cell volume calculated from the lattice constants decreases as the strontium molar fraction increases; this is attributed to the smaller Sr2+ ionic radius compared to the Ba2+ ionic radius.
The effect of dopants on the microstructure of the BST system is shown in Fig. 2. As a result of a rate-controlled sintering profile, no abnormal grain growth is observed in Fig. 2. The average grain sizes of all compositions also are listed in Table I. These values range from 14 to 2mm and decrease with an increase in strontium molar fraction. It is argued that the ce-ramic and liquid phases become more refractory as strontium content increases. Therefore, under the same sintering condi-tion, the grain-growth inhibitor MgO becomes more difficult to dissolve in the more-refractory samples.
(2) Temperature Dependence of Dielectric Properties
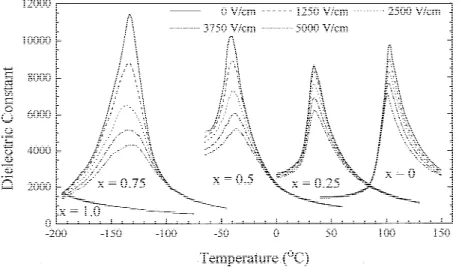
The temperature dependence of the dielectric constant mea-sured at 10 kHz as a function of dc-biasing field for the doped BST system is shown in Fig. 3. The dielectric constant de-creases with increasing dc-biasing field in both ferroelectric
and paraelectric states. The Curie temperature is defined as the temperature of maximum dielectric constant. The maximum dielectric constant (kmax) for the doped BST system ranges
from 8 × 10³to 1.2 × 10⁴for x# 0.75. The dielectric peak for x 4 1 is beyond the temperature range of the measuring ap-paratus. The values of dielectric constant are in a reasonable range compared to pure BST reported from other work.16–20
Hence, dopants MgO and MnO2do not significantly change the
ferroelectric feature of the BST system. Figure 3 shows that the higher the strontium molar fraction, the broader the ferroelec-tric-to-paraelectric transition. In the doped BST system, the half-height width of the Curie peak is estimated to be∼20° to 40°C, increasing with strontium molar fraction for x 4 0 to x4 0.75. There are several causes that may result in transition broadening, such as composition variation and internal stress. Because only single-phase material is observed in the XRD patterns, it is believed that composition variation is not the major cause for transition broadening. It is argued that transi-tion broadening can be attributed to the larger internal stress in the finer grains.19As the grain size decreases, the remaining
internal stress due to ferroelectric deformation becomes more difficult to release. The remaining internal stress can vary in value to a larger extent, leading to a larger distribution width. Hence, the Curie peak broadens and the dielectric constant at the ferroelectric state is higher.16–20Deb et al.3reported that T
C
of an undoped BaTiO3 was 128°C. Kinoshita and Yamaji16
prepared BaTiO3of various grain sizes ranging from 1 to 53 mm and found that TCvalues were slightly influenced by the
grain size and ranged from 120° to 122°C. In the current study, TC for the doped BaTiO3 is 104°C, which is lower than the
reported data. This is due to the addition of Mn2+ ions that
occupy the Ti4+ion sites. The lower valence state of the Mn2+
ion, with the resulting oxygen vacancy leading to a ‘‘break’’ of the cooperative vibration of the Ti–O chains, is responsible for the lower TCof the manganese-doped system.8The TCvalues
that decrease with strontium molar fraction also are listed in Table I. The lattice parameters (which are represented by the root of the calculated unit-cell volume from X-ray analysis data) and TCvalues of different strontium molar fractions are
shown in Fig. 4. A linear relation of lattice parameters with strontium molar fraction is observed. In the perovskite struc-ture, the Sr2+and Ba2+ionic radii at sixfold coordinate are 1.16
and 1.36 Å, respectively.9 Because of the ionic radius
differ-ence, the lattice parameter VC1/3decreases with increasing
stron-tium molar fraction. Furthermore, with decreasing lattice pa-rameter, which is the characteristic distance of spontaneous polarization of ferroelectric ceramics, the phase transition oc-curs at a lower temperature. A linear relation of TCwith molar
fraction x occurs for x# 0.75 as a straight line, as shown in Fig. 4. From this linearity, the TC of the doped BST system with
other strontium molar fractions can be designed by controlling the strontium fraction, and an empirical equation can be ob-tained for x# 0.75:
TC(°C)4 104 − 288x (1)
where the x is the strontium molar fraction.
The reported TCfor x4 1 is lower than the value predicted
by Eq. (1). Viana et al.5 have reported that the ferroelectric
transition of SrTiO3occurs at 40 K and that the structural phase
transition occurs at 105 K. One possible reason for the reduc-tion of TC is that the long-range ferroelectric order is
sup-pressed by quantum fluctuation at low temperatures.
(3) Biasing Field Dependence of Dielectric Properties
Figure 3 also shows that the dielectric constant decreases with increasing bias field E. The change of dielectric constant in the ferroelectric state is not apparent for the sample with x4 0. The domain width motion under dc biasing is believed to be the factor influencing the dielectric behavior. The dc-biasing effect usually is stronger in the paraelectric state than in the ferroelectric state for the sample where x4 0 in Fig. 3. As for strontium-containing samples, a broad ferroelectric-to-para-Fig. 1. XRD patterns for BST doped with 1.0 mol% MgO and 0.05
mol% MnO2: (a) x4 0, (b) x 4 0.25, (c) x 4 0.5, (d) x 4 0.75, and
electric transition occurs. Therefore, the dc-biasing effect on the dielectric constant occurs in both the ferroelectric and para-electric states. Change in dipara-electric constant increases with in-creasing strontium content, and the maximum change occurs at TC, as shown in Fig. 3. The dielectric tunability Dtis defined at
a specific working temperature T and dc-biasing field E as, Dt~T,E!=
S
1−k8k80
D
×100% (2)
where k80and k8 are the real part of the relative permittivity (i.e.,
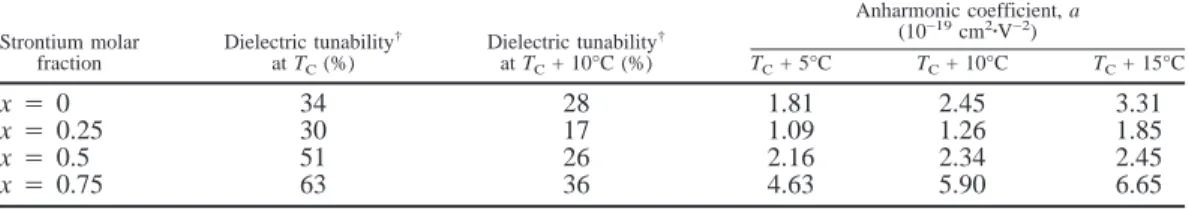
dielectric constant) under zero bias field and under bias field E, respectively. As listed in Table II, Dtwith 5 kV/cm biasing field
at TCand TC+ 10°C increase with x for x4 0.25 to x 4 0.75.
According to Devonshire’s theory,21in the perovskite cubic
structure, titanium ions oscillate in an anharmonic potential of
the form ar2+ br4, where r is the position of the titanium ion.
The Helmholtz free energy F(P,T) of the titanium ion can be expanded in even powers of the polarization P with coefficients that are a function of the temperature only; that is,
F(P,T )4 F(0,T) + A(T − u)P2+ BP4+ CP6 (3)
whereu is the Curie–Weiss temperature, and A, B, and C the expansion coefficients. In the paraelectric state, the free energy increases as polarization, and there is only one minimum, at polarization P4 0. If a small field E is considered to apply on the materials, that is, approximately the minimum, the P6term
can be neglected. Moreover, in the paraelectric state, where the polarization is much smaller than that in the ferroelectric state, neglecting the P6term in the expansion of free energy is
ap-propriate. The dielectric constant k8 can be obtained by taking
Table I. Structural Parameters, Curie Temperatures, and Average Grain Sizes for the 1.0-mol%-MgO- and 0.05-mol%-MnO2-Doped Ba1−xTiO3System
Strontium molar
fraction Lattice constants (Å) Structure
Volume of unit cell (Å3) Average grain size (mm) Curie temperature, TC(°C) x4 0 a4 3.994, c 4 4.032 Tetragonal 64.32 13.8 104 x4 0.25 a4 3.980, c 4 3.992 Tetragonal 63.23 9.5 34 x4 0.5 a4 3.960 Cubic 62.10 4.6 −40 x4 0.75 a4 3.931 Cubic 60.74 2.8 −132 x4 1 a4 3.905 Cubic 59.55 2.2 † †TCof doped SrTiO
3(x4 1) exceeds the temperature range of the measurement apparatus.
Fig. 2. Microstructures of BST doped with 1.0 mol% MgO and 0.05 mol% MnO2: (A) x4 0, (B) x 4 0.25, (C) x 4 0.5, (D) x 4 0.75, and (E) x4 1.
the second derivative of free energy (Eq. (3)) with respect to polarization:
4p
k8 =2A~T−u!+12BP
2 (4a)
In the case of a small field E, it is assumed that k8E≈4pP can be substituted into the second term in Eq. (4a). Thus, a representation of the dielectric constant is obtained as
4p
k8 =2A~T−u!+ 3Bk82E2
4p2 (4b)
Hence, the dielectric constant varies with dc-biasing E. Equation (4b) reduces to the Curie–Weiss law when the anhar-monic term is negligible. The lattice anharanhar-monic interaction of titanium ions is responsible for the field dependence of the dielectric constant of the BST system. Rearranging Eq. (4b), with some approximation,21one can obtain a
phenomenologi-cal equation that is valid in the paraelectric state: k8 k80 = 1 ~1+ak80 3 E2!1/3 (5)
where a4 12B/(4p)3is the phenomenological coefficient (or
anharmonic coefficient), which is derived from the anharmonic term in the Helmholtz free energy. Johnson21has shown that
the imaginary part of the relative permittivity of Ba0.6Sr0.4TiO3
follows another phenomenological equation: k9
k90
= 1
~1+ak80
3E2!2/3 (6)
where k90and k9 are the imaginary parts of the relative
permit-tivity under zero bias field and under bias field E, respectively. The anharmonic coefficient a is supposed to be an order pa-rameter of the anharmonic interactions. According to Eq. (5) the k8/k80ratio decreases as the anharmonic coefficient a,
zero-bias dielectric constant k80, and/or applied bias field E increase.
Because k80is larger at the Curie peak, the dielectric tunability
at TCis larger than that at TC+ 10°C for all compositions, as
listed in Table II. From a practical perspective, the domain movement and hysteresis under dc biasing in the ferroelectric state yield nonpredictable dielectric characteristic changes. Thus, although the dielectric tunability at TCis larger than that
at TC+ 10°C, the suggested working temperature is in the range
from TC+ 5°C to TC+ 15°C, where the material resides in the
paraelectric state and the dielectric tunability remains appre-ciable.
Figure 5 exhibits the field dependence of the dielectric con-stant and loss tangent at TC+ 5°C, TC+ 10°C, and TC+ 15°C.
The solid lines for the dielectric constant are obtained by curve fitting with the phenomenological equation (Eq. (5)). The well-fitted curves, as shown in the upper part of Fig. 5, suggest that the dc field applied up to 5000 V/cm is small enough such that neglecting the P6 term in Eq. (3) is appropriate. The
anhar-monic coefficients obtained by curve fitting with Eq. (5) are summarized in Table II. These coefficients increase with tem-perature and strontium fraction, except for the composition x4 0. The ionic radii of Ba2+and Sr2+are 1.36 and 1.16 Å,
respectively.9The smaller Sr2+ion makes the unit cell smaller
and the crystal more compact, as indicated in Table I. This results in a shorter distance between the Ti4+ion and its
non-nearest neighbors. That is, the thermal vibration amplitude of the Ti4+ion is softened more easily by these nonnearest
neigh-bors. This enhances the anharmonic effect, and, consequently, the anharmonic coefficient increases with strontium content for 0.25 # x # 0.75. Devonshire’s theory assumes a stress-free condition. However, there is internal stress among grains that affect the microscopic value of the dielectric constant. The internal stress decreases with increasing grain size.19As
sum-marized in Table I, the grain size of doped BaTiO3 is the
largest, and the internal stress effect should be the smallest. Fig. 3. Temperature dependence of dielectric constant as a function of dc-biasing field for doped BST system. Measuring frequency is 10 kHz.
Table II. Dielectric Tunability and Anharmonic Coefficients for the 1.0-mol%-MgO- and 0.05-mol%-MnO2-doped Ba1−xSrxTiO3System
Strontium molar fraction Dielectric tunability† at TC(%) Dielectric tunability† at TC+ 10°C (%) Anharmonic coefficient, a (10−19cm2zV−2) TC+ 5°C TC+ 10°C TC+ 15°C x4 0 34 28 1.81 2.45 3.31 x4 0.25 30 17 1.09 1.26 1.85 x4 0.5 51 26 2.16 2.34 2.45 x4 0.75 63 36 4.63 5.90 6.65
†Dielectric tunability is defined by the percentage change of the dielectric constant under 5000 V/cm dc-biasing field.
Fig. 5. 10 kHz dielectric constant and loss tangent as a function of dc biasing field for doped BST: (A) x4 0, (B) x 4 0.25, (C) x 4 0.5, and (D) x4 0.75. Circle, triangle, and square represent the data at TC+ 5°C, TC+ 10°C, and TC+ 15°C respectively. Solid lines are the theoretical
With little influence of internal stress, the anharmonic interac-tions and the anharmonic coefficients are enhanced. In Fig. 3, the change of the dielectric constant of BaTiO3is obvious at
the paraelectric state, as compared to that at the ferroelectric state. For 0.25 # x # 0.75 in Fig. 3, this change becomes obvious at both ferroelectric and paraelectric states. This change also contributes to the internal stress effect, which broadens the phase transition and, hence, ‘‘dilutes’’ the con-tribution of the anharmonic coefficient.
The dielectric losses also are reduced by the applied dc field for all the compositions, as shown in the lower part of Fig. 5. On the basis of Eqs. (5) and (6), one obtains the equation for the dielectric loss tandC.
tandC= k9 k8= tandC0 ~1+ak80 3 E2!1/3 (7)
where tandC0is the dielectric loss under zero bias (i.e., k90/k80).
The solid lines for the field dependence of dielectric loss shown in Fig. 5 are the theoretical curves calculated by Eq. (7) with the anharmonic coefficients listed in Table II. The measured dielectric loss is in good agreement with the theoretical pre-diction, except in the high-field region of the composition for x4 0. Doped BaTiO3(i.e., x4 0) is the most lossy material
among the compositions studied. The dielectric loss for x4 0 in the high-field region (E > 2500 V/cm) increases with the bias field. There are other dielectric loss mechanisms that result in
increasing dielectric loss with dc field. In a tunable capacitor, one loss term is attributed to leakage current under dc biasing. The leakage current can be represented as a dc resistor in a parallel combination with a capacitor for dielectric features. As shown in Fig. 6, the dc resistor and the capacitor are voltage variable for a tunable capacitor. Thus, the resistance and the capacitance obey the following relations:
R~V!= V
I~V! (8)
C~V!=C0~k8−jk9! (9)
where I(V ) is the I–V characteristic of the doped BST system, C0the geometric capacitance, and k8 and k9 the real and
imagi-nary parts of the relative permittivity, respectively. Equations (8) and (9) show that the dielectric features of the tunable capacitor are related to the I–V characteristics and to the field dependence of relative permittivity (referring to Eqs. (6) and (7)). Therefore, at some specific measuring frequency v, the measured dielectric loss tand can be expressed as
tand=tandC+tandR=tandC+
1 k8vRC0
(10) where tan dCis the dielectric loss of the voltage-variable
ca-pacitor as described in Eq. (7) and tandRthe dielectric loss that
corresponds to the leakage current under dc biasing. tandRis
inversely proportional to the dc resistance.
The I–V characteristics for x4 0 at TC+ 5°C, TC+ 10°C,
and TC + 15°C are shown in Fig. 7. The leakage current
in-creases with increasing applied voltage and temperature. In the low-field region (V# 40 V), the leakage current follows as a powers form of I ~ V1.3. However, in the high-field region
(V $ 50 V), I ~ V6. According to the space charge limited
currents (SCLC) theory for polycrystalline insulators,22
strongly defected surfaces of the crystalline grains provide a source of deep trap states, where the trapped charge carriers are excited by the applied voltage and thermal energy. Below an onset voltage, an ohmic current flows. For higher voltage, the current transfers to a rapidly increasing behavior of the form I ~ Va, wherea is in the range 1.2–2.0.23As the voltage reaches Fig. 6. Circuit to represent the tunable capacitor under dc biasing.
Fig. 7. I–V characteristics for doped BaTiO3at TC+ 5°C, TC+ 10°C, and TC+ 15°C.
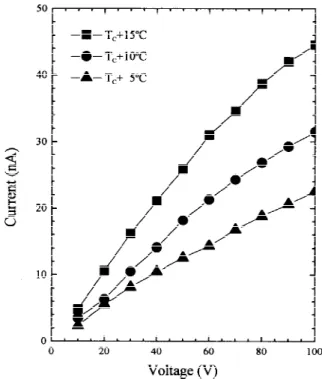
Fig. 8. I–V characteristics for doped Ba0.75Sr0.25TiO3at TC+ 5°C,
a traps-filled limited voltage, the current increases more rap-idly, and the I~ V characteristics depend on the trap distribu-tions of the form I~ Vm(m4 2, 4, 6, . . .) or I ~ eaV. Figure 7 shows that the ohmic region is not present when the applied voltage is >10 V. The traps-filled limited voltage is∼50 V. The I–V characteristics in the high-field region follow the form I~ V6and imply that the traps are exponentially distributed in the
energy gap. The dc resistance R(V ) for x4 0 calculated from Eq. (8) is a function of voltage and decreases rapidly with it. The I–V characteristics for x4 0.25 are shown in Fig. 8. Over the applied voltage range, the I–V characteristics are all in the ohmic region. At TC+ 5°C, the leakage current for x4 0.25
(∼22.53 nA at 100 V) is much lower than that for composition x4 0 (∼9170 nA at 100 V). The dc resistivities for x4 0.25 are 51.3, 37.0, and 25.2 GVzcm at TC+ 5°C, TC+ 10°C, and TC+ 15°C, respectively. With these values and Eq. (10), the
dielectric loss corresponding to the dc-resistor tandRis
evalu-ated be 0.0005 for TC+ 5°C, 0.0008 for TC+ 10°C, and 0.0014
for TC+ 15°C. These values are much lower than the measured
dielectric loss shown in Fig. 5(b). Therefore, the dielectric loss for x4 0.25 is dominated by the loss from the voltage-variable capacitor, i.e., tan dC in Eq. (10), and, thus, the theoretical
curves, as described by Eq. (7), fit well. But, for the case of x4 0, the two loss mechanisms described in Eq. (10) compete with each other. Figure 5(a), in the low-field region, shows that the specimen is of such good insulation that the dielectric loss from the voltage-variable capacitor dominates. As the voltage increases, the rapid decrease in resistance yields a rapid in-crease in the dielectric loss tandRfrom the dc resistance. Thus,
tan dR is important in the dielectric loss. This results in an
increase of dielectric loss with dc bias in the high-field range for x4 0, as shown in Fig. 5(a).
The grain-growth inhibitor MgO also acts as an acceptor in BaTiO3ceramics. It is reported that the Mg2+ion substitutes in
the Ti4+site up to 0.25 mol%.24,25As mentioned previously, it
is more difficult to dissolve MgO in strontium-rich samples than in barium-rich samples because of the more refractory nature of strontium-rich samples. Sample grain size decreases with an increase of strontium content as listed in Table I. In other words, MgO is more effective as an acceptor in a barium-rich sample, which yields more oxygen vacancies and more traps. It is argued that the deviation of the dielectric loss from the theoretical prediction for the composition with x 4 0 (shown in Fig. 5(a)) is attributed to the increase of trap states.
IV. Conclusions
(1) Ba1-xSrxTiO3 doped with 1.0 mol% MgO and 0.05
mol% MnO2has been fabricated by a rate-controlled sintering
profile. MgO was more effective to inhibit the grain growth for strontium-rich composition. The grain size of samples de-creases from 14mm for doped BaTiO3(i.e., x4 0) to 2 mm for
doped SrTiO3(i.e., x4 1).
(2) A linear relation, TC(°C)4 104 − 288x, exists between
the Curie temperature and strontium fraction x. However, the reported TCvalue of SrTiO3(i.e., the composition at x4 1) is
lower than that predicted by this empirical equation. It is be-lieved that the deviation is due to the quantum fluctuation at low temperatures.
(3) For the application of the tunable capacitor, it is sug-gested that the working temperature is 5°–15°C above TCto
prevent the instability of the dielectric behavior caused by the phase transition at∼TC.
(4) The phenomenological equations (Eqs. (5) and (6)) de-rived on the basis of Devonshire’s theory explain the field dependence of the dielectric properties for the paraelectric Ba1-xSrxTiO3system.
(5) Both the anharmonic coefficient and the dielectric tun-ability increase as more strontium is presented. It is believed that the smaller Sr2+ ion results in shorter Ti4+ to nonnearest
neighbor distance, which enhances the anharmonic effect. (6) The dielectric loss as a function of dc biasing in the paraelectric state suggests that the dielectric loss comprises two loss mechanisms, which can be represented as a two-compo-nent circuit, as depicted in Fig. 6. The loss from the voltage-variable capacitor tandCis important in the low-loss materials
(x4 0.25, 0.5, and 0.75) of which the dc resistance is large. Loss resulting from the dc resistor, tandR, dominates when the
biasing field is >2500 V/cm for x4 0.
References
1U. Syamaprasad, R. K. Galgali, and B. C. Mohanty, ‘‘Dielectric Properties
of the Ba1-xSrxTiO3System,’’ Mater. Lett., 7 [5–6] 197–200 (1988).
2B. S. Chiou, S. T. Li, J. G. Duh, and P. H. Chang, ‘‘Equivalent Circuit
Model in Grain-Boundary Barrier Layer Capacitors,’’ J. Am. Ceram. Soc., 72 [10] 1967–75 (1989).
3K. K. Deb, M. D. Hill, and J. F. Kelly, ‘‘Pyroelectric Characteristics of
Modified Barium Titanate Ceramics,’’ J. Mater. Res., 7 [12] 3296–305 (1992).
4S. L. Swartz and A. S. Bhalla, ‘‘Dielectric Properties of SrTiO3
Glass-Ceramics,’’ Ferroelectrics, 87, 141–54 (1988).
5R. Viana, P. Lunkenheimer, J. Hemberger, R. Bo¨hmer, and A. Loidl,
‘‘Di-electric Spectroscopy in SrTiO3,’’ Phys. Rev. B: Condens. Matter, 50 [1] 601– 604 (1994).
6B. S. Chiou, C. M. Koh, and J. G. Duh, ‘‘The Influence of Firing Profile and
Additives on the PTCR Effect and Microstructure of BaTiO3Ceramics,’’ J.
Mater. Sci., 22, 3893–900 (1987).
7B. S. Chiou and S. T. Lin, ‘‘Dielectric Characteristics of LiF-Doped
BaTiO3with Nb2O5and Dy2O3Addition,’’ Mater. Chem. Phys., 20, 431–50 (1988).
8F. Batllo, E. Duverger, J. C. Jules, J. C. Niepce, B. Jannot, and M. Maglione,
‘‘Dielectric and EPR Studies on Mn-Doped Barium Titanate,’’ Ferroelectrics, 109, 113–18 (1990).
9S. B. Herner, F. A. Selmi, V. V. Varadan, and V. K. Varadan, ‘‘The Effect
of Various Dopants on the Dielectric Properties of Barium Strontium Titanate,’’
Mater. Lett., 15, 317–24 (1993).
10R. W. Babbitt, T. E. Koscica, and W. C. Drach, ‘‘Planar Microwave
Elec-tro-optic Phase Shifters,’’ Microwave J., [June] 63–79 (1992).
11F. Selmi, R. Hughes, V. K. Varadan, and V. V. Varadan, ‘‘Tunable
Ce-ramic Phase Shifters and Their Applications,’’ Proc. Soc. Photo-Opt. Instrum.
Eng., 1916, 180–88 (1993).
12D. Galt, J. C. Price, J. A. Beall, and R. H. Ono, ‘‘Characterization of a
Tunable Thin-Film Microwave YBa2Cu3O7-x/SrTiO3 Coplanar Capacitor,’’
Appl. Phys. Lett., 63 [29] 3078–80 (1993).
13A. Outzourhit, U. Trefny, T. Kito, and B. Yarar, ‘‘Tunability of the
Di-electric Constant of Ba0.1Sr0.9TiO3Ceramics in the Paraelectric State,’’ J.
Mater. Res., 10 [6] 1411–17 (1995).
14A. Outzourhit, J. U. Trefny, T. Kito, B. Yarar, A. Naziripour, and A. M.
Hermann, ‘‘Fabrication and Characterization of Ba1-xSrxTiO3Tunable
Thin-Film Capacitors,’’ Thin Solid Thin-Films, 259, 218–24 (1995).
15H. U. Anderson, ‘‘Influence of Ba / Ti Ratio on the Initial Sintering Kinetics
of BaTiO3,’’ J. Am. Ceram. Soc., 56 [11] 605–606 (1973).
16T. T. Fang and H. L. Hsieh, ‘‘The Effects of Pore Morphology and
Micro-structure on the Dielectric Properties of High-Purity BaTiO3,’’ Chin. J. Mater.
Sci., 21 [2] 127–35 (1989).
17B. W. Lee and K. H. Auh, ‘‘Effects of Grain Size and Mechanical Process
on the Dielectric Properties of BaTiO3,’’ J. Mater. Res., 10 [6] 1418–23 (1995).
18K. Kinoshita and A. Yamaji, ‘‘Grain-Size Effects on Dielectric Properties
in Barium Titanate Ceramics,’’ J. Appl. Phys., 47 [1] 371–73 (1976).
19H. T. Martirena and J. C. Burfoot, ‘‘Grain-Size Effects on Properties of
Some Ferroelectric Ceramics,’’ J. Phys. C: Solid State Phys., 7, 3182–92 (1974).
20G. Arlt, D. Hennings, and G. de With, ‘‘Dielectric Properties of
Fine-Grained Barium Titanate Ceramics,’’ J. Appl. Phys., 58 [4] 1619–25 (1985).
21K. M. Johnson, ‘‘Variation of Dielectric Constant with Voltage in
Ferro-electrics and Its Application to Parametric Devices,’’ J. Appl. Phys., 33 [9] 2826–31 (1962).
22H. Nemoto and I. Oda, ‘‘Direct Examination of PTC Action of
Single-Grain Boundaries in Semiconducting BaTiO3Ceramics,’’ J. Am. Ceram. Soc., 63 [7–8] 398–401 (1980).
23W. Osak and K. Tkacz, ‘‘Investigation of I–V Characteristics in
Polycrys-talline BaTiO3,’’ J. Phys. D: Appl. Phys., 22, 1746–50 (1989).
24G. V. Lewis and C. R. A. Catlow, ‘‘PTCR Effect in BaTiO
3,’’ J. Am.
Ce-ram. Soc., 68 [10] 555–58 (1985).
25C. J. Peng and H. Y. Lu, ‘‘Compensation Effect in Semiconducting Barium