INTRODUCTION
Concern exists about declines in river-specific stocks of, and the perceived effects of such declines on, the larger populations of the highly valued and intensively fished species of temperate-zone Anguilla and the subsequent production of sexually maturing (silver) eels (Peterson 1997, ASMFC 2000, Haro et al. 2000, ICES 2001, 2003, Tatsukawa 2003). River-specific declines in silver eel production may occur due to the harvesting of older and faster growing juvenile (yel-low) eels (Svedäng 1999, Dekker 2000) but insufficient information exists to determine whether there is a pop-ulation-wide decline in silver eel production over the continental range (Greenland to northern South Amer-ica; Tesch 1977) of the American eel Anguilla rostrata (Haro et al. 2000, ICES 2001), although a recent report
(Dekker et al. 2003) concludes that such a decline has occurred.
Localized differences in habitat conditions and high exploitation of American eels may induce effects such as a decrease in age and size at maturity and increased growth rate, amongst other factors, that may also occur in marine and anadromous species (Vøllestad 1992, Rijnsdorp 1993, Trippel 1995, Oliveira & McCleave 2000, Stokes & Law 2000). For the panmictic American eel (Avise et al. 1986), localized differences in life-history patterns are likely to be phenotypic in origin rather than genotypic and not heritable in a stock-specific manner. However, before stock-specific hypotheses can be tested, better information is needed on the geographic and temporal change in life-history char-acteristics of specific stocks under varying regimes of exploitation.
© Inter-Research 2004 · www.int-res.com *Email: [email protected]
Variation in the annual growth, by sex and
migration history, of silver American eels
Anguilla rostrata
B. M. Jessop
1,*, J. C. Shiao
2, Y. Iizuka
3, W. N. Tzeng
41Department of Fisheries and Oceans, Bedford Institute of Oceanography, PO Box 1006, Dartmouth,
Nova Scotia B2Y 4A2, Canada
2Institute of Zoology, and 3Institute of Earth Sciences, Academia Sinica, Nankang, Taipei, Taiwan 11529, ROC 4Institute of Fisheries Sciences, College of Life Science, National Taiwan University, Taipei, Taiwan 10617, ROC
ABSTRACT: Silver American eels Anguilla rostrata from the East River, Chester, on the Atlantic coast of Nova Scotia, as evaluated by the temporal pattern of Sr:Ca ratios in their otoliths, showed variable patterns of migration between river and estuarine/marine waters during their yellow eel stage. Eels with a history of primarily estuarine residence were longer (total length) at migration and had higher annual growth rates than did eels with a primarily freshwater residence. Female eels were longer at migration and had higher annual growth rates than did males. The percentage (64%) of silver eels with a history of estuarine residence and their larger size at age, size at migration, and higher growth rate relative to freshwater resident eels may result from higher productivity in oceanic than fresh-waters at higher latitudes, as modified by regional environmental conditions. Environmental condi-tions change with increasing latitude in a different pattern for American and Japanese eels than for European eels.
KEY WORDS: Anguilla rostrata · American eel · Otolith microchemistry · Strontium:calcium ratios · Migratory history
Few studies have examined aspects of the annual growth rates for each sex and the age and sex compo-sition at migration of silver American eels (Gray & An-drews 1971, Helfman et al. 1984, Bouillon & Haedrich 1985, Jessop 1987, Oliveira 1999). The different life-history strategies (female eels typically migrate at larger sizes and older ages than do males) and usually higher annual growth rates for female eels than for males requires analysis of such sexual differences (Helf-man et al. 1984, Jessop 1987, Oliveira 1999, Oliveira & McCleave 2002). Although the presence of yellow eel fisheries in the watershed may affect the biological composition of the stock, few have reported specifi-cally on the presence or absence of such fisheries. This study examines the age composition and growth rates, for each sex, of silver American eels from a river unex-ploited for yellow eels (and infrequently exunex-ploited for silver eels) and where no estuarine fishery occurs.
The environmental history of fishes has been exam-ined by analysis of the spatial and, by inference, tem-poral pattern of Sr:Ca ratios in their otoliths (Secor et al. 1995, Secor 1999, Secor & Rooker 2000), with much attention given to Anguilla spp. (Otake et al. 1994, Tzeng & Tsai 1994, Tzeng 1996, Tzeng et al. 1997, 2000b, 2002, 2003, Jessop et al. 2002) and many others.
Although water temperature may have a significant effect on the otolith Sr:Ca ratio and the interaction of water temperature and salinity may be important in the interpretation of fish migratory patterns based on Sr:Ca ratios (Elsdon & Gillanders 2002), the chemistry of the ambient environment is the primary factor (Bath et al. 2000) and marine waters have a Sr:Ca ratio ca. 4.8 times higher than do fresh waters (8.6 × 10– 3vs 1.8× 10– 3; Campana 1999). The maximum difference between mean otolith Sr:Ca ratios of a juvenile marine fish was ca. 1.3 × 10– 3over a wide range of tempera-tures and salinities (Elsdon & Gillanders 2002). Such a potential bias is unlikely to affect the interpretation of fish migratory patterns except in the transition be-tween saline and freshwater environments and, given that the bias may be positive or negative and often less than the maximum, may have little practical effect.
Tsukamoto & Arai (2001) have shown that Anguilla spp. may be facultatively rather than obligatorily cata-dromous and that several ecophenotypes or migra-tory contingents may occur, including yellow eels that migrate irregularly between freshwater and the estu-ary (Tsukamoto & Arai 2001, Jessop et al. 2002). Fish migration between marine and freshwater habitats may generally be explained by differences in the avail-ability of food, and in high latitudes the productivity of freshwaters may be lower than in adjacent estuaries (Gross 1987, Gross et al. 1988). Thus, Tsukamoto & Arai (2001) and Tsukamoto et al. (2002) have hypothe-sized that marine/estuarine residency of Anguilla spp.
should occur more frequently at high latitudes where the productivity of the freshwater habitat is lower than that of adjacent coastal regions.
This hypothesis can be interpreted in at least 3 ways: (1) that the abundance of eels in a given coastal/estu-arine zone relative to their abundance in the water-sheds of adjacent river systems increases at higher lat-itudes, as does both (2) the proportion of eels in a river or estuary showing evidence of periodic migration between freshwater and estuarine habitats, and (3) the proportion of eels totally resident in a marine/estuarine habitat (the sea eels of Tsukamoto & Arai 2001 and Tzeng et al. 2002). The absolute or relative abundance of eels in a river system and its receiving estuarine and coastal areas is unknown for any North American river system (Haro et al. 2000), or for Europe or Asia. How-ever, 64% of silver eels migrating from a river on the Atlantic coast of Nova Scotia, Canada (Jessop et al. 2002) showed evidence of freshwater-estuarine migra-tion as yellow eels, as did 65% of yellow eels in the estuarine portion of the lower Hudson River, New York (Morrison et al. 2003), which supports the second inter-pretation of the hypothesis. We will examine the impli-cation in the second part of the hypothesis that such a migratory contingent of American eels from the East River, Nova Scotia in the northern portion of their range will show differences in annual growth rates reflective of their relative residence times in fresh and estuarine waters. Thus, eels that have spent most of their life in freshwater should have a slower annual growth rate than do eels that have resided mostly in the estuary.
MATERIALS AND METHODS
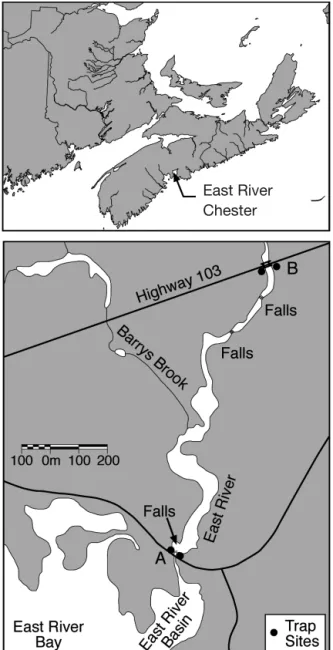
Study area. The East River (near Chester, Nova Scotia, at latitude 44° 35’ 16’’ N) drains a watershed of 134 km2, of which 10.5% is lake surface, into Mahone Bay, which is located slightly south of the mid-point along the Atlantic coast of Nova Scotia, Canada (Fig. 1). River discharge ranges from < 5 m3s–1during the summer to perhaps 35 m3
s–1 during the spring flood. Conifers dominate the watershed forest. The water basin geology consists mostly of granite and metamorphic rocks overlain by shallow soils with poor drainage and containing numerous lakes and many bogs and heaths, with resultant acidification (pH range 4.7 to 5.0) of the water (Watt 1986, Watt et al. 1995). Jessop (2000) and Jessop et al. (2002) provide a more detailed description of the river.
Sample collection. Downstream migrant silver eels were collected between September 28 and 30, 1998, from a weir located 1.3 km upstream from the river mouth (Site B, Fig. 1). Of the 91 silver eels caught
before the weir washed out due to flooding, 61 were representatively selected for otolith analysis. Upstream migrant juvenile eels were collected in elver traps located just upstream of the head of tide (Site A, Fig. 1) and later at Site B. At Site A, the traps caught 1202 upstream migrant juvenile eels between May 2 and July 25, 2000 (Jessop 2003a), from which up to 6 juve-niles per 10 mm length interval over the range of lengths from 70 to 150+ mm (total n = 44) were system-atically collected between May 5 and June 19, with 37 selected for otolith analysis (Table 1). At Site B, of 30 elver/juvenile eels collected on June 28, 19 were selected for otolith analysis. The silver eels were frozen after capture and then thawed prior to length (to 1.0 mm) measurement. Freezing and thawing produce a shrinkage of ca. 1.6% in American eels of lengths ca. 400 mm (W. Morrison, Chesapeake Bay Biological Laboratory, pers. comm.). The silver eel heads were then preserved in 95% ethanol for later extraction of the otoliths. The juvenile eels were, after anaesthetiza-tion in MS-222, measured for length (total length [TL] to 0.1 mm for eels less than 100 mm and to 1.0 mm for larger eels) and then preserved in 95% ethanol until otolith extraction. The length distributions of juvenile eels selected for otolith extraction were matched with their length distributions when freshly measured and a linear conversion equation developed (PL = 3.681 + 0.908 FL, where PL is preserved length and FL is fresh length in mm over the range from 60 to 180 mm; n = 36, r2= 0.998, p < 0.001). Reported lengths were adjusted, as appropriate, for ethanol preservation and freezing. Juvenile eels were not sexed because all were of a size (<180 mm) and age (≤4 yr) where few, if any, would be sexually differentiated (Jessop 1987, Oliveira & McCleave 2002). The sex of the silver eels was evalu-ated macroscopically (testes were deeply lobed while ovaries were frilled and ribbon-like; Bertin 1956, Krueger & Oliveira 1997) and then compared with the generally accepted idea that male silver eels are typi-cally less than 400 mm long (Krueger & Oliveira 1997). Fig. 1. Map of the East River, Chester, Nova Scotia, showing
the geographic location of the river (upper panel) and sampling sites (lower panel)
Group Sampling date Site Stage Sex N Age (yr) Length (mm) Weight (g)
(dd/mm/yy) Mean ± SD Range Mean ± SD Range
1 05–19/06/00 River Juvenile Undiff. 29 1–4 101.9 ± 25.84 72.4–180.1 1.42 ± 1.650 0.29–8.2 mouth
2 05–22/06/00 River Juvenile Undiff. 8 1 66.0 ± 2.94 62.0–69.8 0.25 ± 0.068 0.14–0.32 mouth
3 28/06/00 1.3 km Elver/ Undiff. 19 1–2 70.9 ± 6.05 63.0–84.0 0.33 ± 0.108 0.19–0.58 upriver juvenile
4 28–30/09/98 1.3 km Silvera Male 35 10–25 354.4 ± 18.0 326–412 78.9 ± 10.04 62.7–115.2
upriver Female 26 11–29 467.6 ± 86.6 378–740 207.5 ± 176.71 92.6–882.2 Table 1. Anguilla rostrata. Sample data for microchemistry analysis of otoliths of American eels collected from the East River,
Nova Scotia. Undiff.: undifferentiated gonads
East River
Otolith preparation and measurement. Sagittal otoliths were removed, prepared for electron probe microanalysis and the Sr and Ca concentration mea-sured along a transect of the sagittal plane of the otolith from the primordium to the otolith edge as described by Tzeng et al. (1997) and Jessop et al. (2002). The environmental history of each eel was interpreted by examining the temporal pattern of Sr:Ca ratios along the otolith transect, under the assumption that the temporal pattern reflects habitat salinity in response to the positive relation between otolith Sr:Ca ratio and ambient salinity in marine, estu-arine and freshwater fishes (Tzeng 1996, Kawakami et al. 1998, Secor & Rooker 2000). We considered Sr:Ca ratios less than 4.0 × 10– 3to indicate freshwater resi-dence and values greater than 5.0 × 10– 3to indicate estuarine residence, with intermediate values repre-senting a change in habitat (Jessop et al. 2002) (Fig. 2).
Migratory classification. Each eel was classified, based on the pattern and value of the Sr:Ca ratio mea-surements, into 1 of 4 migratory groups, or contingents, following Jessop et al. (2002):
Group 1: Entrance to freshwater as an elver and remaining in freshwater until capture as a juvenile (yellow) eel or maturing (silver) eel.
Group 2: Entrance to freshwater as an elver and remaining in the river for a variable number of years before returning to the estuary for a variable number of years and finally returning to the river before capture.
Group 3: Entrance to freshwater as a juvenile after one or more years in the estuary, then remaining in the river until capture.
Group 4: Entrance to freshwater as a juvenile after one or more years in the estuary, then remaining in the river for a variable number of years before returning to the estuary for a variable number of years and finally returning to the river before capture.
The percentage of freshwater residence, after initial river entrance, for migration Groups 1 and 2 was based on the percent of Sr:Ca measurement values along the otolith transect that were ≤4.0 × 10– 3, as measured from the first Sr:Ca value of the first pair of Sr:Ca values ≤4.0 × 10– 3(typically 5 to 10 measurement spots after the elver check, nominally the freshwater check). For migration Groups 3 and 4, the transect was divided into 2 sections: (1) from the freshwater check to the last Sr:Ca value > 4.0 × 10– 3, which covers the period from entrance to the estuary to entrance to freshwater, and (2) from the first Sr:Ca value of the first pair of Sr:Ca values ≤4.0 × 10– 3 to the otolith edge, which covers the period from initial freshwater entrance to migration downstream as a silver eel. The freshwater residence period was estimated as the percentage of Sr:Ca ratio values ≤4.0 × 10– 3 following initial freshwater entrance.
Otolith measurement and back-calculation proce-dures. After microprobe analysis, the otoliths were repolished and etched with 5% EDTA to enhance the annuli (Tzeng et al. 1994). All of the otoliths analyzed for Sr:Ca ratio were aged by counting annuli, and the distances were measured (to 0.001 mm) by image analysis software along the longest radius (usually, unless another radius permitted better visualization) from the core to the outer edge of various life-stage markers and the otolith edge, e.g. freshwater check at the transition from glass eel to elver and the annuli marking the age in years. Oliveira (1996) confirmed that otolith ring formation was annual for yellow Amer-ican eels in a Rhode Island river in the northeastern United States. For the purpose of examining the body length-otolith radius relation, data were included from an additional 12 juvenile eels (TL range 62.3 to 79.5 mm) from the East River, Chester, Nova Scotia, and from 25 elvers (TL range 53.6 to 69.9 mm) from the East River, Sheet Harbour, Nova Scotia (located ca. 130 km NE of the East River, Chester). Jessop (2003a) observed that elvers appear to be in a different growth stanza than are larger juvenile eels, and a plot of the body length-otolith radius data (Fig. 3) indicated a Fig. 2. Anguilla rostrata. Sr:Ca ratio transects along the otolith
radius from the core to the edge illustrating various patterns of movement and residence history of silver American eels from the East River, Nova Scotia. The horizontal line at a Sr:Ca ratio of 4 × 10– 3represents the transition between fresh
and saline waters, while the arrows indicate the freshwater check and first annulus
difference in this relation between elvers and larger juvenile eels. Consequently, the body length-otolith radius relation used for back-calculation of juvenile and silver eel lengths-at-age was based only on data from the juvenile and silver eel life stages.
No obvious reason exists to prefer either the ‘scale proportional’ (SPH) or ‘body proportional’ (BPH) hypo-theses, which assume either a constant proportional deviation from the mean size of the scale or body, and procedures for the purpose of back-calculating length-at-age from the relationship between otolith radii lengths at each annulus and eel TL (OR-TL relation) (Francis 1990, 1995). Given that each model can pro-duce very different back-calculated lengths-at-age from the same data, the differences between the meth-ods in estimating length-at-age can provide a mini-mum measure of the variability of back-calculation. For both the SPH and BPH models, linear regressions (r2= 0.980; quadratic polynomial models provided triv-ial improvement in fit) were fitted to the appropriate distribution of logarithmically (base 10) transformed maximal otolith radii and body TL of juvenile and sil-ver eels (Francis 1990, 1995) (Fig. 3). For the SPH model, the regression coefficients of the OR-TL rela-tion (log10otolith radius [mm] = 0.8498 × log10TL [mm] – 2.1031) were used to define the back-calculation equation as follows:
log10Li = log10Lc+ log10(Oi/Oc)/b
or in non-logarithmic form Li = (Oi/Oc)1/bLc
where Li= back-calculated eel body length at age i,
Lc = eel body length at capture, b = slope from the regression of otolith radius on body TL, Oi = otolith
radius at annulus i, and Oc= otolith radius from core to edge. For the BPH model, the regression coefficients of the TL-OR relation (log10 TL [mm] = 1.1533 × log10radius [mm] + 2.4700) were used to define the following back-calculation equation:
log10Li = [(c + d log10Oi) / (c + d log10Oc)] log10Lc
or in non-logarithmic form Li = (Oi/Oc)dLc
where c = intercept and d = slope from the regression of body TL on otolith radius. Mathematically, Li is a
geometric estimate and thus was adjusted to an arith-metic estimate following Ricker (1975, p. 275).
Growth analysis. The ‘best’ back-calculation model
for presentation was based on the minimum mean per-cent difference between the observed mean length-at-age and the values estimated by each back-calculation model (SPH, BPH) for Ages 1 to 3 of the silver and juve-nile eels. The BPH model, which also had the largest lengths-at-age, was selected. In 2 cases where the final annulus measurement was very close to the otolith edge measurement, the logarithmically transformed and then back-transformed BPH back-calculated length-at-age exceeded the observed length by 0.5 to 0.9 mm. These final back-calculated lengths-at-age were arbitrarily fixed at 1.0 mm less than the observed length; the potential error in doing so was estimated at less than 0.3%.
Several restrictions were placed on the back-calculated length-at-age estimates for the silver eels. (1) Length-at-age values were logarithmically (base 10) transformed prior to statistical analysis because the variance of the mean lengths-at-age increased signifi-cantly (statistical significance was accepted at α < 0.05) with increasing age. Eel growth rates were calculated beginning with the first annulus (Age 1). (2) Although female silver eels to Age 29 and male silver eels to Age 22 were found, the length-at-age and annual growth analyses were restricted to Ages 1 to 13 so as to permit minimal cell sample sizes of at least 7 fish per sex by migratory group (except for male migratory Group 4 with a minimum of 4 fish), after the males and females of migratory Group 3 were omitted from analysis be-cause of small sample size. Oliveira & McCleave (2002) noted that faster growing yellow eels might metamor-phose to silver-phase eels and leave the river at an earlier age than slower growing eels. The age restric-tion reduces the possibility that slower growing eels might be disproportionately represented at older ages.
The migratory groups were then pooled and recate-gorized on the basis of whether more than or less than 50% of the habitat residency after the elver stage occurred in fresh or salt water. The estuarine habitat group was defined as those eels for which more than 50% of the Sr:Ca values were > 4.0 × 10– 3along the otolith transect from the first pair of values < 4.0 × 10– 3; Fig. 3. Anguilla rostrata. Relationship between the total
length (mm) and otolith radius (mm) appropriate to the BPH (body proportional hypothesis) back-calculation model for elvers, juvenile (yellow), and silver American eels from
the freshwater habitat group had less than 50% of the Sr:Ca values > 4.0 × 10– 3. Thus, 4 sex by habitat groups were defined: F1 and M1 = female and male eels with more than 50% of their habitat residency in fresh-water, F2 and M2 = female and male eels with more than 50% of their habitat residency in estuarine waters. The effect of migration history on length-at-age was examined for each sex. Cell sample sizes of 8 or more fish and cell mean lengths with 95% confi-dence intervals (CI) less than ±10% of the mean were achieved by restricting the length-at-age and growth analysis to ages up to 16 yr.
Annual growth was estimated as the difference between length at age t+1 and at age t. Growth rate variances were heterogeneous (Fmaxtest > 5.0) among years for each of the sex-by-habitat residence groups and the standard deviation increased with the mean for individual eel growth rates, so the data were loga-rithmically transformed (base 10) for statistical ana-lysis. Length-at-age and annual growth rates were approximately normally distributed.
The multiple, sequential measure of otolith radius length, corresponding to different ages, from individual fishes requires the use of repeated-measures proce-dures because the assumption of independence among observations is not met (Chambers & Miller 1995, Oliveira & McCleave 2002). Each year of age provides 1 growth interval for a given fish and all growth intervals were considered equally without regard to an eel’s age at capture. A mixed-effects, 3-way repeated measures ANOVA with an autoregressive error structure similar to that of the general model used by Bowen et al. (1992) was used to analyze the longitudinal data on eel length-at-age and annual growth. Age was considered a within-subjects effect, and sex and either migratory group or percent freshwater residency were considered as between-subjects effects. Calculations were made using the mixed-procedure methods of SAS (2001). Single degree of freedom (df) pairwise contrasts be-tween factors (e.g. male freshwater versus female freshwater) were adjusted by sequential Bonferroni corrections as necessary.
Silver eel lengths and ages at migration and mean annual growth rates (over all ages) were ana-lyzed by standard ANOVA and Tukey HSD multiple comparison tests.
The effect magnitude (degree of difference between factors) was estimated as the correlation coefficient r and interpreted as to whether they were large enough to be considered biologically important following Cohen (1988). Effect magnitude r statistics less than 0.1 are regarded as minor, from 0.1 to 0.3 as small, from 0.3 to 0.5 as medium, and from 0.5 to 0.7 as large.
Theoretical growth parameters for American eels grouped by sex and migratory history were estimated
by fitting the back-calculated lengths-at-age of indi-vidual eels to the 3 parameter von Bertalanffy growth equation (VBGF):
and the Gompertz growth equation:
where Lt= length (mm) at age t, L∞= asymptotic aver-age maximum length, K = growth rate coefficient, t0= theoretical age at which fish length = 0, and ε = normal error term. Given that the variances of the lengths-at-age increased with increasing lengths-at-age, a loss function was used to adjust for a constant coefficient of variation of the residuals rather than a constant variance (Quinn & Deriso 1999, Haddon 2001). Parameter estimates and Wald 95% confidence intervals (estimate ±t× asymp-totic SE) were made by iterative non-linear least squares using the Gauss-Newton method (S-Plus 2001). Growth curves for each sex and sex by migratory history group were compared for coincidence by the analysis of the residual sum of squares (ARSS) method (Chen et al. 1992, Haddon 2001).
RESULTS
Back-calculation procedures
The back-calculated lengths-at-age of the silver eels were slightly larger for the BPH model than for the SPH model, but did not differ significantly because all mean lengths-at-age for each method were well within the respective 95% CIs for the alternative method. At Age 1, BPH model lengths-at-age were ca. 1.8% larger for male eels and 1.4% larger for female eels, and the difference declined to a relatively constant 0.5% for males and 0.2% for females by Age 17. For the juvenile eels, the BPH model lengths-at-age were also larger (by 1.1 to 1.3%) than the SPH model values. Relative to the annual mean (60.3 mm over Years 1996 to 2000) and range of elver lengths in the East River (Jessop 2003b), the BPH model values of length at age were judged more realistic. For Ages 1 to 3, the mean length-at-age estimated from juvenile eels and from silver eels did not differ significantly (F = 1.14, df = 1, 253, p = 0.29). No significant interaction occurred between age and development stage (F = 1.72, df = 2, 253, p = 0.18), indicating that the estimated mean lengths-at-age of juvenile and silver eels was not influ-enced by development stage. Thus, there was no indi-cation of Lee’s phenomenon, where the mean back-calculated lengths at younger ages decrease with the increasing age of the fishes used in back-calculation.
L L k t = ∞exp− e−k t t(− ) 1 0 Lt = L∞(1−e−K t t[−0])+ε
Growth differences between migratory groups A mixed-effects repeated-measures ANOVA of the mean lengths-at-age among migratory Groups 1, 2, and 4 indicated significant effects for sex (F = 6.75, df = 1, 51, p = 0.012) and age(F = 500.4, df = 13, 636, p < 0.0001) but not for migratory group (F = 1.09, df = 2, 51, p = 0.34), indicating that the mean length-at-age was similar among migratory groups. The interaction of sex and migratory group was not significant (F = 2.21, df = 2, 51, p = 0.12) nor were the interactions of age and migratory group and age and sex. Similarly, the effect of migratory group on annual growth was not signifi-cant (F = 2.24, df = 2, 51, p = 0.12). Thus, the migratory groups were pooled and the length-at-age and annual growth by estuarine (100% – freshwater residency %) and freshwater contingents was analyzed. For the estuarine-residency contingent, the modal percent of estuarine residency was 73.1% (range 52.0 to 90.9%) for males and 85.4% (range 56.2 to 93.2%) for females, while for the freshwater-resident contingent the modal freshwater residency was 94.3% (range 51.0 to 100%) for males and 98.4% (range 56.0 to 100%) for females.
Length differences between sexes and habitat residence groups
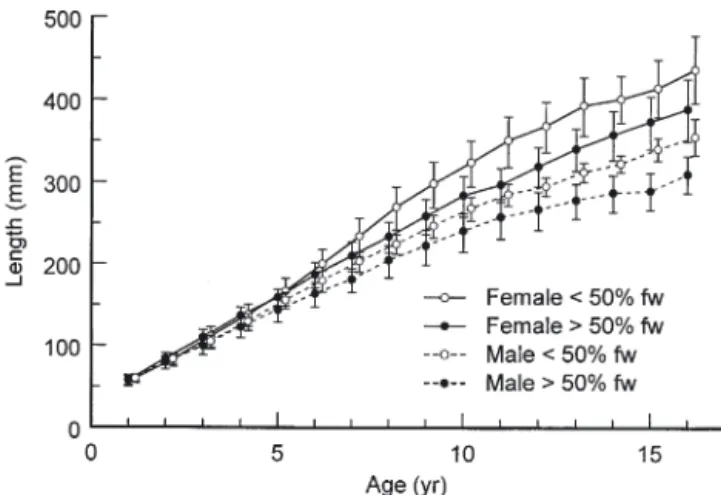
A mixed-effects repeated-measures ANOVA indi-cated significant effects on silver eel length by sex, habitat residence and age (Table 2). Interactions between sex and habitat residence and age and habi-tat residence were not significant. The interaction between sex and age was significant, indicating that lengths-at-age differed between sexes (Fig. 4). Mean lengths-at-age for female silver eels were significantly larger than for males, with significant differences between sexes beginning at Age 6. At Age 16, fe-male silver eels with a history of estuarine residence (436.4 mm) were significantly longer in mean length
than were female eels with a freshwater history (388.2 mm), as were male silver eels (354.6 vs 309.3 mm) (Fig. 4).
Growth differences between sexes and habitat residence groups
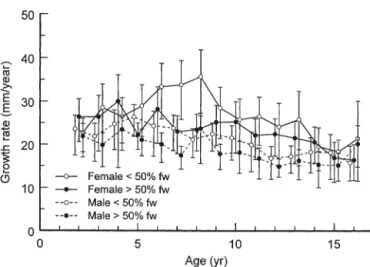
A mixed-effects repeated-measures ANOVA indi-cated significant effects on silver eel annual growth by sex, habitat residence and age, with no significant interactions among factors (Table 3, Fig. 5). To Age 16, female eel annual growth was higher than for males, and estuarine residents grew more rapidly than did freshwater residents. Annual growth rate varied with age, tending to decline with increasing age.
The mean annual growth (all ages) of individual female silver eels averaged 25.2 mm yr–1(25.4 mm yr–1 to Age 16) and 20.5 mm yr–1(20.7 mm yr–1to Age 16) for male silver eels (Table 4). Female silver eels with a
Effect df F p Sex 1.57 18.86 < 0.0001 %FW 1.57 8.64 0.005 Sex × %FW 1.57 0.02 0.90 Age 15.781 636.14 < 0.0001 Age × Sex 15.781 2.55 0.001 Age × %FW 15.781 1.29 0.20 Age × Sex × %FW 15.781 0.81 0.67 Table 2. Anguilla rostrata. Mixed-effects ANOVA results for the effects of sex, freshwater residency (%FW), and age on the length-at-age of silver American eels from the East River,
Nova Scotia Effect df F p Sex 1.57 36.56 < 0.001 %FW 1.57 11.14 < 0.002 Sex × %FW 1.57 0.05 0.82 Age 14.724 636.14 < 0.001 Age × Sex 14.724 1.06 0.39 Age × %FW 14.724 0.80 0.66 Age × Sex × %FW 14.724 0.85 0.61 Table 3. Anguilla rostrata. Mixed effects ANOVA results for the effects of sex, freshwater residency (%FW), and age on the annual growth of silver American eels from the East River,
Nova Scotia
Fig. 4. Anguilla rostrata. Mean back-calculated lengths-at-age (mm) with 95% CIs, by sex and migratory history, of silver American eels from the East River, Nova Scotia. fw =
history of estuarine residence had a significantly (F = 6.88, df = 1, 24, p = 0.015) higher mean annual growth rate (27.7 mm yr–1
) than did freshwater-resident females (22.7 mm yr–1), as did male silver eels (21.8 vs 19.2 mm yr–1; F = 4.59, df = 1, 33, p = 0.040).
The significance of the difference between parame-ters of the von Bertalanffy growth curves between sexes and sex-by-habitat residence groups may gen-erally be evaluated by the degree of non-overlap of the 95% CI (Table 5). Thus, where the 95% CI for parameter values do not overlap, the values differ significantly; where a parameter value for 1 or both groups is included within the 95% CI of the other group, no significant difference exists, but where the 95% CI for each parameter simply overlap, no defini-tive conclusion can be made. For example, the aver-age maximum length (L∞) was significantly larger for females (862.8 mm) than for males (491.5 mm), and the growth coefficient (K ) was smaller for females
(0.040) than for males (0.066), but no conclusion can be made about the significance of the difference between the values of t0, the hypothetical age at which eels have zero length, for females (–0.658) and males (–0.819). For both males and females, L∞ was significantly larger and K was smaller, but not neces-sarily significantly so, for eels with an estuarine his-tory than for eels with a freshwater hishis-tory. The ARSS analysis indicated that the VBGF curves of male and female eels differed significantly (F = 126.3, df = 3, 989, p < 0.0001) as did those for males (F = 34.1, df = 3, 535, p < 0.0001) and females (F = 42.5, df = 3, 448, p < 0.0001) of estuarine and freshwater habitat his-tories. Consideration of the increased variability in length-at-age with increasing age resulted in VBGF parameter estimates for the various growth curves that were 5.0% (range –4.5 to 10.0%) higher for L∞, 7.6% (range –7.1 to 17.4%) lower for K, and 21.1% (range –3.9 to 47.3%) higher for t0than when a con-stant variance was assumed.
Lengths and ages at migration
Silver eel lengths at migration were significantly influenced by sex (F = 63.8, df = 1, 57, p < 0.0001) and habitat residence history (F = 4.81, df = 1, 57, p = 0.032), with no significant interaction between factors (F = 2.98, df = 1, 57, p = 0.09). At migration, male silver eels (mean length 354.4 mm) were significantly smaller than were female eels (mean length 470.4 mm) (Table 1). Eels (sexes combined) with a history of fresh-water residency were significantly smaller in mean length (390.4 mm) than were eels with an estuarine history (416.9 mm). Female silver eels with an estuar-ine residence history were longer (498.9 mm), but not significantly so (p = 0.058, Tukey HSD test), than females with a freshwater history (441.9 mm) although the effect size r = 0.31 of the difference between means was moderate. Male silver eels of different habitat res-idence histories did not differ significantly in length (estuarine 357.8 mm, freshwater 351.0 mm; p = 0.98, Tukey HSD test).
Silver eel age at migration was not significantly influenced by sex (F = 3.94, df = 1, 57, p = 0.052), although the non-significance was marginal, or by habitat residence history (F = 2.40, df = 1, 57, p = 0.13), and the interaction between sex and habitat history was not significant (F = 0.10, df = 1, 57, p = 0.75). At migration, females averaged 17.5 yr old and males averaged 15.5 yr old. The age at which silver eels of both sexes began downstream migration was negatively correlated with the mean annual growth rate (males: r = –0.92, n = 35, p < 0.001; females: r = –0.66, n = 26, p < 0.001).
Fig. 5. Anguilla rostrata. Mean annual growth (mm yr–1)
with 95% CIs, by sex and migratory history, of silver Ameri-can eels from the East River, Nova Scotia. fw = freshwater
residence
Group Mean N ± 95% CI Range
Male 20.5 35 19.0–21.4 13.9–29.0 Female 25.2 26 22.6–26.8 14.9–38.0 > 50% fw 20.7 30 18.8–21.8 13.9–32.6 < 50% fw 23.4 31 21.2–24.7 17.4–38.0 Male, > 50% fw 19.2 17 17.4–20.6 15.7–29.0 Male, < 50% fw 21.8 18 19.8–23.3 13.9–28.8 Female, > 50% fw 22.7 13 19.5–25.3 14.9–32.6 Female, < 50% fw 27.7 13 24.6–30.3 21.0–38.0 Table 4. Anguilla rostrata. Mean annual growth (mm yr–1),
with sample size (N), 95% CI, and range, by sex and habitat residence, of silver American eels from the East River, Chester, Nova Scotia. > 50% fw = freshwater habitat
DISCUSSION
Back-calculation procedures
The OR-TL relation differs between the elver and the older yellow and silver eel stages of the American eel. Otoliths may change shape as they grow through ontogenesis (Secor & Dean 1989, Hare & Cowen 1995). The eel otolith changes from roughly circular in elvers to ovate in older eels as the rostrum and postrostrum become more pronounced (Härkönen 1986, Doering & Ludwig 1990). The practice of fixing the origin of the regression of otolith radius on eel length at the mean length of glass eels upon entry to freshwater (e.g. Poole & Reynolds 1996a,b, Graynoth 1999, and Jelly-man 2001) may not be appropriate for American eels, because the accuracy of estimated lengths-at-age, particularly younger ages, is directly related to the fit of the OR-TL relation and the OR-TL model may be as important as selecting the appropriate back-calculation model (Schirripa 2002). When the OR-TL relation is tight, different proportional back-calcula-tion methods show little difference in results (Pierce et al. 1996), as was observed in this study. The method used by Poole & Reynolds (1996a,b) underestimated the annual growth (both sexes combined) of eels from the East River between Ages 1 and 2 by 14%, relative to the BPH method. The difference decreased with increasing age, up to Age 6 to 7, after which the growth was progressively overestimated, becoming different by 9% by Age 16 to 17. When a sufficient size range of eels is available, particularly including smaller eels, the relationship between otolith radius and body length is curvilinear (Graynoth 1999, Oliveira & McCleave 2002) when measured along the transverse plane and may be either curvilinear (this study) or linear (Fernandez-Delgado et al. 1989) when measured along the sagittal plane. Logarithmic trans-formation to linearize the otolith–fish length relation-ship for use in a proportional back-calculation model or the use of a non-linear back-calculation model may be appropriate.
Although the expectation is that otolith growth is proportional to body growth throughout a fish’s life (Campana 1990), otolith growth is not always propor-tionally coupled to somatic growth for European eels Anguilla anguilla (Holmgren 1996) or other species (Secor & Dean 1989, Wright 1991, Bradford & Geen 1992, Mosegaard et al. 1998). However, over longer growth periods the assumption of constant otolith growth scaling resulted in non-significant bias when a proportional back-calculation method was used (Holmgren 1996).
The high variability in length-at-age among individ-ual eels and in annindivid-ual growth increments within eels observed for the East River is typical of eels in other rivers (Panfili et al. 1994, Poole & Reynolds 1996b, Oliveira & McCleave 2002). Some of this variability is due to the difficulties of aging eels using polished otoliths (Panfili & Ximenes 1992), particularly older eels where annuli may be closely spaced at the otolith edge, and may result in underestimating the age and, thus, overestimating the growth rate of some eels.
The inability to sample the entire run of silver eels creates potential biases. The silver eels sampled at the start of the run may have been smaller, younger and faster growing than the run average, particularly the females (Jessop 1987), which could result in over-estimated mean growth rates. Relative, rather than absolute, comparisons may be less affected as are issues pertaining to the growth of individual eels.
Growth differences between sexes
Female anguillid eels typically mature sexually at larger sizes and older ages than do male eels (Helfman et al. 1987, Vøllestad 1992, Panfili et al. 1994, Poole & Reynolds 1996b, Holmgren et al. 1997, Oliveira 1999, Tzeng et al. 2000a, Oliveira & McCleave 2002). In the East River, female silver eels were larger than males, but the age at migration was marginally not signifi-cantly different between males and females. Signifi-cant differences in length-at-age between males and
Group N L∞ 95% CI K 95% CI t0 95% CI r2 Male > 50% fw 17 463.7 398.3–529.0 0.066 0.051–0.084 –0.917 –1.294 to –0.541 0.91 Male < 50% fw 18 656.8 531.9–781.6 0.047 0.035–0.061 –0.965 –1.241 to –0.688 0.96 Female > 50% fw 13 560.5 496.4–624.6 0.068 0.055–0.083 –0.434 –0.731 to 0.136 0.93 Female < 50% fw 13 1241.3 957.5–1525.2 0.027 0.020–0.037 –0.672 –0.957 to 0.386 0.96 Male total 35 491.5 441.2–541.8 0.066 0.055–0.078 –0.819 –1.054 to –0.583 0.92 Female total 26 862.8 736.1–989.5 0.040 0.032–0.049 –0.658 –0.915 to 0.401 0.93 Table 5. Anguilla rostrata. Parameter estimates and Wald 95% CI for the von Bertalanffy growth equation, by sex and sex by habitat residence, for silver American eels from the East River, Chester, Nova Scotia. > 50% fw = freshwater habitat residence,
females began at Age 6, an age at which Oliveira & McCleave (2000) found that over 40% of American eels were sexually differentiated (growth rates to Age 6 were comparable for each sex between studies).
The VBGF growth model has often been used for anguillid eels (Moriarty 1983, Fernández-Delgado 1989, Poole & Reynolds 1996a,b, Tzeng et al. 2000a), but it is only one of several growth models (Quinn & Deriso 1999). A comparison of the VBGF and Gompertz asymptotic growth models indicated that the VBGF model best fitted the data, particularly when the increased variability in length-at-age with increasing age was considered. The fitting of any growth curve to eel lengths-at-age may be biased at older ages by the departure of faster growing, earlier maturing eels, so that older age cohorts consist of slower growing fish. The use of back-calculated lengths-at-age from indi-vidual silver eels rather than mean lengths-at-age from a sample of eels of all maturity stages may reduce this problem.
Female growth rates are usually higher than for males (Panfili et al. 1994, Oliveira 1999, Svedäng 1999, Oliveira & McCleave 2002, Tzeng et al. 2003, this study), but some eel stocks show higher growth rates for males than for females (Poole & Reynolds 1996b, Holmgren et al. 1997). Despite a higher L∞and lower K value for females than for males, as noted also by Poole & Reynolds (1996a,b) and Tzeng et al. (2000), the observed average annual growth of females was higher than for males. Thus, although males may approach their theoretical maximum mean length more quickly than females, their observed annual growth rates are less than for females. A negative rela-tion between observed growth rate and age at migra-tion appears common (Vøllestad 1992, Svedäng et al. 1996, Jellyman 2001, Oliveira & McCleave 2002, this study). Given that faster growing eels begin matura-tion and downstream migramatura-tion at younger ages than do slower growing eels, and that both sexes tend to migrate at lengths less than their theoretical average maximum (Poole & Reynolds 1996b, Svedäng et al. 1996, Tzeng et al. 2000), the use of K as an indicator of growth rate is not equivalent to the use of observed annual growth rates in the interpretation of growth because they examine different aspects of growth (Wang & Milton 2000).
The sexual maturation of male eels is consistent with a time-minimizing life-history strategy (Helfman et al. 1987, Vøllestad 1992, Oliveira 1999), but the strategy for female eels is less clear (Svedäng et al. 1996, Holmgren et al. 1997, Oliveira 1999, Jellyman 2001). Oliveira (1999) hypothesized that female age and size at maturation may be optimized over a continuum between a time-minimizing strategy and a size-maxi-mizing strategy according to habitat conditions, so as
to reach an optimal size and body condition for migra-tion, relative to the habitat, in minimal time. Jellyman (2001) provides further evidence in support of this hypothesis, as do Oliveira & McCleave (2002), who also conclude that eels have evolved growth strategies and rates intrinsic to each sex that enable them to adapt successfully to a wide range of habitats.
Growth differences between migratory contingents
Annual growth rates for eels are influenced by envi-ronmental conditions such as habitat productivity, sea-sonal water temperatures, and the duration of the growth season that vary geographically, particularly with latitude (Tesch 1977, Fernandez-Delgado et al. 1989, Vøllestad 1992, Panfili et al. 1994). The low-pH, low-productivity waters of the East River, resulted in a mean annual growth rate of 20.5 mm yr–1for individual male silver eels and 25.2 mm yr–1for female silver eels. In Maine at a latitude similar to the East River, mean annual growth rates were 26.1 mm yr–1for male yellow eels to Age 11 and 30.9 mm yr–1to Age 14 for females (recalculated from Oliveira & McCleave 2002), and in a more southern Rhode Island river, mean growth was 30.9 mm yr–1for male silver eels and 39.8 mm yr–1for female silver eels (Oliveira 1999). The mean annual growth of female silver eels was estimated at 41 mm yr–1 in the Medway River and at 51 mm yr–1 in the LaHave River of Nova Scotia (Jessop 1987), both of which have higher pHs than the East River (Watt et al. 1995). A mean annual growth of 20.8 mm yr–1 was found for silver Anguilla anguilla from a low pH, oligotrophic lake in Ireland (Poole & Reynolds 1996b). Optimal growth for European eels occurs at water temperatures between 22 and 26.5°C (Panfili et al. 1994) and at similar temperatures for American eel elvers (Peterson & Martin-Robichaud 1994) and, prob-ably, juvenile eels. In the East River, such water tem-peratures occur in the river only for a few weeks, at most, during July and August and rarely, if ever, in the associated estuary (Jessop et al. 2002, Jessop 2003c).
Fish migration between marine and freshwater habi-tats may generally be explained by the difference in food productivity, and catadromy occurs primarily in tropical latitudes where freshwater productivity ex-ceeds marine productivity (Gross 1987, Gross et al. 1988). Consequently, temperate-zone eels inhabiting a more productive estuarine area would be expected to show higher growth rates, as was observed in this study. However, Tzeng et al. (2003) also observed higher growth in estuarine-resident Japanese eels from semi-tropical areas such as Taiwan and southern China and from the more temperate southern Japan. More generally, Oliveira & McCleave (2000)
hypothe-sized that growth (environmental) conditions are the primary factor influencing the size and age of eels at migration, and further that habitats with similar envi-ronmental conditions will produce eels with similar traits and life-history styles. Consequently, different habitats will produce eels with different traits and life-history styles, evidence for which is found in the latitu-dinal clines in biological factors such as decreasing growth rate and increasing age and size at migration (Helfman et al. 1987, Vøllestad 1992, Oliveira 1999), more rapid growth in estuarine than in freshwater habitats (Helfman et al. 1984, Fernández-Delgado et al. 1989) and the occurrence and proportion of eels that migrate between fresh- and saltwaters (Tsukamoto & Arai 2001, Jessop et al. 2002).
Silver-stage American eels of both sexes that had primarily estuarine residence histories grew more rapidly and attained longer lengths-at-age and at migration than did eels with a primarily freshwater his-tory. These results, and the observation by Jessop et al. (2002) that 64% of silver eels sampled from the East River showed evidence of migrating periodically between fresh and marine waters, indirectly support the hypothesis that sea residency by anguillid eels should occur more frequently at higher latitudes where freshwater productivity is lower than in adjacent coastal areas, as eels seek to maximize the relative benefits of each habitat type (Gross 1987, Tsukamoto & Arai 2001, Tsukamoto et al. 2002). However, Morrison et al. (2003) found that 65% of yellow eels in the lower portion of the more southerly Hudson River, New York, had migrated from fresh to estuarine waters, suggest-ing that perhaps factors other than latitude influence the relation between the frequency of migration and latitude. The reduction of mortality risk by changing habitats, particularly at younger ages (Mann 2000), but also for larger eels that have relatively slow growth and delayed maturity, may also be important, as may relative eel density in lower stream reaches.
American eels occur in continental North America to ca. 54° N latitude, Asian eels occur to ca. 45° N latitude while European eels occur to 71° N latitude in northern Norway and the White Sea coast of Russia (Tesch 1977). The northern distributions of temperate-zone Anguilla are influenced largely by the effects of northern flow-ing tropical and southward flowflow-ing subarctic coastal currents, such as the southward flowing Labrador and northward flowing Gulf Stream currents along the eastern coast of North America and the southward flowing Kurile and Oyashio currents and northward flowing Kuroshio and Tsushima currents off the east-ern coast of Asia (Tesch 1977, Longhurst 1998). These currents differ in pattern from the eastward and north-ward flowing North Atlantic and Norwegian Coastal currents that warm the European Atlantic coast.
Anguillid eels have not yet been identified as having the antifreeze glycopeptides or the antifreeze proteins of other species of Arctic and Antarctic fishes (Fletcher et al. 1998) that would prevent their freezing at temperatures below –0.7°C when seawater may reach temperatures of –1.9°C before freezing. The –1°C isotherm of winter coastal water temperatures and the extent of coastal ice formation and their effects on over-winter survival in estuarine and coastal areas may set a northern limit on the latitude beyond which increased coastal residence or freshwater/estuarine migratory behaviour might occur. At the northern extremes of the range of American and Japanese eels, an extended period of coastal ice conditions and low coastal water temperatures create a relatively short period suitable for eel growth, while the Atlantic coast of northern Europe remains above 3.3°C south of ca. 68° N latitude, although the Baltic Sea north of ca. 55° N develops extensive winter ice cover (US Naval Oceanographic Office 1967, Longhurst 1998, Cana-dian Ice Service 2001). Thus, the northern extent of estuarine and coastal residence and periodic migration between fresh and estuarine waters may be greater in Europe, relative to North America and Asia, because of the more favorable coastal environmental conditions.
Approximately 63% of the estimated available eel habitat in Europe is in coastal and estuarine waters, of which 93% occurs north of France, primarily in Scan-dinavia and the Baltic Sea (Moriarty & Dekker 1997). About 67% of the European catch of yellow and silver eels occurs north of France, with ca. 50% of the catch occurring in saline waters. Few European eel fisheries occur north of ca. 60° N and eel abundance and productivity evidently declines as habitat suitability declines. The relative abundance of coastal and estuar-ine resident eels in North America is unknown (Haro et al. 2000), but they occur from the southern United States (Hansen & Eversole 1984, Helfman et al. 1984), if not further south, to the Maritime Provinces of Canada (Smith & Saunders 1955, Eales 1968, Medcof 1969) and even the Atlantic coast of Newfoundland, if brackish water coastal ponds are considered (Gray & Andrews 1971). Japanese eels with histories of sea residence and of freshwater-estuarine migration occur from the semi-tropical coastal and estuarine waters of Taiwan and southern China to the more temperate waters of southern Japan (Tsukamoto & Arai 2001, Tzeng et al. 2002, 2003) and northern Japan (Arai et al. 2003), almost to the northern limit of their range (Tesch 1977), but their relative abundance is unknown (Tsukamoto & Arai 2001). The proportion of sea resi-dent eels may increase with increasing latitude but the proportion of migratory eels shows little difference to near 35° N latitude (Tzeng et al. 2003). About 60 to 80% of Japanese eels in coastal areas between 22 and
35° N latitude may be migratory between freshwater and estuary (Tsukamoto & Arai 2001, Tzeng et al. 2002, 2003), but at ca. 40° N the density and proportion of migratory fish may be lower (Arai et al. 2003). Differ-ences in relative productivity or habitat suitability between the rivers and estuaries of mountainous Tai-wan and the coastal plains of southern China may also occur (e.g. Tzeng et al. 2002), perhaps related to the relative inflow of freshwater and stream geomorphol-ogy (Mann 2000). Thus, the coastal interplay of north-ward-flowing tropical currents and southward flowing subarctic currents and their effect on estuarine condi-tions and productivity and other factors may modify a strictly latitudinal approach to the marine/freshwater distribution of temperate zone anguillid eels.
It has become increasingly evident that American, European and Japanese eels, if not other anguillids such as Anguilla marmorata (Shiao et al. 2003), have complex, geographically varied, migratory histories which can affect their growth, age and size at sexual maturation, and which require consideration in their stock management. Further research, particularly at the extremes of their geographic distributions, is needed to clarify the residence patterns of northern hemisphere anguillid eels relative to the hypothesis of a latitudinal cline in the abundance of marine resident eels.
Acknowledgements. We thank K. Marshall, J. Orser, D. Schnare, D. Sutherland and S. Ratelle for their assistance in various aspects of the collection and processing of the eel samples, W. Blanchard and C. Harvie for statistical assistance and D. Cairns for reviewing the manuscript. The National Science Council, Republic of China, provided financial support for the otolith analysis through Grant Number NSC-89-2313-B002-077.
LITERATURE CITED
Arai T, Kotake A, Ohji M, Miller MJ, Tsukamoto K, Miyazaki N (2003) Occurrence of sea eels of Anguilla japonica along the Sanriku coast of Japan. Ichthyol Res 50:78–81 ASMFC (Atlantic States Marine Fisheries Commission) (2000)
Interstate fishery management plan for the American eel. ASMFC Fishery Management Rep No 36. ASMFC, Washington, DC
Avise JC, Helfman GS, Saunders NC, Hales LS (1986) Mito-chondrial DNA differentiation in North Atlantic eels: population genetic consequences of an unusual life history pattern. Proc Natl Acad Sci USA 83:4350–4354
Bath GE, Thorrold SR, Jones CM, Campana SE, McLaren JW, Lam JWH (2000) Strontium and barium uptake in arago-nitic otoliths of marine fish. Geochim Cosmochim Acta 64: 1705–1714
Bertin L (1956) Eels: a biological study. Cleaver-Hume Press, London
Bouillon DR, Haedrich RL (1985) Growth of silver eels (Anguilla rostrata) in two areas of Newfoundland. J NW Atl Fish Sci 6:95–100
Bowen WD, Stobo WT, Smith SJ (1992) Mass changes of grey
seal Halichoerus grypus pups on Sable Island: differen-tial maternal investment reconsidered. J Zool Lond 227: 607–622
Bradford MJ, Geen GH (1992) Growth estimates from otolith increment widths of juvenile Chinook salmon (Onco-rhynchus tshawytscha) reared in changing environments. J Fish Biol 41:825–832
Campana SE (1990) How reliable are growth back-calculations based on otoliths? Can J Fish Aquat Sci 47:2219–2227 Campana SE (1999) Chemistry and composition of fish
oto-liths: pathways, mechanisms and applications. Mar Ecol Prog Ser 188:263–297
Canadian Ice Service (2001) Sea ice climate atlas, East coast of Canada 1971–2000. Envir Canada, Ottawa
Chambers RC, Miller TJ (1995) Evaluating fish growth by means of otolith increment analysis: special properties of individual-level longitudinal data. In: Secor DH, Dean JM, Campana SE (eds) Recent developments in fish otolith research. The Belle W. Baruch Library in Marine Science No 19. University of South Carolina Press, Columbia, SC, p 155–175
Chen Y, Jackson DA, Harvey HH (1992) A comparison of von Bertalanffy and polynomial functions in modeling fish growth data. Can J Fish Aquat Sci 49:1288–1235 Cohen J (1988) Statistical power analysis for the behavioral
sciences, 2nd edn. Lawrence Erlbaum Associates, Hills-dale
Dekker W (2000) Impact of yellow eel exploitation on spawner production in Lake Ijsselmeer, the Netherlands. Dana 12:17–32
Dekker W et al. (2003) Quebec declaration of concern. Fisheries 28:28–30
Doering P, Ludwig J (1990) Shape analysis of otoliths — a tool for indirect ageing of eel, Anguilla anguilla (L.)? Int Rev Hydrobiol 75:737–743
Eales JG (1968) The eel fisheries of eastern Canada. Fish Res Board Can Bull 166
Elsdon TS, Gillanders BM (2002) Interactive effects of tem-perature and salinity on otolith chemistry: challenges for determining environmental histories of fish. Can J Fish Aquat Sci 59:1796–1808
Fernández-Delgado C, Hernando JA, Herrera M, Bellido M (1989) Age and growth of yellow eels, Anguilla anguilla, in the estuary of the Guadalquivir River (southwest Spain). J Fish Biol 34:561–570
Fletcher GL, Goddard SV, Davies PL, Gong Z, Ewart KV, Hew CL (1998) New insights into fish antifreeze proteins: physiological significance and molecular regulation. In: Poertner HO, Playle RC (eds) Cold ocean physiology. Soc Exp Biol Sem Ser No 66, Society of Experimental Biology, p 239–265
Francis RICC (1990) Back-calculation of fish length: a critical review. J Fish Biol 36:883–902
Francis RICC (1995) The analysis of otolith data — a mathe-matician’s perspective (what, precisely, is your model?). In: Secor DH, Dean JM, Campana SE (eds) Recent devel-opments in fish otolith research. The Belle W. Baruch Library in Marine Science No 19. University of South Carolina Press, Columbia, SC, p 81–94
Gray RW, Andrews CW (1971) Age and growth of the Ameri-can eel (Anguilla rostrata) (LeSueur) in Newfoundland waters. Can J Zool 49:121–128
Graynoth E (1999) Improved otolith preparation, ageing and back-calculation techniques for New Zealand freshwater eels. Fish Res 42:137–146
Gross MR (1987) Evolution of diadromy in fishes. Am Fish Soc Symp 1:14–25
Gross MR, Coleman RM, McDowall RM (1988) Aquatic pro-ductivity and the evolution of diadromous fish migration. Science 239:1291–1293
Haddon M (2001) Modelling and quantitative methods in fisheries. Chapman & Hall/CRC, Boca Raton, FL
Hansen RA, Eversole RG (1984) Age, growth, and sex ratio of American eels in brackish water portions of a South Carolina river. Trans Am Fish Soc 113:744–749
Hare JA, Cowen RK (1995) Effect of age, growth rate, and ontogeny on the otolith size — fish size relationship in bluefish, Pomatomus saltatrix, and the implications for back-calculation of size in fish early life history stages. Can J Fish Aquat Sci 52:1909–1922
Härkönen T (1986) Guide to the otoliths of the bony fishes of the northeast Atlantic. Danbiu ApS, Biological Consul-tants, Hellerup
Haro A, Richkus W, Whalen K, Hoar A, Busch WD, Lary S, Brush T, Dixon D (2000) Population decline of the American eel: implications for research and management. Fisheries 25(9):7–16
Helfman GS, Bozeman EL, Brothers EB (1984) Size, age, and sex of American eels in a Georgia river. Trans Am Fish Soc 113:132–141
Helfman GS, Facey DE, Hales LS Jr, Bozeman EL Jr (1987) Reproductive ecology of the American eel. Am Fish Soc Symp 1:42–56
Holmgren K (1996) Otolith growth scaling of the eel, Anguilla anguilla (L.), and back-calculation errors revealed from alizarin labeled otoliths. Nordic J Freshw Res 72:71–79 Holmgren K, Wickström H, Clevestam P (1997) Sex-related
growth of European eel, Anguilla anguilla, with focus on median silver eel age. Can J Fish Aquat Sci 54:2775–2781 ICES (International Council for the Exploration of the Sea)
(2001) Report of the ICES/EIFAC Working Group on Eels. ICES CM2001/ACFM: 03
ICES (International Council for the Exploration of the Sea) (2003) Report of the ICES/EIFAC Working Group on Eels. ICES CM2003/ACFM: 06
Jellyman D (2001) The influence of growth rate on the size of migrating female eels in Lake Ellesmere, New Zealand. J Fish Biol 58:725–736
Jessop BM (1987) Migrating American eels in Nova Scotia. Trans Am Fish Soc 116:161–170
Jessop BM (2000) Estimates of population size and instream mortality rate of American eel elvers in a Nova Scotia river. Trans Am Fish Soc 129:514–526
Jessop BM (2003a) The run size and biological characteristics of American eel elvers in the East River, Chester, Nova Scotia, 2000. Can Tech Rep Fish Aquat Sci No 2444 Jessop BM (2003b) Annual and seasonal variability in the size
and biological characteristics of the runs of American eel elvers to two Nova Scotia rivers. In: Dixon DA (ed) Biology, management, and protection of catadromous eels. Am Fish Soc Symp 33:17–36
Jessop BM (2003c) Annual variability in the effects of water temperature, discharge, and tidal stage on the migration of American eel elvers from estuary to river. In: Dixon DA (ed) Biology, management, and protection of catadromous eels. Am Fish Soc Symp 33:3–16
Jessop BM, Shiao JC, Iizuka Y, Tzeng WN (2002) Migratory behaviour and habitat use by American eels Anguilla ros-trata as revealed by otolith microchemistry. Mar Ecol Prog Ser 233:217–229
Kawakami Y, Mochioka N, Morishita K, Tajima T, Nakagawa H, Toh H, Nakazono A (1998) Factors influencing otolith strontium/calcium ratios in Anguilla japonica elvers. Environ Biol Fish 52:299–303
Krueger WH, Oliveira K (1997) Sex, size, and gonad morpho-logy of silver American eels Anguilla rostrata. Copeia 1997:415–420
Longhurst A (1998) Ecological geography of the sea. Academic Press, San Diego
Mann KH (2000) Ecology of coastal waters with implications for management, 2nd edn. Blackwell Science, Malden Medcof JC (1969) Fishermen’s reports of freshwater and
salt-water migrations of Nova Scotia eels (Anguilla rostrata). Can Field Nat 83:132–138
Moriarty C (1983) Age determination and growth rate of eels Anguilla anguilla (L). J Fish Biol 23:257–264
Moriarty C, Dekker W (eds) (1997) Management of the European eel. Mar Inst Fish Bull No 15, Dublin
Morrison WE, Secor DH, Piccoli PM (2003) Estuarine habitat use by Hudson River American eels as determined by otolith strontium:calcium ratios. In: Dixon DA (ed) Biology, management, and protection of catadromous eels. Am Fish Soc Symp 33:87–100
Mosegaard H, Svedang H, Taberman K (1988) Uncoupling of somatic and otolith growth rates in Arctic charr (Salve-linus alpinus) as an effect of differences in temperature response. Can J Fish Aquat Sci 45:1514–1524
Oliveira K (1996) Field validation of annular growth rings in the American eel, Anguilla rostrata, using tetracycline-marked otoliths. US Fish Bull 94:186–189
Oliveira K (1999) Life history characteristics and strategies of the American eel, Anguilla rostrata. Can J Fish Aquat Sci 56:795–802
Oliveira K, McCleave JD (2000) Variation in population and life history traits of the American eel, Anguilla rostrata, in four rivers in Maine. Environ Biol Fishes 59:141–151 Oliveira K, McCleave JD (2002) Sexually different growth
histories of the American eel in four rivers in Maine. Trans Am Fish Soc 131:203–211
Otake T, Ishii T, Nakahara M, Nakamura R (1994) Drastic changes in otolith strontium/calcium ratios in leptocephali and glass eels of Japanese eel Anguilla japonica. Mar Ecol Prog Ser 112:189–193
Panfili J, Ximenes MC (1992) Measurements on ground or sectioned otoliths: possibilities of bias. J Fish Biol 41: 201–207
Panfili J, Ximénès MC, Crivelli AJ (1994) Sources of variation in growth of the European eel (Anguilla anguilla) esti-mated from otoliths. Can J Fish Aquat Sci 51:506–515 Peterson RH (ed) (1997) The American eel in eastern Canada:
stock status and management strategies. Proc Eel Work-shop, January 13–14, 1997, Québec City. Can Tech Rep Fish Aquat Sci No 2196
Peterson, RH, Martin-Robichaud DJ (1994) First feeding and growth of elvers of the American eel (Anguilla rostrata Lesueur) at several temperature regimes. Can Tech Rep Fish Aquat Sci No 2013
Pierce CL, Rasmussen JB, Leggett WC (1996) Back-calculation of fish length from scales: empirical comparison of propor-tional methods. Trans Am Fish Soc 125:889–898
Poole WR, Reynolds JD (1996a) Age and growth of yellow eel, Anguilla anguilla (L.), determined by two different methods. Ecol Freshw Fish 5:86–95
Poole WR, Reynolds JD (1996b) Growth rate and age at migration of Anguilla anguilla. J Fish Biol 48:633–642 Quinn TJ ll, Deriso RB (1999) Quantitative fish dynamics.
Oxford University Press, New York
Ricker WE (1975) Computations and interpretation of bio-logical statistics of fish populations. Fish Res Board Can Bull 191
on life-history evolution: disentangling phenotypic and genetic effects in changes in maturation and reproduction of North Sea plaice, Pleuronectes platessa L. Oecologia 96:391–401
SAS (2001) Proc mixed, Release 8.2. SAS Institute, Cary, NC Schirripa MJ (2002) An evaluation of back-calculation method-ology using simulated otolith data. US Fish Bull 100: 789–799
Secor DH (1999) Specifying divergent migrations in the concept of stock: the contingent hypothesis. Fish Res 43: 13–34
Secor DH, Dean JM (1989) Somatic growth effects on the otolith-fish size relationship in young pond-reared striped bass, Morone saxatilis. Can J Fish Aquat Sci 46: 113–121
Secor DH, Rooker JR (2000) Is otolith strontium a useful scalar of life cycles in estuarine fishes? Fish Res 46:359–371 Secor DH, Henderson-Arzapalo A, Piccoli PM (1995) Can
otolith microchemistry chart patterns of migration and habitat utilization in anadromous fishes. J Exp Mar Biol Ecol 192:15–33
Shiao JC, Iizuka Y, Chang CW, Tzeng WN (2003) Disparities in habitat use and migratory behavior between tropical eel Anguilla marmorata and temperate eel A. japonica in four Taiwanese rivers. Mar Ecol Prog Ser 261:233–242 Smith WM, Saunders JW (1955) The American eels in certain
fresh waters of the Maritime Provinces of Canada. J Fish Res Board Can 12:238–269
S-Plus (2001) S-Plus 6 for Windows. Insightful, Seattle Stokes K, Law R (2000) Fishing as an evolutionary force. Mar
Ecol Prog Ser 208:307–309
Svedäng H (1999) Vital population statistics of the exploited eel stock on the Swedish west coast. Fish Res 40:251–165 Svedäng H, Neuman E, Wickström H (1996) Maturation pat-terns in female European eel: age and size at the silver eel stage. J Fish Biol 48:342–351
Tatsukawa K (2003) Eel resources in East Asia. In: Aida K, Tsukamoto K, Yamauchi K (eds) Eel biology. Springer-Verlag, Tokyo, p 293–300
Tesch FW (1977) The eel: biology and management of An-guillid eels. Chapman & Hall, London
Trippel EA (1995) Age at maturity as a stress indicator in fisheries. Bioscience 45:759–771
Tsukamoto K, Arai T (2001) Facultative catadromy of the eelAnguilla japonica between freshwater and seawater habitats. Mar Ecol Prog Ser 220:265–276
Tsukamoto K, Aoyama J, Miller MJ (2002) Migration, specia-tion, and the evolution of diadromy in anguillid eels. Can J Fish Aquat Sci 59:1989–1998
Tzeng WN (1996) Effects of salinity and ontogenetic move-ments on strontium:calcium ratios in the otoliths of Japan-ese eel, Anguilla japonica Temminck and Schlegel. J Exp Mar Biol Ecol 199:11–122
Tzeng WN, Tsai YC (1994) Changes in otolith microchemistry of the Japanese eel, Anguilla japonica, during its migra-tion from the ocean to the rivers of Taiwan. J Fish Biol 45: 671–683
Tzeng WN, Wu HF, Wickström H (1994) Scanning electron microscope analysis of annulus microstructure in otolith of European eel, Anguilla anguilla. J Fish Biol 45:479–492 Tzeng WN, Severin KP, Wickström H (1997) Use of otolith
microchemistry to investigate the environmental history of European eel Anguilla anguilla. Mar Ecol Prog Ser 149: 73–81
Tzeng WN, Lin HR, Wang CH, Xu SN (2000a) Differences in size and growth rates of male and female migrating Japanese eels in Pearl River, China. J Fish Biol 57: 1245–1253
Tzeng WN, Wang CH, Wickström H, Reizenstein M (2000b) Occurrence of the semi-catadromous European eel Anguilla anguilla in the Baltic Sea. Mar Biol 137:93–98 Tzeng WN, Shiao JC, Iizuka Y (2002) Use of otolith Sr:Ca
ratios to study the riverine migratory behaviors of Japan-ese eel Anguilla japonica. Mar Ecol Prog Ser 245:213–221 Tzeng WN, Iizuka Y, Shiao JC, Yamada Y, Oka HP (2003)
Identification and growth rates comparison of divergent migratory contingents of Japanese eel (Anguilla japonica). Aquaculture 216:77–86
US Naval Oceanographic Office (1967) Oceanographic atlas of the North Atlantic Ocean, Section II, Physical proper-ties. Publication No 700. US Naval Oceanographic Office, Washington, DC
Vøllestad LA (1992) Geographic variation in age and length at metamorphosis of maturing European eel: environmental effects and phenotypic plasticity. J Anim Ecol 61:41–48 Wang YG, Milton DA (2000) On comparison of growth curves:
How do we test whether growth rates differ? US Fish Bull 98:874–880
Watt WD (1986) The case for liming some Nova Scotia salmon waters. Water Air Soil Pollut 31:775–789
Watt WD, Scott CD, Mandell P (1995) Water chemistry data from a monitoring program designed to detect changes in the long range transport of acidic pollutants into Nova Scotia’s acidified Atlantic salmon rivers. Can Data Rep Fish Aquat Sci 972
Wright PJ (1991) The influence of metabolic rate on otolith increment width in Atlantic salmon parr, Salmo salar L. J Fish Biol 38:929–933
Editorial responsibility: Kenneth Sherman (Contributing Editor), Narragansett, Rhode Island, USA
Submitted: July 25, 2003; Accepted: January 15, 2004 Proofs received from author(s): April 22, 2004